VIDYA Enhanced

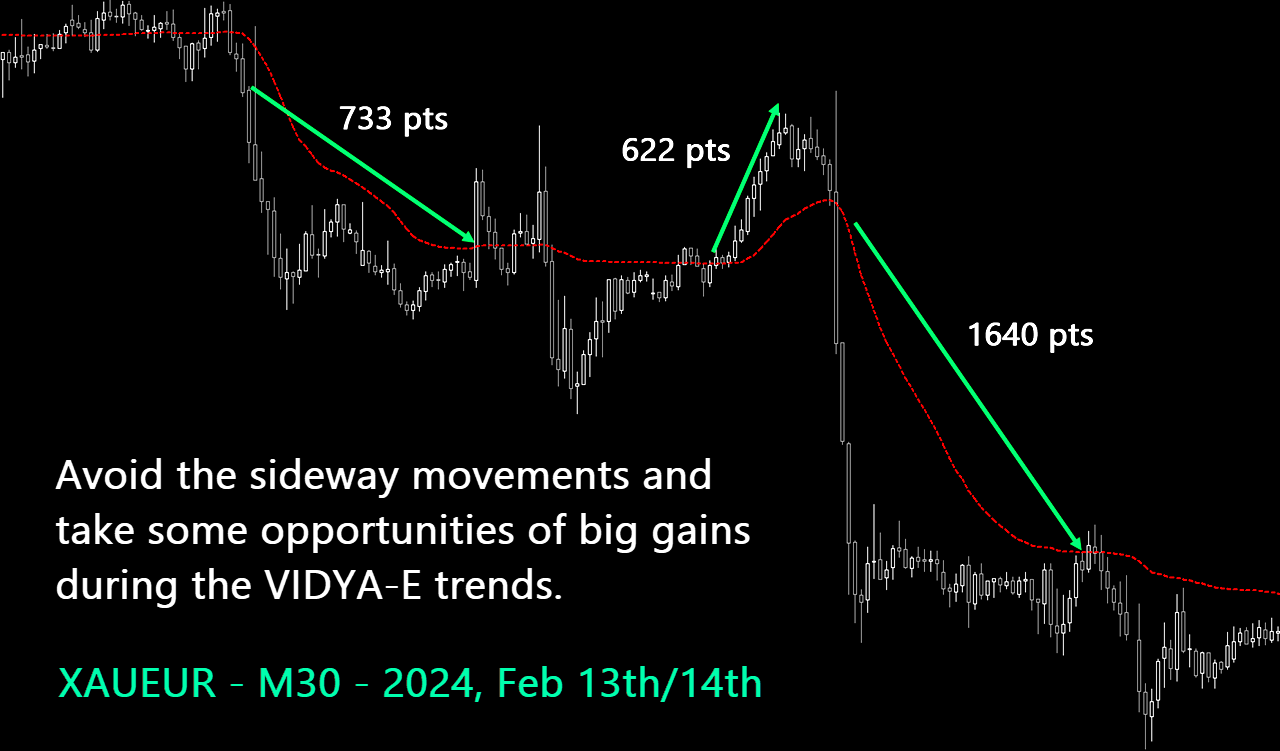
L'indicatore VIDYA-ENHANCED (Variable Index Dynamic Average) è uno strumento di analisi tecnica utilizzato per identificare tendenze e movimenti laterali.

Regola dinamicamente la sua sensibilità in base alla volatilità del mercato, utilizzando il Chande Momentum Oscillator come indice di volatilità. Questa caratteristica permette a VIDYA-ENHANCED di essere più agile durante i periodi di movimenti significativi dei prezzi, rimanendo più stabile durante le fasi di minore volatilità. 

Caratteristiche:

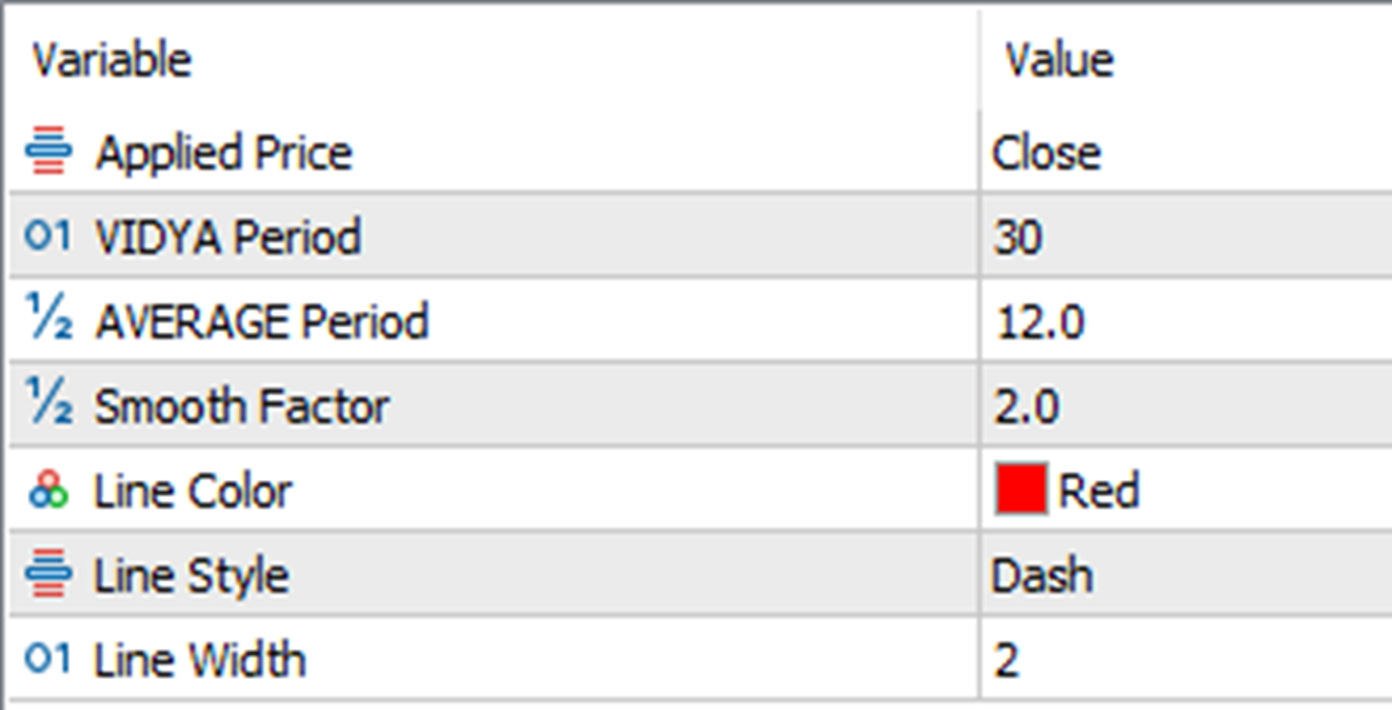
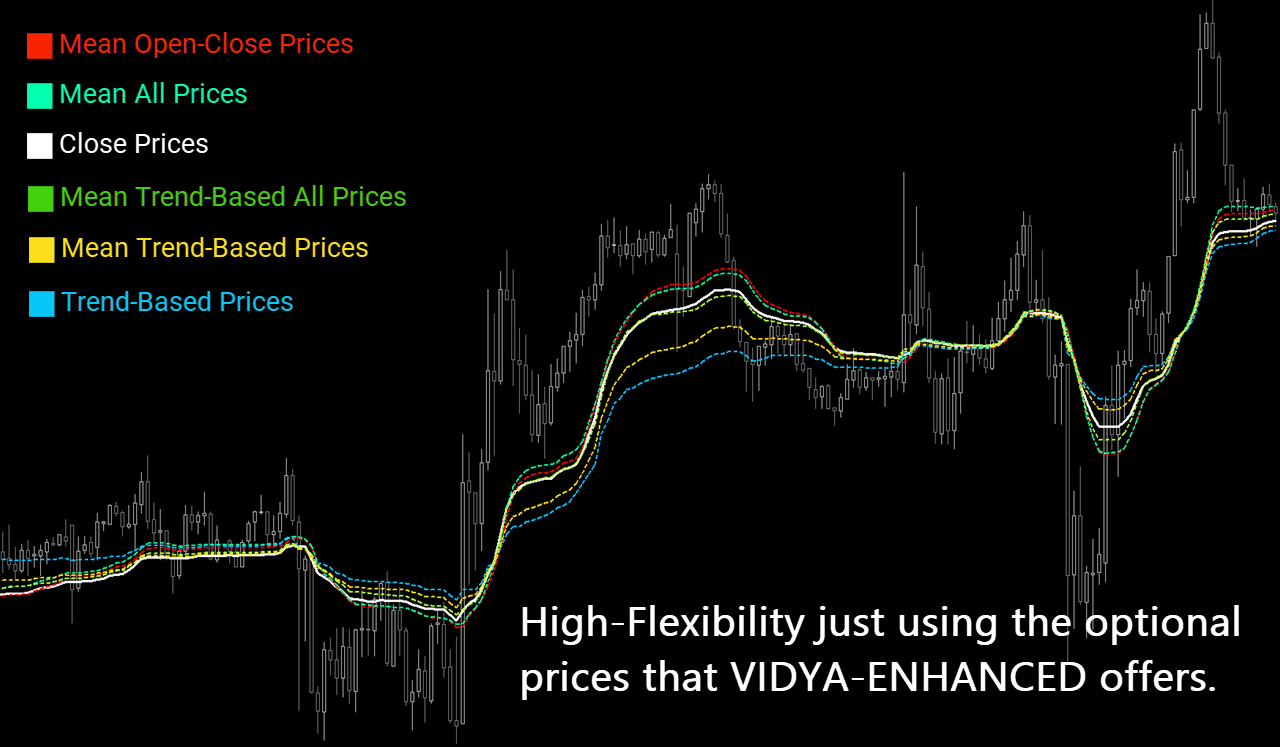
- Selezione del prezzo tra 12 opzioni - 5 in più rispetto allo standard Metatrader!
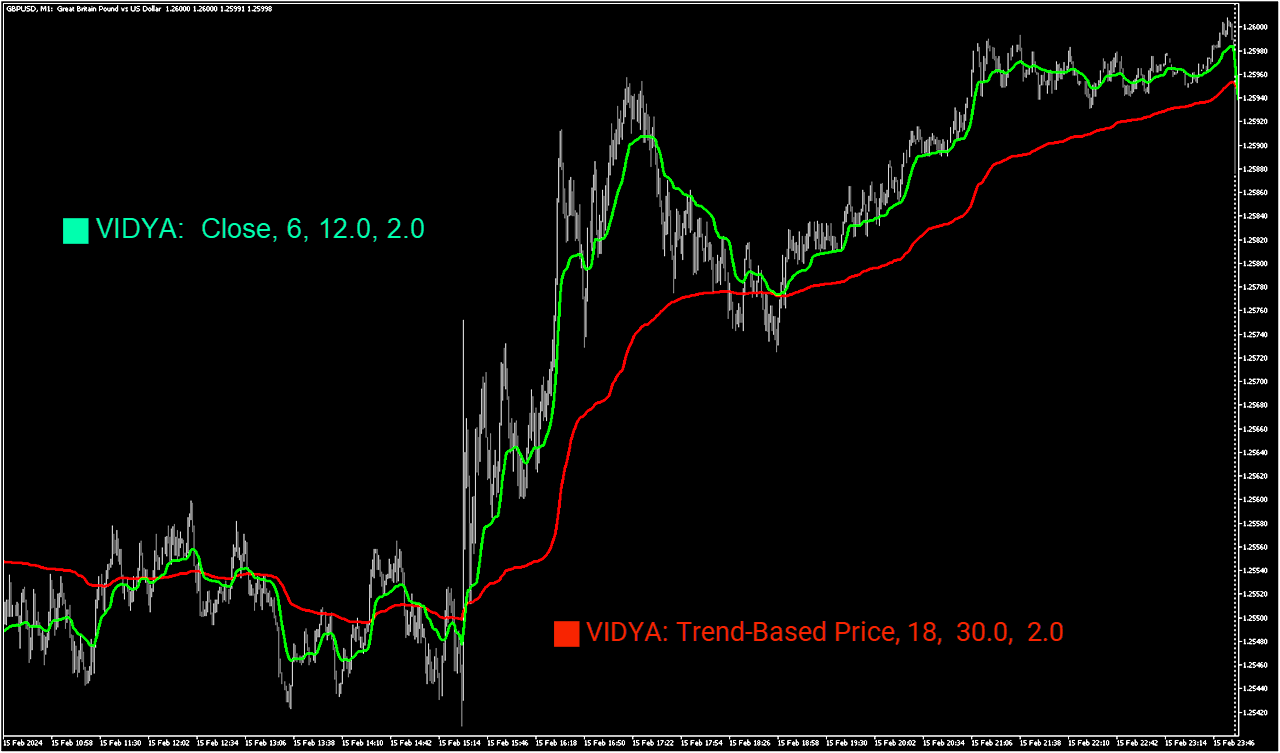
- Selezionare i periodi VIDYA e EMA.
- Modificare il colore, il tipo e la larghezza della linea VIDYA.
Prodotti consigliati
LR Pivots Combo Statistics That Show You Where the Market Stands! Key Features (updated V2.1) 1. Auto-Plotting Linear Regression Channel Trend Direction — Uses slope (normalized by ATR) to identify whether the market is in an uptrend, downtrend, or ranging sideways. Trend Quality (R-Squared) — Tells you if the trend is statistically consistent (Stable) or just noise (Volatile). Useful for filtering out unreliable setups. Standard Deviation Bands — Shows how far price has deviated from the regre
FREE
I recommend you to read the  product's blog  (manual) from start to end so that it is clear from the beginning what the indicator offers. This multi time frame and multi symbol supply and demand zone dashboard indicator sends alerts when the price has reached a supply/demand zone. It is also possible to use it to be alerted about regular double tops/bottoms instead of zones. It can be used with all time frames from M1 to MN. Maximum 9 time frames can be shown in the dashboard at the same time. 
If you are unsure how to use this indicator, please feel free to reach out to me. I will explain it to you and provide reading materials to help you make the most of it. TD Sequential Scanner: An Overview The TD Sequential scanner is a powerful technical analysis tool designed to identify potential price exhaustion points and trend reversals in financial markets. Developed by Tom DeMark, this method is widely used by traders to gauge market cycles and potential turning points with precision. Ho
Indicatore Timer Prezzo Bid — Tempismo di Precisione e Tracciamento Intelligente del Prezzo! Porta la tua precisione nel trading al livello successivo con l’ Indicatore Timer Prezzo Bid — uno strumento potente progettato per i trader che valorizzano tempismo, precisione e chiarezza in ogni movimento. Caratteristiche principali: Display Timer Fisso – Sempre visibile sul lato destro del grafico (X_Offset personalizzabile). Tracciamento Dinamico del Prezzo – Il timer si muove flui
Questo indicatore è un indicatore per l'analisi automatica delle onde perfetto per il trading pratico! Caso... Nota:   non sono abituato a usare nomi occidentali per la classificazione delle onde a causa dell'influenza della convenzione di denominazione di Tang Lun (Tang Zhong Shuo Zen), ho chiamato l'onda base come   penna   e la banda dell'onda secondaria come   segmento   At allo stesso tempo, il segmento ha la direzione del trend. La denominazione   è principalmente segmento di trend   (que
==================================================================== SMT DIVERGENCE - NASDAQ vs S&P500 (NAS100 / US500) MQL5 Market Product Description ==================================================================== PRODUCT NAME: SMT Divergence Nasdaq vs S&P500 | Smart Money Index Scalper SHORT DESCRIPTION (max 63 chars): Spot Nasdaq reversals using SMT Divergence with S&P500 ---------------------------------------------------------------------- FULL DESCRIPTION ---------------------
FREE
RSIScalperPro
PATRICK WENNING
Introducing RSIScalperPro - the revolutionary RSI-based indicator for Metatrader 5, specifically designed for scalping in the one-minute chart. With RSIScalperPro, you'll have a powerful toolkit for precise entry and exit signals to take your trading to the next level. RSIScalperPro utilizes two different RSI indicators that provide clear signals for overbought and oversold areas. You can customize the time periods and limit values of the two RSIs according to your preferences to achieve the be
Optimized Spike Detector Pro for MT5 is a professional-grade technical indicator designed to identify and capitalize on sharp, impulsive price movements (spikes) in any financial instrument. Utilizing a sophisticated, multi-algorithmic core, it distinguishes significant volatility expansions from market noise with exceptional accuracy. The tool dynamically adapts to changing market conditions, filtering out false signals and highlighting only high-probability spike setups in real-time. Featuring
Il Brilliant Reversals MultiCurrency Scanner MT5 è un indicatore di trading all'avanguardia progettato per i trader che cercano di identificare potenziali punti di inversione su più coppie di valute. Sfruttando algoritmi avanzati, questo strumento fornisce informazioni istantanee, rendendolo prezioso sia per i trader principianti che per quelli esperti che mirano a ottimizzare le loro strategie di trading. Questo indicatore potenzia i trader fornendo segnali di acquisto e vendita in tempo reale
Market session with fibonacci
Batsukh Sumchin Khuyagbaatar
Questo indicatore è l'indicatore più comune che utilizziamo ogni giorno, comprese le nostre strategie più utilizzate, ICT e SMC, limiti di stop loss e limiti di liquidità che si verificano negli orari di apertura e chiusura degli scambi, nonché il volume degli scambi con Fibonacci e lo zoom avanti e indietro, e le azioni più comuni che vuoi vedere, come la selezione del movimento di scambio che vuoi vedere e l'estrazione di Fibonacci, sono indicatori completamente automatici che ti consentono di
ATTENTION!!!Get this product at a discounted price NOW!!! Description of the Directional Strength Index mt5 I present to you this awesome indicator that concludes the trading armor of a trader seeking for a strong affirmative and insightful entries and exits confluences.The core idea that runs behind the indicator is generated from the famous children game " TUG OF WAR ".The market is depicted as being influenced by two forces :  buying and selling force. The indicator's work is to determine wh
Quantum Smart Money PRO – Institutional Trading Indicator (MT5) Quantum Smart Money PRO is a premium institutional-grade trading indicator for MetaTrader 5, built using Smart Money Concepts (SMC), market structure analysis, liquidity detection, and momentum confirmation. This system is designed for traders who demand precision entries, high-probability setups, and clean chart clarity across Forex, Gold (XAUUSD), Indices, and Crypto. Core Trading Logic Quantum Smart Money PRO identifies hi
ROC acceleration-deceleration is the manual system for medium-term scalping. Indicator based on custom ROC system which defines bullish/bearish market and especially  acceleration-deceleration of tendention in the market's main direction. Buy arrow is plotted during bearish market when current trend decelerates and sell  arrow is plotted during bullish market when current trend decelerates. Main Indicator's Features Signals are not repaint,non-late or disappear(exept cases when system recalculat
VLTL High Frequency Trader PRO
Jamal Mohammed Shlhadah Tarkhan
ON MARKETPLACE FOR ONE MONTH ONLY!! EVERY DAY YOU MISS IS ONE LESS DAY OF PROFIT. VLTL High Frequency Trader PRO VLTL High Frequency Trader PRO is an HFT bot designed for exceptionally high returns. It is built around trading volatile times on XAUUSD (Gold) using tick-based strategies that dominate the market. This bot is the first in the VLTL lineup, with even better and more advanced EAs coming in the future. The EA includes three built-in strategies , each tailored for a different purpose: La
Turpial Pullback
Arlos Elias Rivas Romero
Indicator Type Strategy (Pullback) for all Symbols and Periodicity, Preferably from 30M periodicity. Can be used for manual trading. Its workspace corresponds to channel of 3 bars of Bill Willians. Also relies on the indicator Rsi and Atr. BUY when: There is a Green Arrow STOPLOSS to buy, below the bottom line of the channel (red line)" SELL when: There is a Red Arrow. STOPLOSS to sell, above the upper line of the channel (blue line)
Smart Money Structure & Precision Trading Indicator (MT5) Smart Money Structure & Precision Trading Indicator  is a powerful Smart Money Concepts (SMC) indicator for MetaTrader 5, designed to help traders identify high-probability entries with institutional logic . This indicator automatically detects market structure in real time , highlights key liquidity levels , and provides clear, non-repainting signals so you can trade with confidence and precision. Whether you are a scalper, day trader, o
Linear Trend Predictor : indicatore di tendenza che combina punti di ingresso e linee di supporto direzionale. Funziona secondo il principio di rottura del canale dei prezzi alto/basso. L'algoritmo dell'indicatore filtra il rumore di mercato, tiene conto della volatilità e delle dinamiche di mercato. Capacità dell'indicatore Utilizzando metodi di smoothing, mostra l'andamento del mercato e i punti di ingresso per l'apertura di ordini di ACQUISTO o VENDITA. Adatto per determinare i movimenti d
Liquidity Map
Alex Amuyunzu Raymond
Liquidity Map  Overview The Liquidity Map indicator is an advanced visualization tool based on ICT Smart Money Concepts . It automatically identifies daily Buy Zones , Sell Zones , and Liquidity Levels , showing where price is likely to reverse or continue based on institutional order flow. It calculates key levels from the daily session — such as the previous day’s high, low, and midpoint — then derives a premium (sell bias) and discount (buy bias) structure. When price trades into these mapped
Glider
Vitalii Zakharuk
The Glider indicator gives accurate and timely signals to enter and exit the transaction that appear on the current candle. Using the indicator is very simple. When a dot and a blue line appear, open a buy deal. When a dot and a red line appear, open a sell deal. The main purpose of this indicator is to determine the moments of entry and exit from transactions, therefore the Glider indicator will display only the trend line and entry points, i.e. displays displays the entry points to the marke
Quantum VWAP Pro for MT5
QUANTUM TRADING SOFTWARE LIMITED
The VWAP indicator is another of our suite of volume indicators and one which was first referred to in 1988 when it appeared in an article entitled “The Total Cost Of Transactions On The NYSE” in the March edition of the Journal Of Finance from that year, which went on to explain its importance, particularly from an institutional perspective, which underpins its significance in appreciating the power and importance of this indicator. In many ways, it is akin to the volume price analysis methodol
Pullback EMA
Muhamad Adi Sujai
Massimizza il tuo Potenziale di Profitto con Pullback EMA EA – L'Algoritmo di Trading Intelligente e Sicuro Sei stanco del trading emotivo o di rimanere intrappolato nell'imprevedibilità del mercato? Ti presentiamo Pullback EMA EA , un Expert Advisor (EA) all'avanguardia progettato specificamente per i trader che privilegiano stabilità, precisione e protezione del capitale . Pullback EMA EA non è un semplice robot di trading; è il tuo assistente professionale, operativo 24 ore su 24, 5 giorn
SmartTrendMA
Jhones Jorente Garcia
A SmartTrendMA foi projetada para identificar melhor zonas de alta, baixa e consolidação, azul alta, vermelho baixa e branco consolidação, vai te auxiliar a identificar melhor a tendência. Em parâmetro regule melhor conforme sua preferência em grau pois cada par de moeda se adequa diferentemente a cor,mude também o período e se quiser mude exponencial ou simples. 
Alpha Trades
Andriy Sydoruk
Alpha Trades — Adaptive Professional Trading System Author: Andrii Sydoruk Version: 1.0 Release Date: 31.10.2025 Support: andriisydoruk@gmail.com Description Alpha Trades is a next-generation universal trading expert, designed for stable and controlled operation under any market conditions. The system uses an adaptive analytical approach that automatically adjusts to the current market structure while maintaining a high level of accuracy and safety. The algorithm is built as a multi-layer
Phantom Signals Pro
Aiman Saeed Salem Dahbag
5 (1)
Phantom Signal Pro – Professional Marketing Description Phantom Signal Pro is an advanced trading indicator designed to generate high-precision entry signals directly on the chart by analyzing market momentum and trend strength to identify the best buy and sell opportunities in real time. The indicator is built to provide traders with a clearer view of price action by filtering out weak signals and focusing only on high-probability opportunities that occur within strong market movements, helpin
FREE
Automated Supply and Demand Tracker MT5. The following videos demonstrate how we use the system for trade setups and analysis.US PPI, Fed Interest Rates, and FOMC Trade Setup Time Lapse: U.S. dollar(DXY) and Australian dollar vs U.S. dollar(AUD/USD)  https://youtu.be/XVJqdEWfv6s  The EUR/USD Trade Setup time lapse 8/6/23.  https://youtu.be/UDrBAbOqkMY . US 500 Cash Trade Setup time lapse 8/6/23  https://youtu.be/jpQ6h9qjVcU .  https://youtu.be/JJanqcNzLGM ,  https://youtu.be/MnuStQGjMyg,&nbsp ;
Trendline Breakout EA
Paballo Justice Tsoako
TB EA  – Trendline Breakout Expert Advisor Overview TB EA 1.0 is a professional-grade automated trading system that detects and executes trades based on trendline breakouts using a "body break" confirmation methodology. The EA intelligently distinguishes between support and resistance trendlines, executing BUY orders on resistance breakouts and SELL orders on support breakouts. It works seamlessly on Forex pairs and CFD Indices. Input Parameters Group Parameters Risk Management Fixed Lot Si
DYNAMIC SR TREND CHANNEL Dynamic SR Trend Channel is a simple indicator for trend detection as well as resistance/support levels on the current timeframe. It shows you areas where to expect possible change in trend direction and trend continuation. It works with any trading system (both price action and other trading system that use indicators) and is also very good for renko charting system as well. In an uptrend, the red line (main line) serves as the support and the blue line serves as the r
Zenith Trade Alerts Indie
Opengates Success International
Zenith Trade Alerts Custom Indicator is a simple amazing trading tool that is created to scan through the applied currency pairs to see if any of them has met profitable trading condition and give trade alerts accordingly. The trading conditions are simply about candle science that is a timeless strategy for profitable trading that will never go out of phase. If combined with good trading plans and good money managements. These are the features: 1. Multi-currency AND Multi-Time Frame Indicator
Xau Marti MT5
BILLY ARANDUQUE ABCEDE
Get the EA for FREE Just sign up and use my broker. Broker Link :  https://fbs.partners?ibl=684451&ibp=26113188 Setfile Here :  https://drive.google.com/file/d/1ZKvGf5KaUTZvrt2YE98a18sp7nzGUpVf/view?usp=sharing MT4 Version Here :  https://www.mql5.com/en/market/product/136465 XAU Marti The Smart Choice for Gold & Forex Traders -  Profit Potential! Why This EA Stands Out: RSI-POWERED ENTRIES   - Combines the reliability of RSI indicators with advanced money management for high-probabi
Gli utenti di questo prodotto hanno anche acquistato
Divergence Bomber
Ihor Otkydach
4.9 (87)
Ogni acquirente dell’indicatore riceverà inoltre gratuitamente: L’utilità esclusiva “Bomber Utility”, che gestisce automaticamente ogni operazione, imposta i livelli di Stop Loss e Take Profit e chiude le posizioni secondo le regole della strategia I file di configurazione (set file) per adattare l’indicatore a diversi asset I set file per configurare il Bomber Utility in tre modalità: “Rischio Minimo”, “Rischio Bilanciato” e “Strategia di Attesa” Una guida video passo-passo per installare, conf
Azimuth Pro
Ottaviano De Cicco
5 (7)
Azimuth Pro V2: Synthetic Fractal Structure and Confirmed Entries for MT5 Overview Azimuth Pro is a multi-level swing structure indicator by Merkava Labs . Four nested swing layers, swing-anchored VWAP, ABC pattern detection, three-timeframe structural filtering, and closed-bar confirmed entries — one chart, one workflow from micro-swings to macro-cycles. This is not a blind signal product. It is a structure-first workflow for traders who care about location, context, and timing. V2 Launch Offe
SignalTech MT5 is a trading system for EURUSD, USDCHF, USDJPY, AUDUSD, NZDUSD, EURJPY, AUDJPY, NZDJPY, CADJPY H2 and H3 Timeframe.  All the winning trades with chart setups are published on the comments page. 2025-12 1174 Pips 2026-01 2624 Pips 2026-02 2937 Pips 2026-03 2165 Pips 2026-04 2243 Pips It can generate signals with Buy/Sell Arrows and Pop-Up/Sound Alerts. Each signal has clear Entry and Stop Loss levels, which should be automatically flagged on the chart, as well as potential Targets
Quantum TrendPulse
Bogdan Ion Puscasu
5 (23)
Ecco   Quantum TrendPulse   , lo strumento di trading definitivo che combina la potenza di   SuperTrend   ,   RSI   e   Stocastico   in un unico indicatore completo per massimizzare il tuo potenziale di trading. Progettato per i trader che cercano precisione ed efficienza, questo indicatore ti aiuta a identificare con sicurezza le tendenze di mercato, i cambiamenti di momentum e i punti di entrata e uscita ottimali. Caratteristiche principali: Integrazione SuperTrend:   segui facilmente l'andame
Grabber System MT5
Ihor Otkydach
4.83 (23)
Ti presento un eccellente indicatore tecnico: Grabber, che funziona come una strategia di trading "tutto incluso", pronta all’uso. In un solo codice sono integrati strumenti potenti per l’analisi tecnica del mercato, segnali di trading (frecce), funzioni di allerta e notifiche push. Ogni acquirente di questo indicatore riceve anche gratuitamente: L’utility Grabber: per la gestione automatica degli ordini aperti Video tutorial passo dopo passo: per imparare a installare, configurare e utilizzare
Btmm state engine pro
Garry James Goodchild
5 (4)
BTMM State Engine Pro is a MetaTrader 5 indicator for traders who use the Beat The Market Maker approach: Asian session context, kill zone timing, level progression, peak formation detection, and a multi-pair scanner from a single chart. It combines cycle state logic with a built-in scanner dashboard so you do not need the same tool on many charts at once. What it does Draws the Asian session range; session times can follow broker server offset or be set in inputs. Tracks level progression (L
Presentazione       Quantum Breakout PRO   , l'innovativo indicatore MQL5 che sta trasformando il modo in cui scambi le zone di breakout! Sviluppato da un team di trader esperti con un'esperienza di trading di oltre 13 anni,       Quantum Breakout PRO       è progettato per spingere il tuo viaggio di trading a nuovi livelli con la sua strategia innovativa e dinamica della zona di breakout. Quantum Breakout Indicator ti fornirà frecce di segnalazione sulle zone di breakout con 5 zone target di
Meridian Pro
Ottaviano De Cicco
5 (1)
Meridian Pro 2.00: Professional Multi-Timeframe Trend Matrix for MT5 Meridian Pro 2.00 is a professional adaptive trend matrix for MetaTrader 5. It combines the original Meridian trend engine, a clean chart ribbon, closed-bar signal arrows, an 8-timeframe dashboard, Fuel momentum, weighted consensus, synthetic HTF processing and chart-native higher-timeframe context lines. The goal is simple: read current trend, multi-timeframe structure, strength, momentum and EA-ready state from one discipline
OmniSync Projection
Antonio-alin Teculescu
5 (1)
Chronos Fractal Engine is an innovative price projection indicator for MetaTrader 5, designed to transform your technical analysis by intelligently identifying and projecting historical price patterns. Built upon an advanced correlation algorithm and the fractal principles of the market, this powerful tool visualizes potential future price movements, giving you a unique edge in your trading decisions. What is Chronos Fractal Engine? At its core, the Chronos Fractal Engine employs a sophisticat
Innanzitutto, vale la pena sottolineare che questo Strumento di Trading è un Indicatore Non-Ridipingente, Non-Ridisegnante e Non-Laggante, il che lo rende ideale per il trading professionale. Corso online, manuale utente e demo. L'Indicatore Smart Price Action Concepts è uno strumento molto potente sia per i nuovi che per i trader esperti. Racchiude più di 20 utili indicatori in uno solo, combinando idee di trading avanzate come l'Analisi del Trader del Circolo Interno e le Strategie di Tradin
RelicusRoad Pro: Sistema Operativo Quantitativo di Mercato 70% DI SCONTO ACCESSO A VITA (TEMPO LIMITATO) - UNISCITI A 2.000+ TRADER Perché la maggior parte dei trader fallisce anche con indicatori "perfetti"? Perché operano su Singoli Concetti isolati. Un segnale senza contesto è una scommessa. Per vincere serve CONFLUENZA . RelicusRoad Pro non è un semplice indicatore. È un Ecosistema Quantitativo completo . Mappa la "Fair Value Road", distinguendo tra rumore e rotture strutturali. Smetti di in
KT Alpha Hunter Arrows MT5
KEENBASE SOFTWARE SOLUTIONS
La maggior parte degli indicatori a frecce ti dà un segnale e poi ti lascia capire da solo tutto il resto. KT Alpha Hunter Arrows ti offre un piano di trading completo. Ogni freccia di segnale appare con un piano completo già disegnato: linea di ingresso, stop loss, quattro livelli di take profit e un verdetto live sull’edge, che ti indica se quel simbolo e quel timeframe meritano davvero di essere tradati in quel momento. Il Trade Manager EA incluso gestisce l’esecuzione dopo il tuo ingresso, c
ARICoins
Temirlan Kdyrkhan
ARICoin is a powerful trading companion designed to generate high-probability entry signals with dynamic TP/SL/DP levels based on volatility. Built-in performance tracking shows win/loss stats, PP1/PP2 hits, and success rates all updated live. Key Features: Buy/Sell signals with adaptive volatility bands Real-time TP/SL/DP levels based on ATR Built-in MA Filter with optional ATR/StdDev volatility Performance stats panel (Success, Profit/Loss, PP1/PP2) Alerts via popup, sound, push, or email Cust
Current event:  https://c.mql5.com/1/326/A2SR2025_NoMusic.gif A2SR per MT5 Indicatore: Domanda e Offerta Effettive Automatizzate (S/R). + Strumenti di Trading. Product description in English here. --   Guidance   : -- at   https://www.mql5.com/en/blogs/post/734748/page4#comment_16532516 -- and  https://www.mql5.com/en/users/yohana/blog Potente, Autentico e Risparmio di Tempo per Decisioni di Trading più Intelligenti + Oggetti compatibili con EA. Vantaggi Principali Livelli di SR Effettivi
Gartley Hunter Multi
Siarhei Vashchylka
5 (11)
Gartley Hunter Multi - An indicator for searching for harmonic patterns simultaneously on dozens of trading instruments and on all possible timeframes. Manual (Be sure to read before purchasing) | Version for MT4 Advantages 1. Patterns: Gartley, Butterfly, Shark, Crab. Bat, Alternate Bat, Deep Crab, Cypher 2. Simultaneous search for patterns on dozens of trading instruments and on all possible timeframes 3. Search for patterns of all possible sizes. From the smallest to the largest 4. All fou
Top indicator for MT5   providing accurate signals to enter a trade without repainting! It can be applied to any financial assets:   forex, cryptocurrencies, metals, stocks, indices .  Watch  the video  (6:22) with an example of processing only one signal that paid off the indicator! MT4 version is here It will provide pretty accurate trading signals and tell you when it's best to open a trade and close it. Most traders improve their trading results during the first trading week with the help of
Trend Lines PRO MT5
Roman Podpora
5 (1)
LINEE DI TENDENZA PRO  Aiuta a capire dove il mercato sta realmente cambiando direzione. L'indicatore mostra reali inversioni di tendenza e punti in cui i principali operatori rientrano. Vedi   Linee BOS   Cambiamenti di tendenza e livelli chiave su timeframe più ampi, senza impostazioni complesse o rumore inutile. I segnali non vengono ridisegnati e rimangono sul grafico dopo la chiusura della barra. VERSIONE MT4   -   Svela il suo massimo potenziale se abbinato all'indicatore   RFI LEVELS PRO
Trend Forecaster
Alexey Minkov
5 (7)
Trend Forecaster – Since 2023. The Trend Forecaster indicator utilizes a unique proprietary algorithm to determine entry points for a breakout trading strategy. The indicator identifies price clusters, analyzes price movement near levels, and provides a signal when the price breaks through a level. The Trend Forecaster indicator is suitable for all financial assets, including currencies (Forex), metals, stocks, indices, and cryptocurrencies. You can also adjust the indicator to work on any time
Bill Williams Advanced
Siarhei Vashchylka
5 (11)
Bill Williams Advanced is designed for automatic chart analysis using Bill Williams' "Profitunity" system. The indicator analyzes four timeframes at once. Manual (Be sure to read before purchasing) Advantages 1. Analyzes the chart using Bill Williams' "Profitunity" system. Signals are displayed in a table in the corner of the screen and on the price chart. 2. Finds all known AO and AC signals, as well as zone signals. Equipped with a trend filter based on the Alligator. 3. Finds "Divergence Bar
Meravith MT5
Ivan Stefanov
5 (1)
Strumento per market maker. Meravith: Analizzerà tutti i timeframe e mostrerà il trend attualmente in corso. Evidenzierà le zone di liquidità (equilibrio dei volumi) dove i volumi rialzisti e ribassisti sono uguali. Mostrerà tutti i livelli di liquidità dei diversi timeframe direttamente sul grafico. Genererà e presenterà un’analisi di mercato testuale a scopo di riferimento. Calcolerà obiettivi, livelli di supporto e punti di stop-loss in base al trend attuale. Calcolerà il rapporto rischio/ren
Fusion Monthly Levels + PinBar + Marubozu Descrizione Questo indicatore unico combina tre potenti strumenti di analisi tecnica in uno solo: Livelli mensili (High, Low, Open, Close) – per identificare zone chiave di supporto e resistenza. Rilevamento PinBar – pattern di candela affidabile che segnala rifiuti di prezzo. Rilevamento Marubozu – candele di forte tendenza che indicano momentum direzionale. Grazie a questa fusione, ottieni uno strumento visivo, completo e reattivo per anticipare
Berma Bands
Muhammad Elbermawi
5 (8)
L'indicatore Berma Bands (BBs) è uno strumento prezioso per i trader che cercano di identificare e capitalizzare i trend di mercato. Analizzando la relazione tra il prezzo e le BBs, i trader possono discernere se un mercato è in una fase di trend o di range. Visita il [ Berma Home Blog ] per saperne di più. Le Berma Bands sono composte da tre linee distinte: la Upper Berma Band, la Middle Berma Band e la Lower Berma Band. Queste linee sono tracciate attorno al prezzo, creando una rappresentazion
Precision Spike Detector
Francisco Mandomo Simbine
5 (1)
Precision Spike Detector V3 – Institutional-Grade AI Trading System Attention: The price increases by US$50 for every 10 purchases.  Final price: US$599 Precision Spike Detector V3   is a   state-of-the-art, institutional-grade market analysis system   for   MetaTrader 5 , designed to detect   high-probability market movements   in synthetic indices such as   Boom, Crash, GainX, and PainX . After purchase, please contact me through the MQL5 messaging system to receive the order management tool
Weltrade Spike Sentinel
Batsirayi L Marango
5 (1)
Introducing Indicator for PainX and GainX Indices Traders on Weltrade Get ready to experience the power of trading with our indicator, specifically designed for Weltrade   broker's PainX and GainX Indices.  Advanced Strategies for Unbeatable Insights Our indicator employs sophisticated strategies to analyze market trends, pinpointing optimal entry and exit points.  Optimized for Maximum Performance To ensure optimal results, our indicator is carefully calibrated for 5-minute timeframe charts on
Owl Smart Levels MT5
Sergey Ermolov
4.03 (32)
Quando si opera seguendo il trend, la difficoltà principale non è trovare un livello, ma capire dove un ingresso è realmente valido. Il prezzo spesso reagisce ai livelli, ma non riesce a proseguire il movimento — il che porta a ingressi falsi o opportunità perse. Owl Smart Levels non si limita a mostrare livelli , ma evidenzia zone basate sulla struttura di mercato e sui pullback. Questo consente di valutare i punti di ingresso in modo diverso ed evitare una parte dei segnali falsi. Cosa includ
CRT Multi-Timeframe Market Structure & Liquidity Sweep Indicator Non-Repainting | Multi-Asset | MT4 Version Available MT4 Version: https://www.mql5.com/en/market/product/162556 Full Setup Guide: https://www.mql5.com/en/blogs/post/767525 Indicator Overview CRT Ghost Candle HTF Fractal is a complete institutional-grade market structure toolkit for MetaTrader 5. It projects higher-timeframe candle structure, CRT trap levels, session levels, previous period highs and lows, pivot points, and a real
CGE Trading Suite
Carl Gustav Johan Ekstrom
5 (2)
Institutional-Grade Analytics for MT5 C GE Trading Suite delivers the analytical edge typically reserved for professional trading desks. The platform integrates a full suite of analytical tools into one seamless workflow: dynamic grid mapping, liquidity behavior analysis, ECM, trend lines, MIDAS, trade cycles, and directional channel projections. Together, these provide a unified view of market structure and momentum. Directional clarity is further enhanced by the capital flow index, which meas
AriX
Temirlan Kdyrkhan
1 (4)
AriX Indicator for MT5 A powerful trend-following and signal-evaluation tool AriX is a custom MT5 indicator that combines Moving Averages and ATR-based risk/reward logic to generate clear buy/sell signals. It visualizes dynamic SL/TP levels, evaluates past trade outcomes, and displays win/loss statistics in a clean on-chart panel. Key features include: Buy/Sell signals based on MA crossovers ATR-based SL/TP1/TP2/TP3 levels with visual lines and labels Signal outcome tracking with real-time stat
Advanced Supply Demand MT5
Bernhard Schweigert
4.53 (15)
La migliore soluzione per qualsiasi principiante o trader esperto! Questo indicatore è uno strumento di trading unico, di alta qualità e conveniente perché abbiamo incorporato una serie di funzionalità proprietarie e una nuova formula. Con questo aggiornamento, sarai in grado di mostrare fusi orari doppi. Non solo potrai mostrare una TF più alta, ma anche entrambe, la TF del grafico, PIÙ la TF più alta: SHOWING NESTED ZONES. Tutti i trader di domanda di offerta lo adoreranno. :) Informazioni imp
TPA True Price Action indicator reveals the true price action of the market makers through 100% non-repainting signals strictly at the close of a candle! TPA shows entries and re-entries, every time the bulls are definitely stronger than the bears and vice versa. Not to confuse with red/green candles. The shift of power gets confirmed at the earliest stage and is ONE exit strategy of several. There are available now two free parts of the TPA User Guide for our customers. The first "The Basics"
Altri dall’autore
Keltner Enhanced
David Ben Svaiter
Keltner-Enhanced migliora l'accuratezza e la leggibilità dei canali Keltner con molte opzioni di regolazione e cinque calcoli di prezzo in più rispetto al META predefinito. L'indicatore Keltner-E è un indicatore a bande simile alle Bande di Bollinger e agli Inviluppi delle medie mobili. Consiste in un inviluppo superiore al di sopra di una linea mediana e in un inviluppo inferiore al di sotto della linea mediana.  I principali eventi a cui prestare attenzione quando si utilizzano i canali Kel
FREE
Quante volte avete cercato un PIVOT che funzionasse su una candela specifica ogni giorno? Molti trader amano stimare la direzione del trend del giorno in base a un momento specifico, come 30 minuti dopo l'apertura del mercato, o alle 12.00, e così via. Questo indicatore consente di specificare un determinato orario (ora e minuti) e traccia un pivot da quell'ora al giorno successivo alla stessa ora. Mostra cinque linee basate su quella specifica candela/ora: mediana, massimo, minimo, supporto
FREE
Il Jurik Advanced MA (JurMA) è un indicatore tecnico non grafico sviluppato sulla base del JMA originale ideato da Mark Jurik.  È stato progettato per ridurre il ritardo presente nelle medie mobili tradizionali, migliorare la scorrevolezza e ridurre il rumore. JurMA si adatta alla volatilità del mercato e può essere regolato dall'utente per quanto riguarda la sensibilità, rendendolo utile per identificare tendenze e inversioni nei mercati finanziari. Questa adattabilità ed efficienza lo rendono
Trend On Close
David Ben Svaiter
TrendOnClose è un sofisticato indicatore progettato per gli investitori del mercato binario, incentrato sull'analisi statistica delle tendenze e delle controtendenze all'interno di specifici cicli di candele. Ogni ciclo è definito dal prezzo di chiusura della candela, che stabilisce la direzione della tendenza (SU/GIU' - TORO/BORSO) per le successive analisi statistiche fino all'inizio del ciclo successivo. L'analisi statistica opera con due configurazioni: ⦁ Obiettivo statistico come CANDELA
HAshi-E è un modo migliorato di analizzare i segnali Heiken-Ashi. Briefing: L'Heiken-Ashi è particolarmente apprezzato per la sua capacità di filtrare la volatilità a breve termine, che lo rende uno strumento privilegiato per identificare e seguire le tendenze, aiuta a prendere decisioni sui punti di entrata e di uscita e aiuta a distinguere tra falsi segnali e vere inversioni di tendenza. A differenza dei tradizionali grafici a candele, le candele Heiken-Ashi sono calcolate utilizzando i val
Designed by Welles Wilder for daily commodity charts, the ADXW is now used in various markets by technical traders to assess the strength of a trend or even a trend for short- or long-term trades. The ADXW uses a positive (DI+) and negative (DI-) directional indicator in addition to its trend line (ADX). According to Wilder, a trend has strength when the ADX signal is above 25; the trend is weak (or the price has no trend) when the ADX is below 20. The absence of a trend does not mean that th
L'On-Balance Volume (OBV) è un indicatore tecnico che mette in relazione volume e prezzo per identificare i movimenti di prezzo. L'idea di base dell'OBV è che le variazioni di volume generalmente precedono le variazioni di prezzo. L'indicatore accumula i volumi per i periodi in cui il prezzo chiude in rialzo e sottrae i volumi per i periodi in cui il prezzo chiude in ribasso. Il risultato è un valore utilizzato per identificare la direzione del trend dell'asset. L'interpretazione dell'OBV è se
In the realm of technical analysis, ParbMA emerges as a highly intuitive tool for examining the Parabolic SAR trend . This innovative approach leverages a customizable line, distinguished by its versatility in color, shape, and width options. Such flexibility enhances visual analysis and significantly aids in strategizing and decision-making. The ParbMA (Parabolic Moving Average) is a custom technical indicator that combines the concepts of J. Welles Wilder's Parabolic SAR (Stop and Reverse) a
Slow AMA
David Ben Svaiter
Compared to simple or exponential moving averages, slow adaptive trend lines might offer a more nuanced view of the trend by adjusting their sensitivity based on market conditions. However, their slow nature might also mean they are late in signaling reversals when market conditions change rapidly - and that is the difference between them and our SlowAMA . SlowAMA was designed to be a better long-term trend indicator than EMA and other Moving Averages. It uses our JurMA calculations, reducing
HAshi-E è un modo migliorato di analizzare i segnali Heiken-Ashi. Briefing: L'Heiken-Ashi è particolarmente apprezzato per la sua capacità di filtrare la volatilità a breve termine, che lo rende uno strumento privilegiato per identificare e seguire le tendenze, aiuta a prendere decisioni sui punti di entrata e di uscita e aiuta a distinguere tra falsi segnali e vere inversioni di tendenza. A differenza dei tradizionali grafici a candele, le candele Heiken-Ashi sono calcolate utilizzando i val
Quante volte avete cercato un PIVOT che funzionasse ogni giorno su uno specifico timeframe? Molti trader amano stimare la direzione del trend del giorno in base a uno specifico intervallo di tempo giornaliero, ad esempio da 2 ore prima dell'apertura del NYSE a 1 ora dopo, oppure dall'apertura del NYSE a 30 minuti dopo. Questo indicatore consente di specificare un determinato intervallo di tempo (ora e minuto) e traccia un pivot da quell'intervallo al giorno successivo nello stesso intervallo
Filtro:
Nessuna recensione
Rispondi alla recensione