ParbMA The Most Intuitive Parabolic SAR
- Göstergeler
- Sürüm: 1.5
- Etkinleştirmeler: 5

In the realm of technical analysis, ParbMA emerges as a highly intuitive tool for examining the Parabolic SAR trend. This innovative approach leverages a customizable line, distinguished by its versatility in color, shape, and width options. Such flexibility enhances visual analysis and significantly aids in strategizing and decision-making.
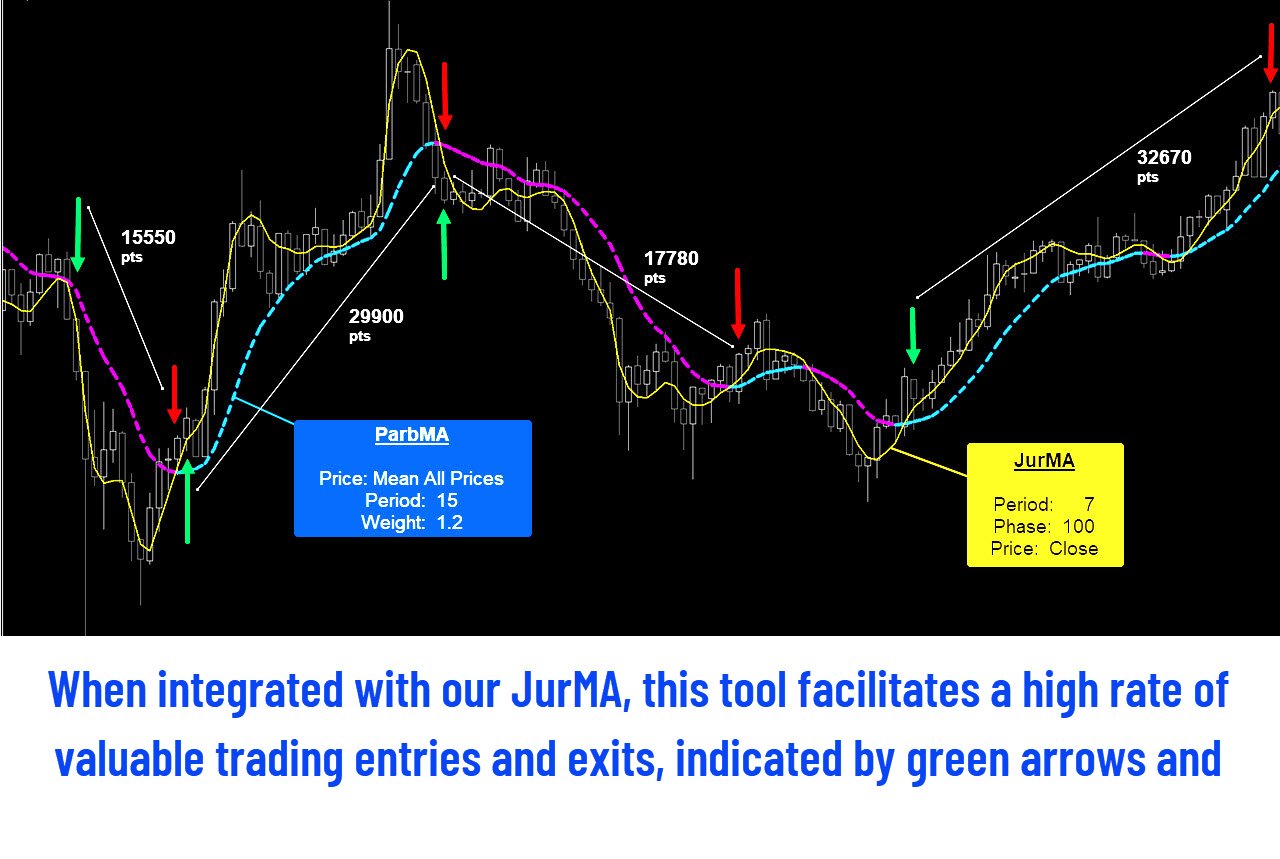
The ParbMA (Parabolic Moving Average) is a custom technical indicator that combines the concepts of J. Welles Wilder's Parabolic SAR (Stop and Reverse) and a Moving Average. This hybrid indicator is designed to provide traders with a tool that captures the benefits of both these methodologies, offering a unique way to track price trends and potential reversal points in financial markets.
Key Features of ParbMA
Customizable Visual Representation: At the core of ParbMA is its ability to represent trends through a line. Users can tailor this line according to their preferences, choosing from a variety of colors, shapes, and widths. This level of customization ensures that the trend representation aligns perfectly with the user's analytical style and requirements.
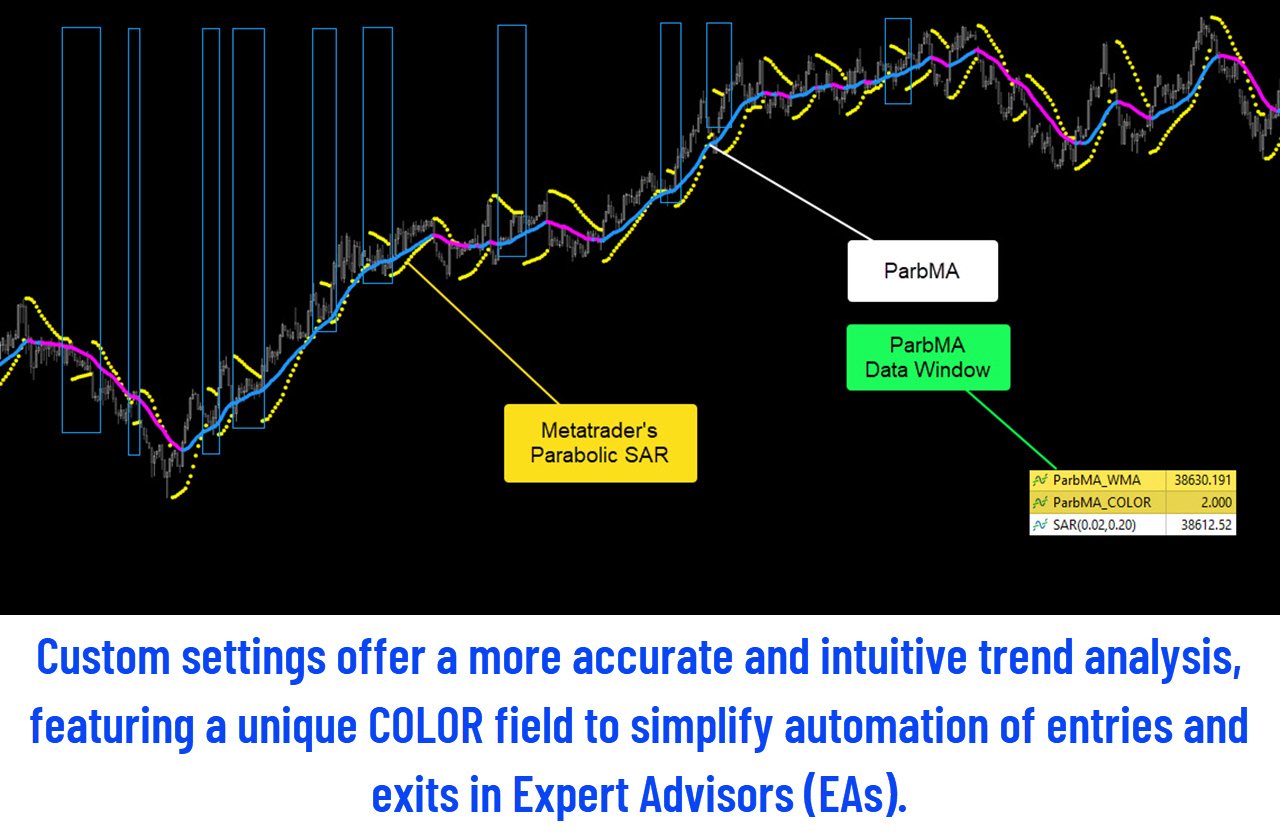
Easy Integration with Expert Advisors (EAs), ParbMA's utility extends into the domain of Expert Advisors, offering a distinct advantage for automated trading strategies supported by Parabolic SAR: the inclusion of a "color field" that simplifies the implementation of a strategy that hinges on-trend color changes. By providing an easy-to-interpret color-coded system, ParbMA allows programmers to identify shifts in trends and adjust their strategy accordingly quickly. This seamless and efficient integration enhances EAs' capabilities in trend analysis.
ParbMA stands out as a comprehensive and user-friendly tool for analyzing the Parabolic SAR trend. Its combination of customizable visual elements and the innovative color field feature makes it an invaluable asset for both manual traders and those utilizing Expert Advisors. By simplifying and enhancing the process of trend analysis, ParbMA paves the way for more efficient and effective trading strategies.
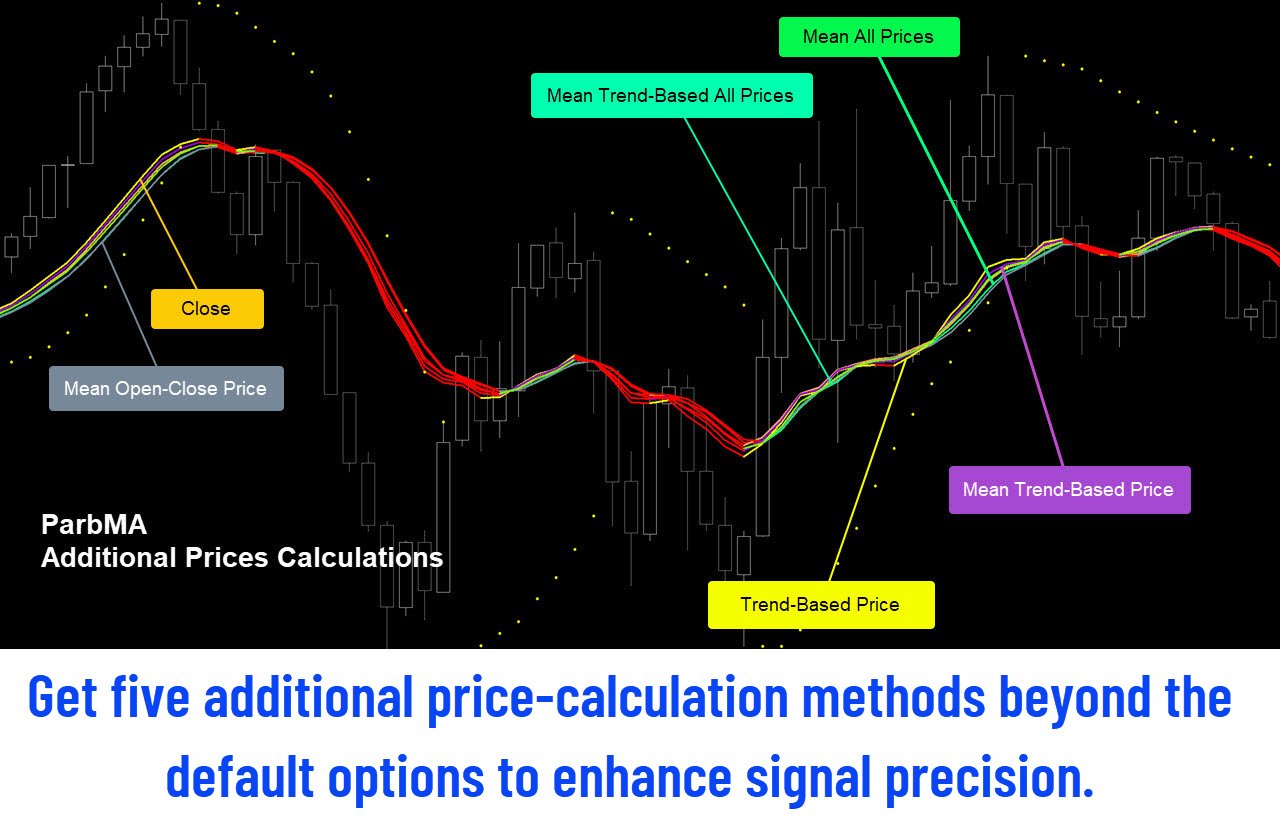
Additionally, ParbMA provides a diverse range of pricing options for computations that augment the standard price calculations inherent in the MetaTrader platform:
- Metatrader default (Close, Open, High, Low, Median, Typical, Weighted Prices);
- Mean Open-Close;
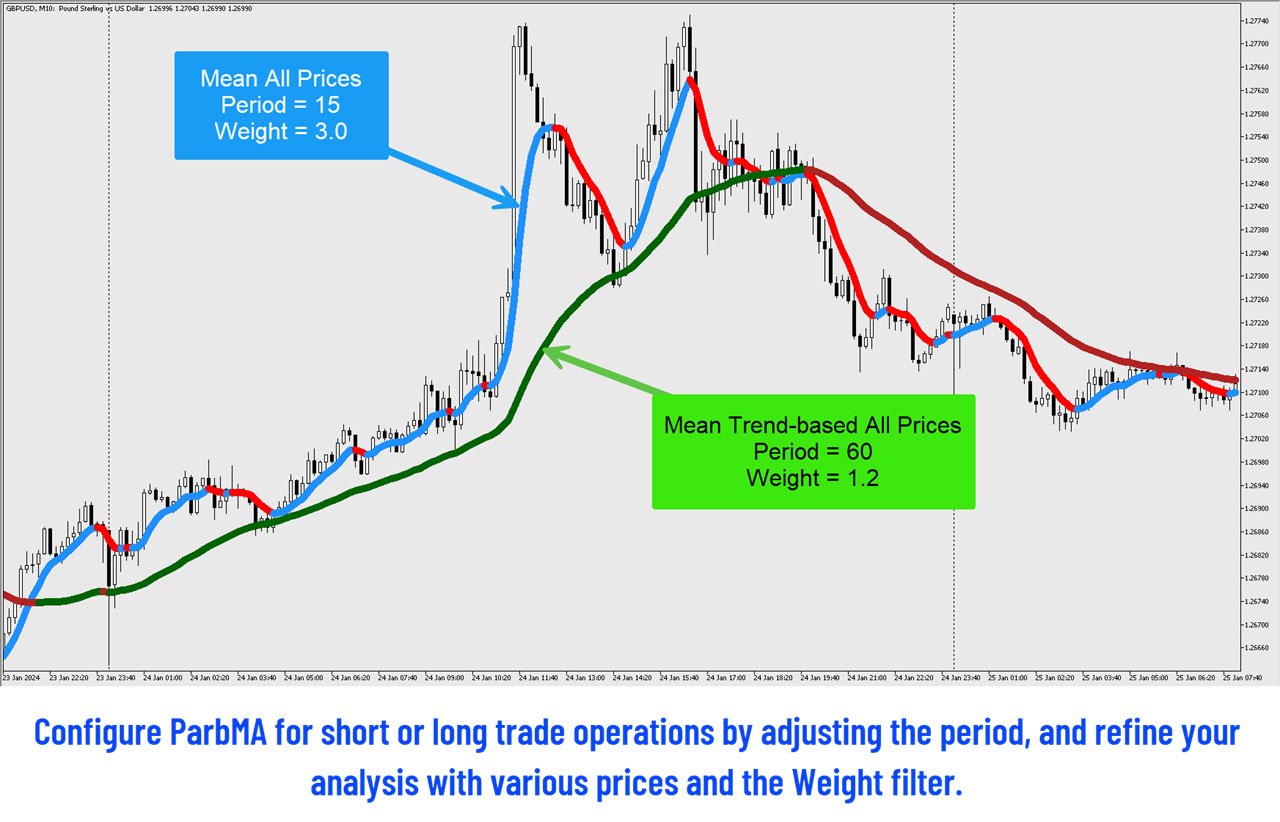
- Mean All Prices;
- Trend-Based (High for Bull candle, Low for Bear candle, Close otherwise);
- Trend-Based Mean;
- Mean Trend-Based All Prices Weighted.
Features
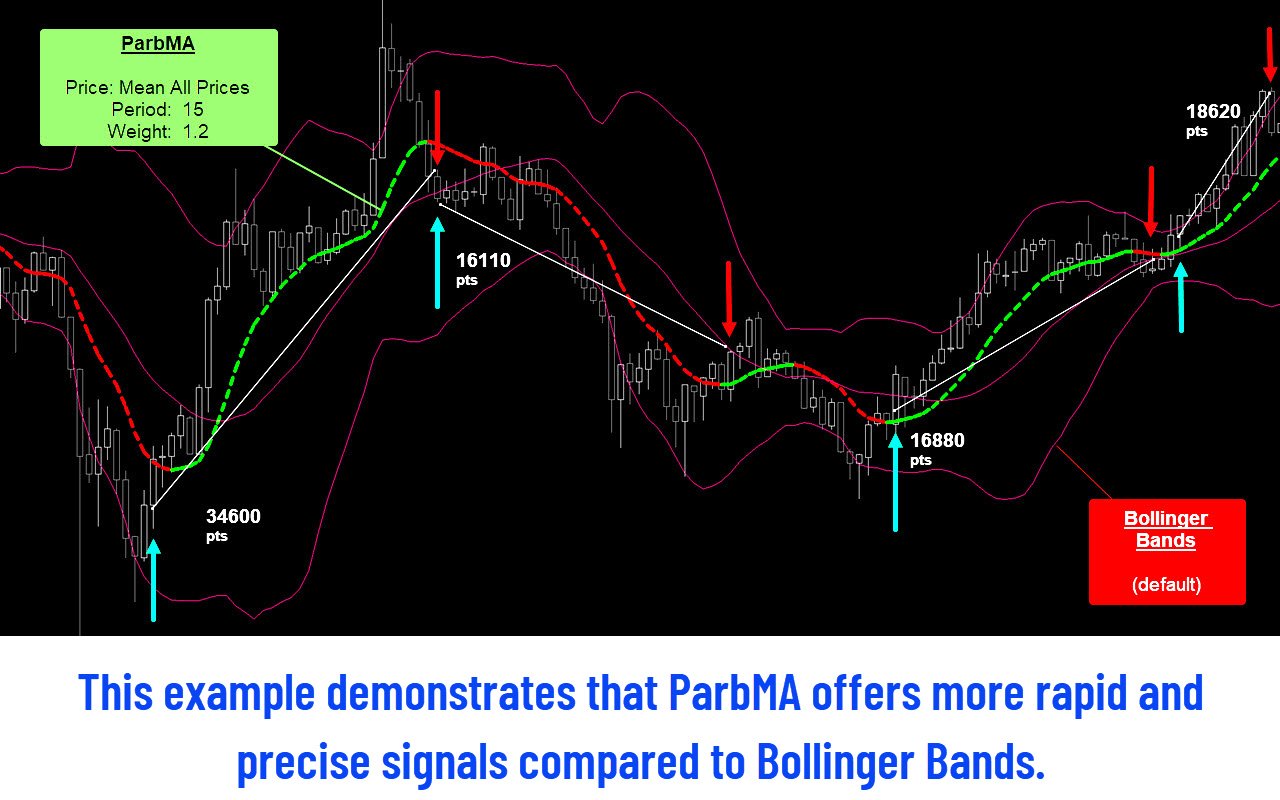
- Non-Repaint Line-based Parabolic-SAR indicator, optimizing the identification of stops and reverse in trends.
- Exclusive MA approach to enhance the Parabolic-SAR for short and long-term trades.
- Exclusive 2-color line for easier and faster visualization of the Parabolic-SAR.
- Exclusive COLOR data field for using in EA, making easier to adapt legacy strategies to a faster operation.
- PERIOD and WEIGHT parameters for total customization for any Asset and timeframe.
- Faster average calculation than iMA() and other Metatrader's Technical Indicators.
- 12 different price calculations (7 Metatrader Default + 5 custom calculations).
- Allows you free changing the style, color, and width of its line.
- It can be used with any ASSET and TIMEFRAME.
- Accepts its incorporation into "Expert-Advisor" via iCUSTOM call.