VIDYA Enhanced

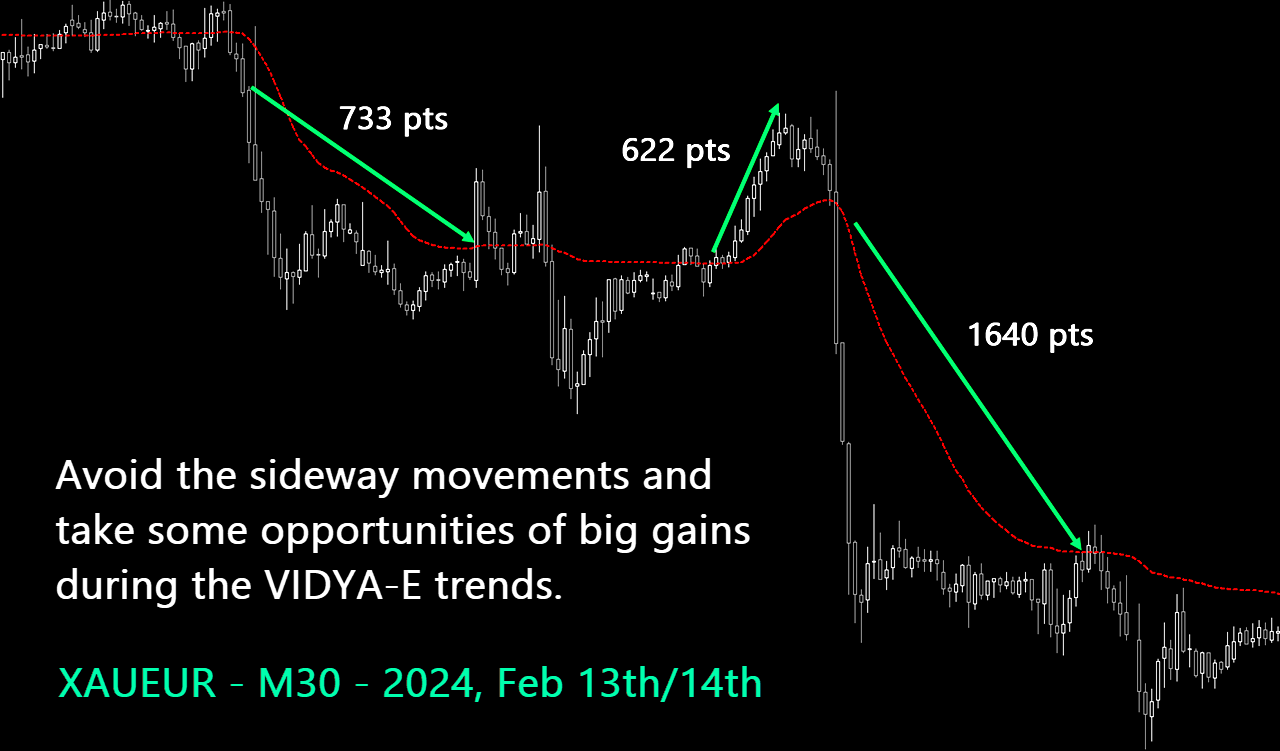
The VIDYA-ENHANCED indicator (Variable Index Dynamic Average) is a technical analysis tool used to identify trends and sideways movements.

It dynamically adjusts its sensitivity based on market volatility, using the Chande Momentum Oscillator as a volatility index. This feature allows VIDYA-ENHANCED to be more agile during periods of significant price movements, while remaining more stable during less volatile phases. 

Features:

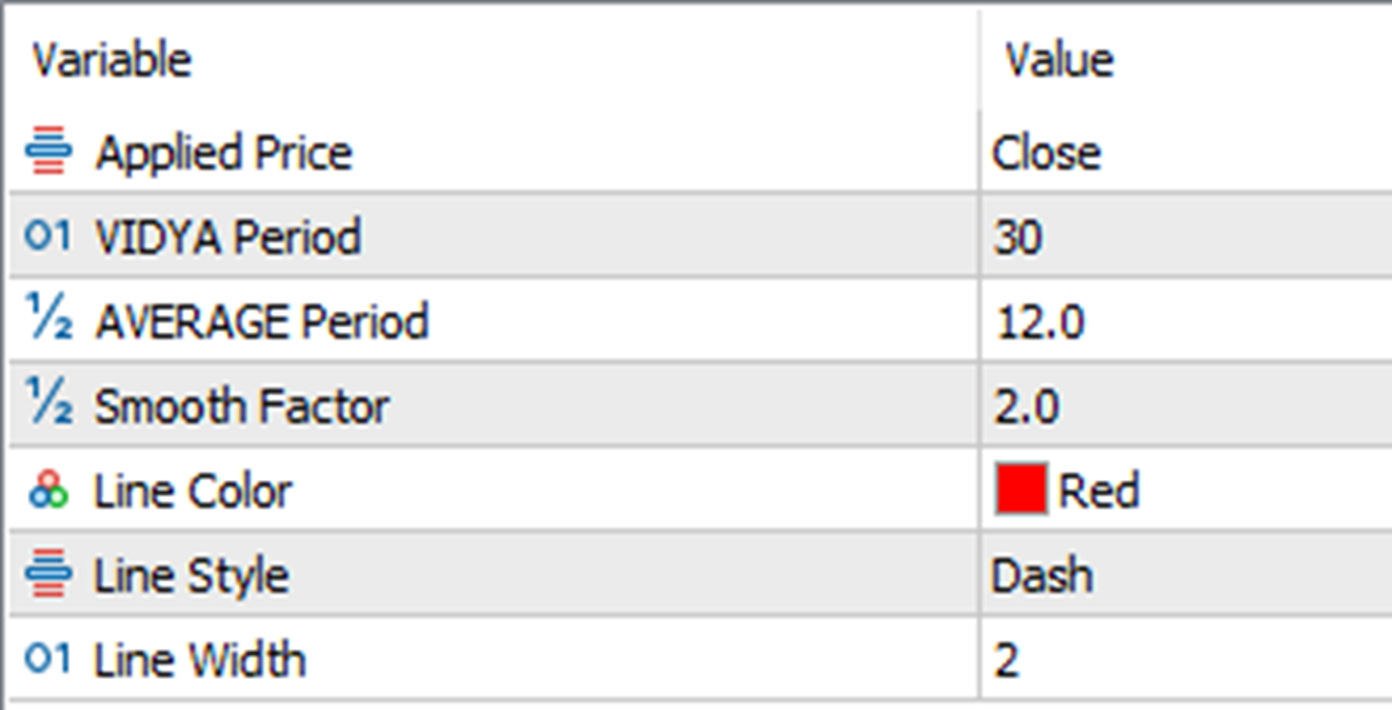
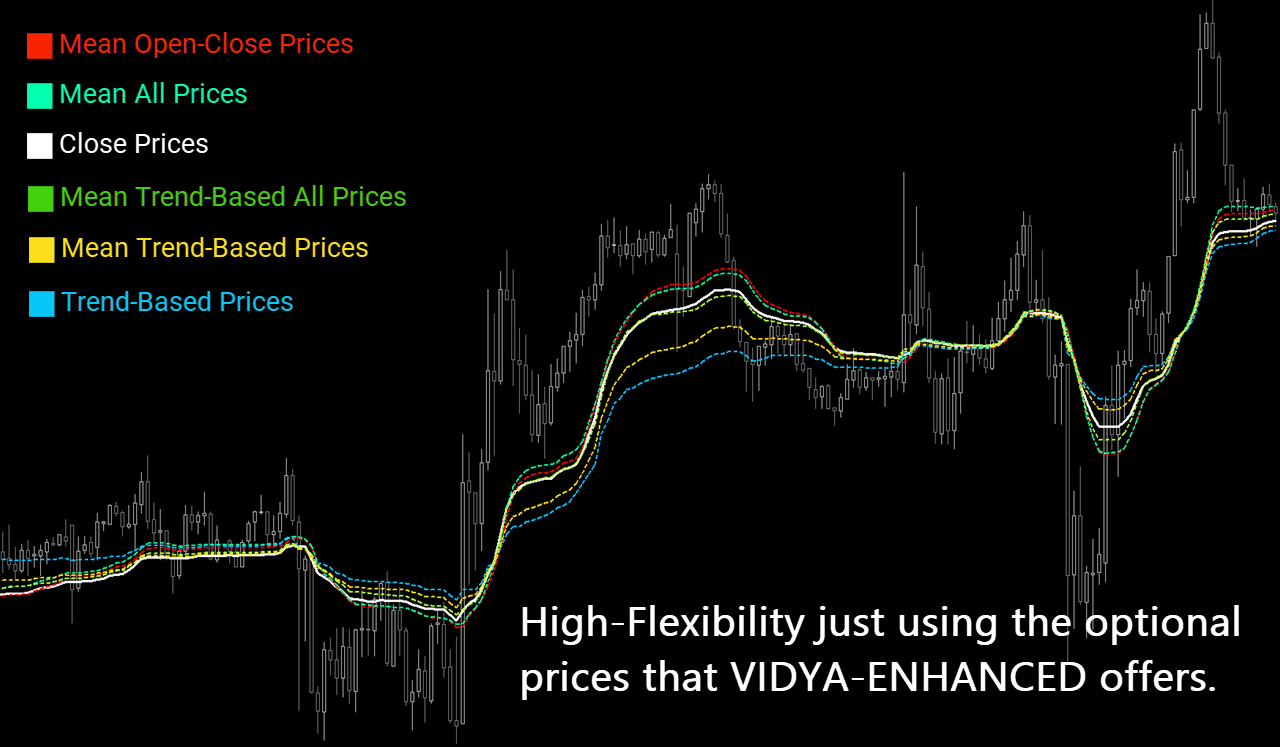
- Select the price from 12 options - 5 more than the Metatrader standard!
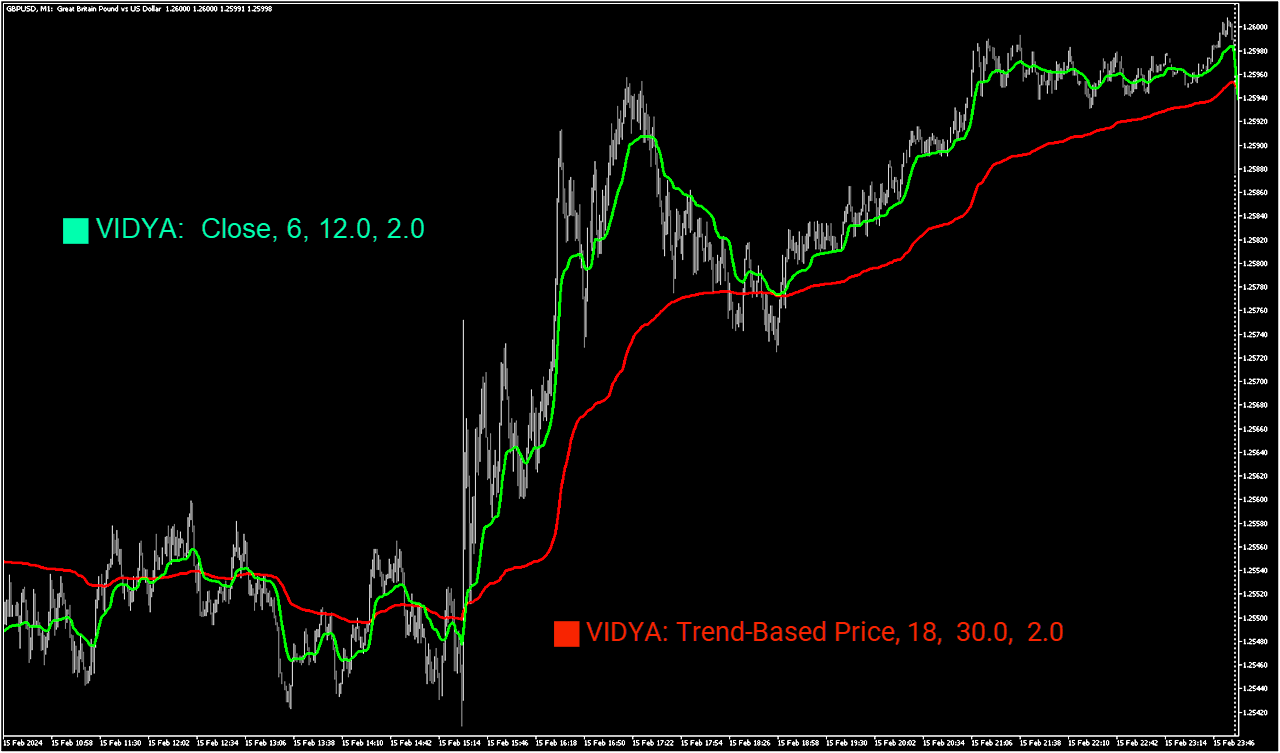
- Select the VIDYA and EMA periods.
- Change the color, type and width of the VIDYA line.
추천 제품
I recommend you to read the  product's blog  (manual) from start to end so that it is clear from the beginning what the indicator offers. This multi time frame and multi symbol supply and demand zone dashboard indicator sends alerts when the price has reached a supply/demand zone. It is also possible to use it to be alerted about regular double tops/bottoms instead of zones. It can be used with all time frames from M1 to MN. Maximum 9 time frames can be shown in the dashboard at the same time. 
If you are unsure how to use this indicator, please feel free to reach out to me. I will explain it to you and provide reading materials to help you make the most of it. TD Sequential Scanner: An Overview The TD Sequential scanner is a powerful technical analysis tool designed to identify potential price exhaustion points and trend reversals in financial markets. Developed by Tom DeMark, this method is widely used by traders to gauge market cycles and potential turning points with precision. Ho
Bid Price Timer Indicator — 정밀한 타이밍과 스마트한 가격 추적! Bid Price Timer Indicator 는 시간, 정확도, 명확성 을 중요시하는 트레이더를 위해 설계된 강력한 도구입니다. 주요 기능: 고정 타이머 표시 – 타이머는 항상 차트의 오른쪽 에 표시되며, X_Offset 으로 위치를 조정할 수 있습니다. 실시간 가격 추적 – 타이머는 매수 호가 (Bid 가격) 에 따라 위아래로 부드럽게 이동 합니다. 자동 위치 조정 – 가격이 변경되면 타이머가 자동으로 새로운 가격 수준에 맞게 이동 합니다. 선택 가능한 수평선 표시 – 정확한 Bid 가격 수준 을 시각적으로 보여줍니다. ️ 1초 단위 실시간 업데이트 – 타이머는 매초 갱신되며 , 다음 캔들까지의 카운트다운 을 실시간으로 보여줍니다. 트레이더들이 좋아하는 이유: 정확한 캔들 마감 타이밍 을 예측할 수 있습니다 차트를 깔끔하고 현대적이며 직관적 으로
이 지표는 실제 거래에 완벽한 자동 파동 분석 지표입니다! 사례... 참고:   웨이브 그레이딩에 서양식 이름을 사용하는 데 익숙하지 않습니다. Tang Lun(Tang Zhong Shuo Zen)의 명명 규칙의 영향으로 기본 웨이브를   펜   으로 명명하고 2차 웨이브 밴드를   세그먼트   로 명명했습니다. 동시에, 세그먼트에는 추세 방향이 있습니다.   주요 추세 세그먼트에는   이름이 지정되지만(이 이름 지정 방법은 향후 노트에서 사용됩니다. 먼저 말씀드리겠습니다.) 알고리즘은 굴곡 이론과 거의 관련이 없으므로 그렇게 해서는 안 됩니다. 이는 나의 시장 분석을   통해 요약된 끊임없이 변화하고 복잡한 운영 규칙을   반영합니다. 밴드는 더 이상 사람마다 다르지 않도록 표준화되고 정의되었습니다. 인위적인 간섭의 드로잉 방법은 시장 진입을 엄격하게 분석하는 데 핵심적인 역할을 합니다. 이 지표를 사용하는 것은 거래 인터페이스의 미학을 개선하고 원래의 K-line 거래를
RSIScalperPro
PATRICK WENNING
RSIScalperPro를 소개합니다 - 메타트레이더 5용 RSI 기반의 혁신적인 인디케이터로, 1분 차트에서의 스캘핑에 최적화되어 있습니다! RSIScalperPro를 사용하면 정확한 진입 및 청산 신호를 제공하는 강력한 도구를 손에 넣을 수 있습니다. RSIScalperPro는 서로 다른 두 가지 RSI 지표를 사용하여 과매수 및 과매도 레벨에 대한 명확한 신호를 제공합니다. 2개의 RSI의 시간 프레임 및 제한 값을 원하는 대로 조정하여 트레이딩 전략에 최적화된 결과를 얻을 수 있습니다. 차트 상의 개별 화살표는 거래 진입 및 청산 타이밍을 쉽게 파악하는 데 도움이 됩니다. 또한 RSIScalperPro의 특징 중 하나는 사용자 정의 가능한 3개의 이동 평균선입니다. 이를 통해 트렌드의 방향을 판단하고 강력한 거래 신호를 확인하는 데 도움이 됩니다. 이를 통해 조기에 트렌드를 감지하고 수익성 높은 거래에 참여할 수 있습니다. 뿐만 아니라 RSIScalperPro는 새로운 거래
Optimized Spike Detector Pro for MT5 is a professional-grade technical indicator designed to identify and capitalize on sharp, impulsive price movements (spikes) in any financial instrument. Utilizing a sophisticated, multi-algorithmic core, it distinguishes significant volatility expansions from market noise with exceptional accuracy. The tool dynamically adapts to changing market conditions, filtering out false signals and highlighting only high-probability spike setups in real-time. Featuring
Brilliant Reversals MultiCurrency Scanner MT5는 여러 통화 쌍에서 잠재적인 반전 포인트를 식별하려는 트레이더를 위해 설계된 최첨단 거래 지표입니다. 고급 알고리즘을 활용하여 이 도구는 즉각적인 통찰력을 제공하며, 거래 전략을 최적화하려는 초보자와 경험자 모두에게 귀중한 도구입니다. 이 지표는 시장 상황에 따라 실시간 매수 및 매도 신호를 제공하여 트레이더의 결정을 지원하고 거래 성과를 향상시킵니다. 포괄적인 대시보드와 알림 기능을 통해 주요 통화 쌍을 쉽게 모니터링하고 시장 기회에 신속하게 대응할 수 있습니다. MQL 제품 설치 가이드 | 구매한 MQL 제품 업데이트 MT4/MT5 | 일반 문제 해결 가이드 | 지표 설정 / 가이드 주요 기능 버퍼 통합: 신호 기반 거래를 효과적으로 활용할 수 있도록 지표 값을 접근 가능한 버퍼로 노출합니다. 시각적 화살표 신호: 차트에 직접 매수/매도 화살표를 명확하게 표시하여 거래 기회를 쉽게 포착할 수 있습니
Market session with fibonacci
Batsukh Sumchin Khuyagbaatar
이 지표는 우리가 매일 사용하는 가장 일반적인 지표로, 가장 많이 사용하는 전략인 ICT와 SMC, 거래소 개장 및 폐장 시간에 발생하는 손절매 한도와 유동성 한도, 피보나치와 확대 및 축소를 통한 거래소 거래량, 보고 싶은 거래소 움직임을 선택하고 피보나치를 당기는 등 가장 일반적으로 보고 싶은 행동을 완전 자동으로 보여주는 지표입니다. 이 지표를 사용하여 모든 유형의 거래를 분석하는 법을 배우면 다시는 이 지표 없이 일할 수 없을 거라고 100% 확신합니다. 이 지표는 우리가 매일 사용하는 가장 일반적인 지표로, 가장 많이 사용하는 전략인 ICT와 SMC, 거래소 개장 및 폐장 시간에 발생하는 손절매 한도와 유동성 한도, 피보나치와 확대 및 축소를 통한 거래소 거래량, 보고 싶은 거래소 움직임을 선택하고 피보나치를 당기는 등 가장 일반적으로 보고 싶은 행동을 완전 자동으로 보여주는 지표입니다. 이 지표를 사용하여 모든 유형의 거래를 분석하는 법을 배우면 다시는 이 지표 없이 일할
Trendline Breakout EA
Paballo Justice Tsoako
TB EA  – Trendline Breakout Expert Advisor Overview TB EA 1.0 is a professional-grade automated trading system that detects and executes trades based on trendline breakouts using a "body break" confirmation methodology. The EA intelligently distinguishes between support and resistance trendlines, executing BUY orders on resistance breakouts and SELL orders on support breakouts. It works seamlessly on Forex pairs and CFD Indices. Input Parameters Group Parameters Risk Management Fixed Lot Si
ATTENTION!!!Get this product at a discounted price NOW!!! Description of the Directional Strength Index mt5 I present to you this awesome indicator that concludes the trading armor of a trader seeking for a strong affirmative and insightful entries and exits confluences.The core idea that runs behind the indicator is generated from the famous children game " TUG OF WAR ".The market is depicted as being influenced by two forces :  buying and selling force. The indicator's work is to determine wh
ROC acceleration-deceleration is the manual system for medium-term scalping. Indicator based on custom ROC system which defines bullish/bearish market and especially  acceleration-deceleration of tendention in the market's main direction. Buy arrow is plotted during bearish market when current trend decelerates and sell  arrow is plotted during bullish market when current trend decelerates. Main Indicator's Features Signals are not repaint,non-late or disappear(exept cases when system recalculat
VLTL High Frequency Trader PRO
Jamal Mohammed Shlhadah Tarkhan
ON MARKETPLACE FOR ONE MONTH ONLY!! EVERY DAY YOU MISS IS ONE LESS DAY OF PROFIT. VLTL High Frequency Trader PRO VLTL High Frequency Trader PRO is an HFT bot designed for exceptionally high returns. It is built around trading volatile times on XAUUSD (Gold) using tick-based strategies that dominate the market. This bot is the first in the VLTL lineup, with even better and more advanced EAs coming in the future. The EA includes three built-in strategies , each tailored for a different purpose: La
Turpial Pullback
Arlos Elias Rivas Romero
Indicator Type Strategy (Pullback) for all Symbols and Periodicity, Preferably from 30M periodicity. Can be used for manual trading. Its workspace corresponds to channel of 3 bars of Bill Willians. Also relies on the indicator Rsi and Atr. BUY when: There is a Green Arrow STOPLOSS to buy, below the bottom line of the channel (red line)" SELL when: There is a Red Arrow. STOPLOSS to sell, above the upper line of the channel (blue line)
Smart Money Structure & Precision Trading Indicator (MT5) Smart Money Structure & Precision Trading Indicator  is a powerful Smart Money Concepts (SMC) indicator for MetaTrader 5, designed to help traders identify high-probability entries with institutional logic . This indicator automatically detects market structure in real time , highlights key liquidity levels , and provides clear, non-repainting signals so you can trade with confidence and precision. Whether you are a scalper, day trader, o
Linear Trend Predictor - 진입 지점과 방향성 지원선을 결합한 추세 지표입니다. 고가/저가 채널을 돌파하는 원칙에 따라 작동합니다. 지표 알고리즘은 시장 노이즈를 걸러내고 변동성과 시장 역학을 고려합니다. 표시기 기능  평활화 방법을 사용하여 시장 추세와 BUY 또는 SELL 주문을 시작하기 위한 진입 시점을 보여줍니다.  모든 기간의 차트를 분석하여 단기 및 장기 시장 움직임을 파악하는 데 적합합니다.  어떠한 시장과 시간대에도 적용할 수 있으며, 입력 매개변수를 통해 거래자는 자신에게 맞게 지표를 독립적으로 사용자 지정할 수 있습니다.  설정된 지표 신호는 사라지거나 다시 그려지지 않습니다. 이는 캔들 마감 시 결정됩니다.  여러 유형의 알림이 화살표와 결합되어 있습니다.  이 지표는 독립적인 거래 시스템으로 사용할 수도 있고, 다른 거래 시스템에 추가하는 용도로도 사용할 수 있습니다.  모든 수준의 경험을 가진 거래자가 사용할 수 있습니다. 주요 매
IS PRO Estructura Institucional
Medina Cortez Edison Armando
INSTITUTIONAL STRUCTURE PRO Market Structure + Swings + Fair Value Gaps with SOR Priority Institutional Structure Pro is an advanced market structure indicator based on institutional analysis. The system automatically identifies: Structural highs and lows Structure breakouts (SOR – Structure Override / priority breakout) Bullish and bearish fair value gaps (FVG) Real inefficiency zones with precise rectangles All directly on the chart, with no delay and no repainting. What Does the
Liquidity Map
Alex Amuyunzu Raymond
Liquidity Map  Overview The Liquidity Map indicator is an advanced visualization tool based on ICT Smart Money Concepts . It automatically identifies daily Buy Zones , Sell Zones , and Liquidity Levels , showing where price is likely to reverse or continue based on institutional order flow. It calculates key levels from the daily session — such as the previous day’s high, low, and midpoint — then derives a premium (sell bias) and discount (buy bias) structure. When price trades into these mapped
Glider
Vitalii Zakharuk
The Glider indicator gives accurate and timely signals to enter and exit the transaction that appear on the current candle. Using the indicator is very simple. When a dot and a blue line appear, open a buy deal. When a dot and a red line appear, open a sell deal. The main purpose of this indicator is to determine the moments of entry and exit from transactions, therefore the Glider indicator will display only the trend line and entry points, i.e. displays displays the entry points to the marke
Smart Structure Concepts MT5
Cristhian Alexander Gaibor Cuasquer
5 (1)
Smart Structure Concepts MT5 는 단순한 SMC 지표가 아닙니다. MetaTrader 5를 위해 만들어진 가장 완전한 기관 트레이딩 시스템입니다 — 실시간 구조 감지, 스마트 존 매핑, 교육적 툴팁, 실시간 푸시 알림을 하나의 검증된 도구에 통합했습니다. 시장의 대부분 SMC 지표는 선과 박스만 그리고 당신을 추측하게 만듭니다. 이 지표는 모든 신호를 차트에서 직접 설명합니다. BOS, CHoCH, 오더 블록, 공정가치 갭 등 어떤 객체 위에도 커서를 올리면 즉시 그 의미, 중요성, 다음에 해야 할 일을 정확히 확인할 수 있습니다. 추측 불필요. 외부 가이드 불필요. 필요한 모든 것이 이미 차트에 있습니다. 이것은 당신의 전체 SMC 툴킷을 대체하는 지표입니다. 실시간 구조 감지 내부 및 스윙 BOS와 CHoCH를 봉마다 추적합니다. 엔진은 기관 자금 흐름을 지속적으로 따릅니다 — 리페인트 없음, 지연 없음, 거짓 없음. 선택적 컨플루언스 필터가 약한 신호를 화
FREE
Quantum VWAP Pro for MT5
QUANTUM TRADING SOFTWARE LIMITED
The VWAP indicator is another of our suite of volume indicators and one which was first referred to in 1988 when it appeared in an article entitled “The Total Cost Of Transactions On The NYSE” in the March edition of the Journal Of Finance from that year, which went on to explain its importance, particularly from an institutional perspective, which underpins its significance in appreciating the power and importance of this indicator. In many ways, it is akin to the volume price analysis methodol
SmartTrendMA
Jhones Jorente Garcia
A SmartTrendMA foi projetada para identificar melhor zonas de alta, baixa e consolidação, azul alta, vermelho baixa e branco consolidação, vai te auxiliar a identificar melhor a tendência. Em parâmetro regule melhor conforme sua preferência em grau pois cada par de moeda se adequa diferentemente a cor,mude também o período e se quiser mude exponencial ou simples. 
Alpha Trades
Andriy Sydoruk
Alpha Trades — Adaptive Professional Trading System Author: Andrii Sydoruk Version: 1.0 Release Date: 31.10.2025 Support: andriisydoruk@gmail.com Description Alpha Trades is a next-generation universal trading expert, designed for stable and controlled operation under any market conditions. The system uses an adaptive analytical approach that automatically adjusts to the current market structure while maintaining a high level of accuracy and safety. The algorithm is built as a multi-layer
Automated Supply and Demand Tracker MT5. The following videos demonstrate how we use the system for trade setups and analysis.US PPI, Fed Interest Rates, and FOMC Trade Setup Time Lapse: U.S. dollar(DXY) and Australian dollar vs U.S. dollar(AUD/USD)  https://youtu.be/XVJqdEWfv6s  The EUR/USD Trade Setup time lapse 8/6/23.  https://youtu.be/UDrBAbOqkMY . US 500 Cash Trade Setup time lapse 8/6/23  https://youtu.be/jpQ6h9qjVcU .  https://youtu.be/JJanqcNzLGM ,  https://youtu.be/MnuStQGjMyg,&nbsp ;
DYNAMIC SR TREND CHANNEL Dynamic SR Trend Channel is a simple indicator for trend detection as well as resistance/support levels on the current timeframe. It shows you areas where to expect possible change in trend direction and trend continuation. It works with any trading system (both price action and other trading system that use indicators) and is also very good for renko charting system as well. In an uptrend, the red line (main line) serves as the support and the blue line serves as the r
Xau Marti MT5
BILLY ARANDUQUE ABCEDE
Get the EA for FREE Just sign up and use my broker. Broker Link :  https://fbs.partners?ibl=684451&ibp=26113188 Setfile Here :  https://drive.google.com/file/d/1ZKvGf5KaUTZvrt2YE98a18sp7nzGUpVf/view?usp=sharing MT4 Version Here :  https://www.mql5.com/en/market/product/136465 XAU Marti The Smart Choice for Gold & Forex Traders -  Profit Potential! Why This EA Stands Out: RSI-POWERED ENTRIES   - Combines the reliability of RSI indicators with advanced money management for high-probabi
Quantum Trend Scanner
Niccyril Chirindo
5 (1)
QUANTUM TREND SCANNER Professional Multi-Timeframe Trend Analysis Dashboard Quantum Trend Scanner is an advanced technical indicator designed to analyze market trends across multiple timeframes and currency pairs simultaneously. The indicator provides traders with comprehensive market insights through three integrated analytical panels. Quantum Trend Scanner Guide is Here  What It Does The indicator monitors 30 currency pairs across 9 timeframes (M1, M5, M15, M30, H1, H4, D1, W1, MN1) and pre
HalfTrend trendline with ATR pullback zones — built for trend traders. Spot the trend direction instantly, use ATR bands to judge “normal” pullbacks vs extended moves, and get alerts on trend flips and optional trendline touches .  HalfTrend ATR Bands & Alerts (MT5) is a trend-following indicator that plots a clean HalfTrend trendline together with ATR-based bands/zones . It provides trend change arrows , optional touch alerts (price touches the trendline), and EA/iCustom signal buffers for au
Rocket Trend
Andriy Sydoruk
The Rocket Trend indicator is trending. The indicator draws two-color points connected by lines along the chart. This is a trend indicator, it is an algorithmic indicator. It is easy to work and understand when a blue circle appears, you need to buy, when a red one appears, sell. The indicator is used for scalping and pipsing, and has proven itself well. Rocket Trend is available for analyzing the direction of the trend for a specific period of time. Ideal for novice traders learning the laws o
VWAP-ATR Range Indicator Professional Volatility-Adaptive VWAP Bands for Precision Trading The VWAP-ATR Range indicator is a powerful, adaptive volatility framework built around Volume-Weighted Average Price (VWAP). It combines statistical deviation (sigma) with Average True Range (ATR) to create dynamic, market-responsive trading zones that adjust in real time to changing market conditions. Unlike fixed-width VWAP bands, VWAP-ATR Range expands and contracts intelligently based on actual market
Hrum
Yvan Musatov
The Hrum indicator was created to neutralize temporary pauses and rollbacks. It analyzes price behavior and, if there is a temporary weakness in the trend, you can notice this from the indicator readings, as in the case of a pronounced change in trend direction. Entering the market is not difficult, but staying in it is much more difficult. With the Giordano Bruno indicator and its unique trend line, staying on trend will become much easier! Every rise and every fall is reflected in your emoti
이 제품의 구매자들이 또한 구매함
Divergence Bomber
Ihor Otkydach
4.89 (83)
이 지표를 구매하신 분께는 다음과 같은 혜택이 무료로 제공됩니다: 각 거래를 자동으로 관리하고, 손절/익절 수준을 설정하며, 전략 규칙에 따라 거래를 종료하는 전용 도우미 툴 "Bomber Utility" 다양한 자산에 맞게 지표를 설정할 수 있는 셋업 파일(Set Files) "최소 위험", "균형 잡힌 위험", "관망 전략" 모드로 설정 가능한 Bomber Utility의 셋업 파일 이 전략을 빠르게 설치, 설정, 시작할 수 있도록 돕는 단계별 영상 매뉴얼 주의: 위의 모든 보너스를 받기 위해서는 MQL5 개인 메시지 시스템을 통해 판매자에게 연락해 주세요. 독창적인 커스텀 지표인 “Divergence Bomber(다이버전스 봄버)”를 소개합니다. 이 지표는 MACD 다이버전스(괴리) 전략을 기반으로 한 올인원(All-in-One) 거래 시스템입니다. 이 기술 지표의 주요 목적은 가격과 MACD 지표 간의 다이버전스를 감지하고, **향후 가격이 어느 방향으로 움직일지를 알려주는
Azimuth Pro
Ottaviano De Cicco
5 (4)
LAUNCH PROMO Azimuth Pro price is initially set at 299$ for the first 100 buyers. Final price will be 499$ . THE DIFFERENCE BETWEEN RETAIL AND INSTITUTIONAL ENTRIES ISN'T THE INDICATOR — IT'S THE LOCATION. Most traders enter at arbitrary price levels, chasing momentum or reacting to lagging signals. Institutions wait for price to reach structured levels where supply and demand actually shift. Azimuth Pro maps these levels automatically: swing-anchored VWAP, multi-timeframe structure lines, an
Trend Screener Pro MT5
STE S.S.COMPANY
4.84 (101)
트렌드 표시기, 트렌드 트레이딩 및 필터링을 위한 획기적인 고유 솔루션, 하나의 도구 안에 내장된 모든 중요한 트렌드 기능! Forex, 상품, 암호 화폐, 지수 및 주식과 같은 모든 기호/도구에 사용할 수 있는 100% 다시 칠하지 않는 다중 시간 프레임 및 다중 통화 표시기입니다. Trend Screener는 차트에 점이 있는 화살표 추세 신호를 제공하는 효율적인 지표 추세 추종 지표입니다. 추세 분석기 표시기에서 사용할 수 있는 기능: 1. 트렌드 스캐너. 2. 최대 이익 분석이 있는 추세선. 3. 추세 통화 강도 측정기. 4. 경고가 있는 추세 반전 점. 5. 경고가 있는 강력한 추세 점. 6. 추세 화살표 Trend Screener Indicator가 있는 일일 분석 예, 일일 신호 성능...등은 여기에서 찾을 수 있습니다. 여기를 클릭하십시오. LIMITED TIME OFFER : Trend Screener Indicator는 50$ 및 평생 동안만 사용할 수 있습니다.
Grabber System MT5
Ihor Otkydach
4.83 (23)
탁월한 기술적 지표인 Grabber를 소개합니다. 이 도구는 즉시 사용 가능한 “올인원(All-Inclusive)” 트레이딩 전략으로 작동합니다. 하나의 코드 안에 강력한 시장 기술 분석 도구, 매매 신호(화살표), 알림 기능, 푸시 알림이 통합되어 있습니다. 이 인디케이터를 구매하신 모든 분들께는 다음의 항목이 무료로 제공됩니다: Grabber 유틸리티: 오픈 포지션을 자동으로 관리하는 도구 단계별 영상 매뉴얼: 설치, 설정, 그리고 실제 거래 방법을 안내 맞춤형 세트 파일: 인디케이터를 빠르게 자동 설정하여 최고의 성과를 낼 수 있도록 도와줍니다 다른 전략은 이제 잊어버리세요! Grabber만이 여러분을 새로운 트레이딩의 정점으로 이끌어 줄 수 있습니다. Grabber 전략의 주요 특징: 거래 시간 프레임: M5부터 H4까지 거래 가능한 자산: 어떤 자산이든 사용 가능하지만, 제가 직접 테스트한 종목들을 추천드립니다 (GBPUSD, GBPCAD, GBPCHF, AUDCAD, AU
AriX
Temirlan Kdyrkhan
1 (4)
AriX Indicator for MT5 A powerful trend-following and signal-evaluation tool AriX is a custom MT5 indicator that combines Moving Averages and ATR-based risk/reward logic to generate clear buy/sell signals. It visualizes dynamic SL/TP levels, evaluates past trade outcomes, and displays win/loss statistics in a clean on-chart panel. Key features include: Buy/Sell signals based on MA crossovers ATR-based SL/TP1/TP2/TP3 levels with visual lines and labels Signal outcome tracking with real-time stat
OmniSync Projection
Antonio-alin Teculescu
5 (1)
Chronos Fractal Engine is an innovative price projection indicator for MetaTrader 5, designed to transform your technical analysis by intelligently identifying and projecting historical price patterns. Built upon an advanced correlation algorithm and the fractal principles of the market, this powerful tool visualizes potential future price movements, giving you a unique edge in your trading decisions. What is Chronos Fractal Engine? At its core, the Chronos Fractal Engine employs a sophisticat
RFI levels PRO MT5
Roman Podpora
3.67 (3)
이 지표는 추세 반전 지점과 가격 반등 영역을 정확하게 보여줍니다.       주요 투자자들   . 새로운 트렌드가 형성되는 곳을 파악하고 최대한 정확하게 의사결정을 내리며 모든 거래를 완벽하게 통제합니다. TREND LINES PRO   지표와 함께 사용할 때 최대의 잠재력을 발휘합니다.  VERSION MT4 지표가 보여주는 내용: 새로운 추세의 시작 시 활성화되는 반전 구조 및 반전 수준. 최소한의 위험 대비 수익률을 갖는 이익 실현   (TAKE PROFIT)   및   손절매(STOP LOSS)   레벨 표시       RR 1:2   . 지능형 손실 감소 로직이 적용된 손절매 기능. 지정된 지표에서 두 가지 추세 유형에 대한 반전 패턴을 표시합니다. 지표: 트렌드를 따라   트렌드 라인 프로   (글로벌 트렌드 변화) 트렌드 프로   (빠른 트렌드 변화) 간단하고 효과적입니다       스캐너       실시간 추세 (신규). 다중 시간 프레임 도구 필터링. 표시하다  
우선적으로, 이 거래 도구는 전문적인 거래에 이상적인 비-다시 그리기 및 지연되지 않는 지표입니다.  온라인 강좌, 사용자 매뉴얼 및 데모. 스마트 가격 액션 컨셉트 인디케이터는 신규 및 경험 많은 트레이더 모두에게 매우 강력한 도구입니다. Inner Circle Trader Analysis 및 Smart Money Concepts Trading Strategies와 같은 고급 거래 아이디어를 결합하여 20가지 이상의 유용한 지표를 하나로 결합합니다. 이 인디케이터는 스마트 머니 컨셉트에 중점을 두어 대형 기관의 거래 방식을 제공하고 이동을 예측하는 데 도움을 줍니다.  특히 유동성 분석에 뛰어나 기관이 어떻게 거래하는지 이해하는 데 도움을 줍니다. 시장 트렌드를 예측하고 가격 변동을 신중하게 분석하는 데 탁월합니다. 귀하의 거래를 기관 전략에 맞추어 시장의 동향에 대해 더 정확한 예측을 할 수 있습니다. 이 인디케이터는 시장 구조를 분석하고 중요한 주문 블록을 식별하고 다양
소개       Quantum Breakout PRO   , 브레이크아웃 존 거래 방식을 변화시키는 획기적인 MQL5 지표! 13년 이상의 거래 경험을 가진 숙련된 트레이더 팀이 개발한       퀀텀 브레이크아웃 PRO       혁신적이고 역동적인 브레이크아웃 존 전략으로 거래 여정을 새로운 차원으로 끌어올리도록 설계되었습니다. Quantum Breakout Indicator는 5개의 이익 목표 영역이 있는 브레이크아웃 영역의 신호 화살표와 브레이크아웃 상자를 기반으로 한 손절 제안을 제공합니다. 초보자 거래자와 전문 거래자 모두에게 적합합니다. Quantum EA 채널:       여기를 클릭하세요 중요한! 구매 후 설치 매뉴얼을 받으려면 개인 메시지를 보내주십시오. 추천: 기간: M15 통화쌍: GBPJPY, EURJPY, USDJPY,NZDUSD, XAUUSD 계정 유형: 스프레드가 매우 낮은 ECN, Raw 또는 Razor 브로커 시간: GMT +3 중개인 :
ARIPoint
Temirlan Kdyrkhan
ARIPoint is a powerful trading companion designed to generate high-probability entry signals with dynamic TP/SL/DP levels based on volatility. Built-in performance tracking shows win/loss stats, PP1/PP2 hits, and success rates all updated live. Key Features: Buy/Sell signals with adaptive volatility bands Real-time TP/SL/DP levels based on ATR Built-in MA Filter with optional ATR/StdDev volatility Performance stats panel (Success, Profit/Loss, PP1/PP2) Alerts via popup, sound, push, or email Cu
RelicusRoad Pro MT5
Relicus LLC
5 (24)
RelicusRoad Pro: 퀀트 시장 운영 체제 70% 할인 평생 이용권 (한정 시간) - 2,000명 이상의 트레이더와 함께하세요 왜 대부분의 트레이더는 "완벽한" 지표를 가지고도 실패할까요? 진공 상태에서 단일 개념 만으로 거래하기 때문입니다. 문맥 없는 신호는 도박입니다. 지속적인 승리를 위해서는 컨플루언스(중첩) 가 필요합니다. RelicusRoad Pro는 단순한 화살표 지표가 아닙니다. 완전한 퀀트 시장 생태계 입니다. 독점적인 변동성 모델링을 사용하여 가격이 이동하는 "공정 가치 로드"를 매핑하고, 단순 노이즈와 실제 구조적 돌파를 구분합니다. 추측은 그만두세요. 기관급 로드 로직으로 거래를 시작하세요. 핵심 엔진: "Road" 알고리즘 시스템의 중심에는 시장 상황에 실시간으로 적응하는 동적 변동성 채널인 Road Algo 가 있습니다. 세이프 라인(평형) 과 가격이 수학적으로 반전될 가능성이 높은 확장 레벨 을 투영합니다. Simple Road: 일반적인 시장을 위
Quantum TrendPulse
Bogdan Ion Puscasu
5 (22)
SuperTrend   ,   RSI   ,   Stochastic   의 힘을 하나의 포괄적인 지표로 결합하여 트레이딩 잠재력을 극대화하는 궁극의 트레이딩 도구   인 Quantum TrendPulse를   소개합니다. 정밀성과 효율성을 추구하는 트레이더를 위해 설계된 이 지표는 시장 추세, 모멘텀 변화, 최적의 진입 및 종료 지점을 자신 있게 식별하는 데 도움이 됩니다. 주요 특징: SuperTrend 통합:   주요 시장 추세를 쉽게 따라가고 수익성의 물결을 타세요. RSI 정밀도:   매수 과다 및 매도 과다 수준을 감지하여 시장 반전 시점을 파악하는 데 적합하며 SuperTrend 필터로 사용 가능 확률적 정확도:   변동성이 큰 시장에서 숨겨진 기회를 찾기 위해 확률적 진동   을 활용하고 SuperTrend의 필터로 사용 다중 시간대 분석:   M5부터 H1 또는 H4까지 다양한 시간대에 걸쳐 시장을 최신 상태로 유지하세요. 맞춤형 알림:   맞춤형 거래 조건이 충족되면
PZ Swing Trading MT5
PZ TRADING SLU
5 (5)
Protect against whipsaws: revolutionize your swing trading approach Swing Trading is the first indicator designed to detect swings in the direction of the trend and possible reversal swings. It uses the baseline swing trading approach, widely described in trading literature. The indicator studies several price and time vectors to track the aggregate trend direction and detects situations in which the market is oversold or overbought and ready to correct. [ Installation Guide | Update Guide | Tro
Btmm state engine pro
Garry James Goodchild
5 (2)
Get the user guide here  https://g-labs.software/guides/BTMM_State_Engine_Welcome_Pack.html BTMM State Engine Pro — the   all-in-one Banks   & Institutions Market Maker indicator for Meta Trader 5. Built for   BTMM traders who follow the Asian   session breakout methodology with Kill Zone timing , level stacking, peak formation detection , and multi-pair scanning — all   from a single chart. Combines   a full BTMM State Engine   with a built-in multi-pair Scanner dashboard, eliminating the need
Easy SMC Trading
Israr Hussain Shah
4 (1)
자동 위험 관리 및 구조 돌파 스캐너를 포함한 구조 추세 분석 버전: 1.0 개요 자동 위험 관리 기능을 갖춘 구조 추세 분석은 가격 움직임과 시장 구조에 의존하는 트레이더를 위해 설계된 종합적인 트레이딩 시스템입니다. 부드러운 추세 필터와 스윙 포인트 감지, 구조 돌파(BOS) 신호를 결합하여 높은 확률의 거래 설정을 생성합니다. 이 도구의 가장 두드러진 특징은 자동 위험 관리 기능입니다. 유효한 구조 돌파가 감지되면 지표는 즉시 위험/보상 영역(1:1, 1:2, 1:3)을 계산하고 표시하며, 가격이 목표에 도달할 때 거래 시각화를 자동으로 관리합니다. 수동으로 차트를 그릴 필요가 없어 트레이더는 실행에만 집중할 수 있습니다. 주요 기능 동적 구조 돌파(BOS) 감지 스윙 고점(HH/LH)과 스윙 저점(HL/LL)을 자동으로 식별합니다. 가격이 주요 구조적 레벨을 돌파할 때 차트에 BOS 라인을 직접 표시하여 추세 방향을 확인합니다. 구조적 핵심 지점을 명확한 텍스트
Trade smarter, not harder: Empower your trading with Harmonacci Patterns This is arguably the most complete harmonic price formation auto-recognition indicator you can find for the MetaTrader Platform. It detects 19 different patterns, takes fibonacci projections as seriously as you do, displays the Potential Reversal Zone (PRZ) and finds suitable stop-loss and take-profit levels. [ Installation Guide | Update Guide | Troubleshooting | FAQ | All Products ] It detects 19 different harmonic pri
" Dynamic Scalper System MT5 " 지표는 추세 파동 내에서 스캘핑 방식으로 거래하도록 설계되었습니다. 주요 통화쌍 및 금에서 테스트되었으며, 다른 거래 상품과의 호환성이 가능합니다. 추가적인 가격 변동 지원을 통해 추세에 따라 단기 포지션 진입 신호를 제공합니다. 지표의 원리 큰 화살표는 추세 방향을 결정합니다. 작은 화살표 형태의 스캘핑 신호를 생성하는 알고리즘은 추세 파동 내에서 작동합니다. 빨간색 화살표는 상승 방향을, 파란색 화살표는 하락 방향을 나타냅니다. 민감한 가격 변동선은 추세 방향으로 그려지며, 작은 화살표의 신호와 함께 작용합니다. 신호는 다음과 같이 작동합니다. 적절한 시점에 선이 나타나면 진입 신호가 형성되고, 선이 있는 동안 미결제 포지션을 유지하며, 완료되면 거래를 종료합니다. 권장되는 작업 시간대는 M1~H4입니다. 화살표는 현재 캔들에 형성되며, 다음 캔들이 이미 시작되었더라도 이전 캔들의 화살표는 다시 그려지지 않습니다. 입
Meta Cipher B
SILICON HALLWAY PTY LTD
Meta Cipher B: MT5용 올인원 오실레이터 스위트 Meta Cipher B 는 인기 있는 Market Cipher B 개념을 MetaTrader 5에 도입하여 속도와 정밀도를 극대화했습니다. 처음부터 성능 중심으로 설계되어 전문가 수준의 신호 를 지연이나 느린 스크롤 없이 제공합니다. 단독으로도 강력하지만, Meta Cipher A 와 자연스럽게 함께 작동하도록 설계되어 완전한 시장 분석과 더 깊은 확인 기능을 제공합니다. 주요 기능 통합된 오실레이터 스택이 파동 모멘텀, VWAP, 자금 흐름, RSI, 스토캐스틱 을 시각화합니다. 조건이 일치하면 명확한 매수 및 매도 점이 표시됩니다. 짧은 시간 프레임에서는 진입 타이밍 조정에, 긴 시간 프레임에서는 시장 구조 분석에 활용할 수 있습니다. 고정밀 신호를 위한 설계 커브 매칭 기법 으로 정밀하게 보정하여 일반적인 시장 상황에서도 원래의 동작을 충실히 재현합니다. 하위 신호들은 부드럽게 동기화되어 파동과 점이 숙련된 트레
Entry Points Pro for MT5
Yury Orlov
4.48 (138)
다시 색을 칠하지 않고 거래에 진입할 수 있는 정확한 신호를 제공하는 MT5용 지표입니다. 외환, 암호화폐, 금속, 주식, 지수 등 모든 금융 자산에 적용할 수 있습니다. 매우 정확한 추정값을 제공하고 매수와 매도의 가장 좋은 시점을 알려줍니다. 하나의 시그널로 수익을 내는 지표의 예와 함께 비디오 (6:22)시청하십시오! 대부분의 거래자는 Entry Points Pro 지표의 도움으로 첫 거래 주 동안 트레이딩 결과를 개선합니다. 저희의   Telegram Group 을 구독하세요! Entry Points Pro 지표의 좋은점. 재도색이 없는 진입 신호 신호가 나타나고 확인되면(시그널 캔들이 완성된 경우) 신호는 더 이상 사라지지 않습니다. 여타 보조지표의 경우 신호를 표시한 다음 제거되기 때문에 큰 재정적 손실로 이어집니다. 오류 없는 거래 게시 알고리즘을 통해 트레이드(진입 또는 청산)를 할 이상적인 순간을 찾을 수 있으며, 이를 통해 이를 사용하는 모든 거래자의 성공률이
TPSpro RFI Levels MT5
Roman Podpora
4.53 (19)
러시아어 설명서  /  영어   설명서  /  MT4 버전 주요 기능: 판매자와 구매자의 활동 영역을 표시합니다! 이 지표는 매수 및 매도에 대한 모든 올바른 첫 번째 임펄스 레벨/존을 표시합니다. 진입점 검색이 시작되는 이러한 레벨/존이 활성화되면 레벨의 색상이 바뀌고 특정 색상으로 채워집니다. 상황을 더욱 직관적으로 파악할 수 있도록 화살표도 표시됩니다. LOGIC AI - 템플릿 활성화 시 진입점 검색을 위한 영역(원) 표시 시각적 명확성을 개선하기 위해 인공지능을 사용하여 진입점을 검색한 영역을 표시하는 기능이 추가되었습니다. 더 높은 시간대의 레벨/존 표시(MTF 모드) 더 높은 시간 간격을 사용하여 레벨/존을 표시하는 기능이 추가되었습니다. 또한, 이 지표는 자동 추세 감지 기능(   TPSproTREND PRO   )을 구현했습니다. 거래를 위한 별도의 전문적인 단계별 알고리즘 이 알고리즘은 추세 방향과 반대 방향으로의 당일 거래 모두에 적합하도록 설계되었습니다. 각
TPA True Price Action indicator reveals the true price action of the market makers through 100% non-repainting signals strictly at the close of a candle! TPA shows entries and re-entries, every time the bulls are definitely stronger than the bears and vice versa. Not to confuse with red/green candles. The shift of power gets confirmed at the earliest stage and is ONE exit strategy of several. There are available now two free parts of the TPA User Guide for our customers. The first "The Basics"
Trend Forecaster
Alexey Minkov
5 (7)
The Trend Forecaster indicator utilizes a unique proprietary algorithm to determine entry points for a breakout trading strategy. The indicator identifies price clusters, analyzes price movement near levels, and provides a signal when the price breaks through a level. The Trend Forecaster indicator is suitable for all financial assets, including currencies (Forex), metals, stocks, indices, and cryptocurrencies. You can also adjust the indicator to work on any time frames, although it is recommen
Gem SIGNAL
Shengzu Zhong
GEM Signal Pro - 전문 트레이딩 인디케이터 정밀한 진입. 리페인트 없음. 한 번에 하나의 결정. GEM Signal Pro는 MetaTrader 4 및 MetaTrader 5를 위해 구축된 전문가급 추세추종형 인디케이터입니다. 대부분의 리테일 인디케이터에 흔한 노이즈, 지연, 과장된 약속 없이, 깔끔하고 실행 가능한 신호를 요구하는 트레이더를 위해 설계되었습니다. 모든 신호는 독자적인 다층 확인 엔진을 통해 평가됩니다. GEM Signal Pro가 다른 이유 대부분의 인디케이터는 색깔 화살표 하나만 보여주고 나머지는 사용자가 추측하게 만듭니다. GEM Signal Pro는 완전한 거래 셋업을 제공합니다. 유효한 기회가 감지되면, 인디케이터는 시드 신호를 표시하고, 구조적 확인을 기다리며, 캔들 패턴 인식을 통해 최적의 진입 타이밍을 식별한 뒤, 차트에 정확한 리스크 관리 레벨을 그려줍니다. 진입가, 손절가, 그리고 각기 대응하는 손익비와 함께 3개의 목표가를 한눈에 볼
CGE Trading Suite
Carl Gustav Johan Ekstrom
5 (1)
CGE Trading Suite delivers the analytical edge typically reserved for professional trading desks. The platform integrates a full suite of analytical tools into one seamless workflow: dynamic grid mapping, liquidity behavior analysis, ECM, trend lines, MIDAS, trade cycles, and directional channel projections. Together, these provide a unified view of market structure and momentum. Directional clarity is further enhanced by the capital flow index, which measures currency basket strength to identif
Order Block Pro MT5
N'da Lemissa Kouame
Order Block Pro (MQL5) – 버전 1.0 작성자: KOUAME N'DA LEMISSA 플랫폼: MetaTrader 5 설명: Order Block Pro 는 차트에서 **강세 및 약세 오더 블록(Order Blocks)**을 자동으로 감지하는 고급 지표입니다. 횡보 캔들 이후 강한 상승/하락 캔들을 분석하여 가격이 급격히 움직일 가능성이 있는 주요 구간을 표시합니다. 트레이더에게 적합: 정확한 진입 및 청산 지점을 찾고 싶은 경우 동적 지지 및 저항 구간을 파악하고 싶은 경우 리스크 관리 및 거래 전략을 향상시키고 싶은 경우 주요 기능: 강세 OB 감지: 횡보 캔들 후 강한 상승이 발생하면 차트에 녹색 화살표 표시 약세 OB 감지: 횡보 캔들 후 강한 하락이 발생하면 차트에 빨간 화살표 표시 완전한 사용자 정의 가능: 횡보 캔들의 최대 실체 비율 ( BodyMaxRatio ) 다음 캔들의 최소 비율로 움직임 확인 ( NextCandleMinPct ) 차트 화살표
Berma Bands
Muhammad Elbermawi
5 (8)
Berma Bands(BBs) 지표는 시장 동향을 파악하고 이를 활용하려는 트레이더에게 귀중한 도구입니다. 가격과 BBs 간의 관계를 분석함으로써 트레이더는 시장이 추세 단계인지 범위 단계인지를 분별할 수 있습니다. 자세한 내용을 알아보려면 [ Berma Home Blog ]를 방문하세요. 버마 밴드는 세 개의 뚜렷한 선으로 구성되어 있습니다. 어퍼 버마 밴드, 미들 버마 밴드, 로어 버마 밴드입니다. 이 선들은 가격 주위에 그려져 전체 추세에 대한 가격 움직임을 시각적으로 표현합니다. 이 밴드들 사이의 거리는 변동성과 잠재적인 추세 반전에 대한 통찰력을 제공할 수 있습니다. 버마 밴드 라인이 각각에서 분리될 때, 그것은 종종 시장이 횡보 또는 범위 이동 기간에 접어들고 있음을 시사합니다. 이는 명확한 방향 편향이 없음을 나타냅니다. 트레이더는 이러한 기간 동안 추세를 파악하기 어려울 수 있으며 더 명확한 추세가 나타날 때까지 기다릴 수 있습니다. 버마 밴드 라인이 단일 라인으로
Advanced Supply Demand MT5
Bernhard Schweigert
4.53 (15)
현재 33% 할인! 초보자나 전문 트레이더를 위한 최고의 솔루션! 이 보조지표는 우리가 다수의 독창적 기능과 새로운 공식을 통합한 독특하고 고품질이며 저렴한 거래 도구입니다. 이 업데이트를 통해 이중 시간대를 표시할 수 있습니다. 더 높은 TF를 표시할 수 있을 뿐만 아니라 차트 TF와 더 높은 TF 모두를 표시할 수 있습니다: 중첩 영역 표시. 모든 Supply Demand 트레이더들이 좋아할 것입니다. :) 중요한 정보 공개 Advanced Supply Demand의 잠재력을 극대화하려면 다음을 방문하십시오. https://www.mql5.com/ko/blogs/post/720245   진입 또는 목표의 명확한 트리거 포인트를 정확히 찾아냄으로 해서 거래가 어떻게 개선될지 상상해 보십시오. 새로운 알고리즘을 기반으로 매수자와 매도자 간의 잠재적인 불균형을 훨씬 더 쉽게 분간할 수 있습니다. 왜냐하면 가장 강한 공급영역과 가장 강한 수요 영역과 과거에 어떻게 진행 되었는지를(이전
Ultimate SMC Indicator
Hicham Mahmoud Almoustafa
1 (1)
Ultimate SMC PRO – Smart Money Concepts Indicator (Order Blocks, FVG, Liquidity, BOS) for MetaTrader 5   After purchasing the product, you will receive an additional copy for free. Just contact me after your purchase. Ultimate SMC PRO is a professional trading indicator designed to visualize Smart Money Concepts directly on the chart. The indicator combines several institutional trading tools in one system to help traders identify potential high-probability trading zones. ULTIMATE SMC INDICATO
FootprintOrderflow
Jingfeng Luo
5 (3)
FOOTPRINTORDERFLOW: The Authoritative Guide ( This indicator is also compatible with economic providers that do not offer DOM data and BID/ASK data, It also supports various foreign exchange transactions, DEMO version,modleling must choose " Every tick based on real ticks"  ) Important notice: Before placing an order, please contact me first, and I will provide you with professional answers and services 1. Overview FOOTPRINTORDERFLOW  is an advanced Order Flow analysis tool designed for MetaTra
Gartley Hunter Multi
Siarhei Vashchylka
5 (11)
Gartley Hunter Multi - An indicator for searching for harmonic patterns simultaneously on dozens of trading instruments and on all possible timeframes. Manual (Be sure to read before purchasing) | Version for MT4 Advantages 1. Patterns: Gartley, Butterfly, Shark, Crab. Bat, Alternate Bat, Deep Crab, Cypher 2. Simultaneous search for patterns on dozens of trading instruments and on all possible timeframes 3. Search for patterns of all possible sizes. From the smallest to the largest 4. All fou
제작자의 제품 더 보기
Keltner Enhanced
David Ben Svaiter
Keltner-Enhanced improves the accuracy and readability of Keltner Channels with many options for adjusting them and more five price calculations beyond the META default. The Keltner-E indicator is a banded indicator similar to Bollinger Bands and Moving Average Envelopes. They consist of an upper envelope above a midline and a lower envelope below the midline.  The main occurrences to look out for when using Keltner Channels are breakouts above the Upper Envelope or below the Lower Envelope.
FREE
Pivot on Candle of the Day
David Ben Svaiter
5 (1)
How many times have you looked for a PIVOT that works on a specific candle every day? Many traders like to estimate the direction of the day's trend based on a specific time each day, such as 30 minutes after the market opens, or at 12 noon, and so on. This indicator allows you to specify a certain time (hour and minute) and plots a pivot from that time to the next day at the same time. It shows five lines based on that specific candle/hour: median, maximum, minimum, support and resistance.
FREE
Jurik Advanced MA
David Ben Svaiter
The Jurik Advanced MA (JurMA) is a non-repaint technical indicator developed over the original JMA concepted by Mark Jurik.  It is designed to reduce lag present in traditional moving averages, improve smoothness, and reduce noise. JurMA adapts to market volatility and can be fine-tuned by the user for sensitivity, making it useful for identifying trends and reversals in financial markets. This adaptability and efficiency make it popular among traders and analysts. In the wide context of othe
Trend On Close
David Ben Svaiter
TrendOnClose is a sophisticated indicator designed for Binary market investors, focusing on statistical analysis of trends and counter-trends within specific candle cycles. Each cycle is defined by the candle CLOSE price, establishing the trend direction (UP/DOWN - BULL/BEAR) for subsequent statistical analysis until the start of the next cycle. The statistical analysis operates with two configurations: ⦁ Statistical Goal as SUBSEQUENT CANDLE: The algorithm focuses on the subsequent candle withi
HAshi-E is an enhanced way to analyze Heiken-Ashi signals. Briefing: Heiken-Ashi is particularly valued for its ability to filter out short-term volatility, making it a preferred tool for identifying and following trends, helps in decision-making regarding entry and exit points, and assists in distinguishing between false signals and genuine trend reversals. Unlike traditional candlestick charts, Heiken-Ashi candles are calculated using average values of previous bars, creating a smoother, mo
The Enhanced ADXW
David Ben Svaiter
Designed by Welles Wilder for daily commodity charts, the ADXW is now used in various markets by technical traders to assess the strength of a trend or even a trend for short- or long-term trades. The ADXW uses a positive (DI+) and negative (DI-) directional indicator in addition to its trend line (ADX). According to Wilder, a trend has strength when the ADX signal is above 25; the trend is weak (or the price has no trend) when the ADX is below 20. The absence of a trend does not mean that th
On-Balance Volume (OBV) is a technical indicator that relates volume and price to identify price movements. The basic idea behind OBV is that changes in volume generally precede price changes. The indicator accumulates volumes for periods when the price closes higher and subtracts volumes for periods when the price closes lower. This results in a value used to identify the direction of the asset's trend. The interpretation of the OBV is simple: a rising OBV suggests that buyers are willing to
In the realm of technical analysis, ParbMA emerges as a highly intuitive tool for examining the Parabolic SAR trend . This innovative approach leverages a customizable line, distinguished by its versatility in color, shape, and width options. Such flexibility enhances visual analysis and significantly aids in strategizing and decision-making. The ParbMA (Parabolic Moving Average) is a custom technical indicator that combines the concepts of J. Welles Wilder's Parabolic SAR (Stop and Reverse) a
Slow AMA
David Ben Svaiter
Compared to simple or exponential moving averages, slow adaptive trend lines might offer a more nuanced view of the trend by adjusting their sensitivity based on market conditions. However, their slow nature might also mean they are late in signaling reversals when market conditions change rapidly - and that is the difference between them and our SlowAMA . SlowAMA was designed to be a better long-term trend indicator than EMA and other Moving Averages. It uses our JurMA calculations, reducing
HAshi-E is an enhanced way to analyze Heiken-Ashi signals. Briefing: Heiken-Ashi is particularly valued for its ability to filter out short-term volatility, making it a preferred tool for identifying and following trends, helps in decision-making regarding entry and exit points, and assists in distinguishing between false signals and genuine trend reversals. Unlike traditional candlestick charts, Heiken-Ashi candles are calculated using average values of previous bars, creating a smoother, mo
Pivot on Day Range
David Ben Svaiter
How many times have you looked for a PIVOT that works on a specific timeframe every day? Many traders like to estimate the direction of the day's trend based on a specific time interval every day, such as from 2 hours before the NYSE opens to 1 hour after, or from the NYSE opens to 30 minutes after. This indicator allows you to specify a certain time interval (hour and minute) and plots a pivot from that interval to the next day in the same time interval. It shows five lines based on this: me
필터:
리뷰 없음
리뷰 답변