YouTube'dan Mağaza ile ilgili eğitici videoları izleyin
Bir alım-satım robotu veya gösterge nasıl satın alınır?
Uzman Danışmanınızı
sanal sunucuda çalıştırın
sanal sunucuda çalıştırın
Satın almadan önce göstergeyi/alım-satım robotunu test edin
Mağazada kazanç sağlamak ister misiniz?
Satış için bir ürün nasıl sunulur?
MetaTrader 4 için teknik göstergeler - 45
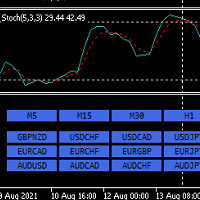
Hello,
This is an easy symbol change panel.
The free version only can change major pairs which are "AUDUSD, EURUSD, GBPUSD, USDCHF, USDCAD, USDJPY, NZDUSD"
The full version can add your symbols.
FULL version here:
https://www.mql5.com/en/market/product/71176?source=Site+Market+MT4+Indicator+New+Rating005
Also, can change the TimeFrame as well.
Symbols must be active on your Market Watch list.
Parameters:
ratio - change the size LineNumber - you can set that how many symbols are displa
FREE
Machine translation of the following: This indicator is used to close or open the price and time scales.Select true to display scale and false to close scale.After the price scale is closed and then opened, it may show that it is not at all. But it can be solved by switching time cycle.This indicator has two tags, D and P, which can be opened or closed in real time by clicking.The related parameters can be modified by user, such as the name, position and coordinates of the label.
FREE

The indicator represents 4 moving averages, shifted back. Created, like any moving average indicators, in order to see the approximate balance of volatility and the number of bulls and bears. The difference from other Moving Averages is that an attempt is made here to bring the moving averages of different periods to a common denominator, respectively, to bring the number of traders trading on different timeframes to a common denominator. The indicator is distributed as is.
MnojitelMA1, Mnojit
FREE

The Hong Kong Stock Exchange Session's Hours
This indicator facilitates observing the currency pair's quotations during subsequent parts of the stock exchange session live. Before the session starts, a rectangle is drawn on the chart but not filled in with color. It means the extent of the session duration. Before the first bar enters the rectangle of the session, a sound signal or pop-up window will notify us that the session will just start. When the price graph crosses the edge of the sessi
FREE

This pointer is supplied of a double smoothing in such way to succeed to be more reactive of a blunt Moving Average but without tracing the noises of bottom of the market. Its use will have to be exclusively turned to the search and to the identification of the trend in action (even if graphically it could seem an indicator that indicates an inversion of the prices) because the first useful signal is had to the opening of the successive bar to that one that has made to invert the sense of the
FREE
The purpose of this new version of the MT4 standard indicator provided in your platform is to display in a sub-window multiple timeframes of the same indicator. See the example shown in the picture below. But the display isn’t like a simple MTF indicator. This is the real display of the indicator on its timeframe. Here's the options available in the FFx indicator: Select the timeframes to be displayed (M1 to Monthly) Define the width (number of bars) for each timeframe box Alert pop up/sound/ema
FREE

The purpose of this new version of the MT4 standard indicator provided in your platform is to display in a sub-window multiple timeframes of the same indicator. See the example shown in the picture below. But the display isn’t like a simple MTF indicator. This is the real display of the indicator on its timeframe. Here's the options available in the FFx indicator: Select the timeframes to be displayed (M1 to Monthly) Define the width (number of bars) for each timeframe box Alert pop up/sound/ema
FREE

The purpose of this new version of the MT4 standard indicator provided in your platform is to display in a sub-window multiple timeframes of the same indicator. See the example shown in the picture below. But the display isn’t like a simple MTF indicator. This is the real display of the indicator on its timeframe. Here's the options available in the FFx indicator: Select the timeframes to be displayed (M1 to Monthly) Define the width (number of bars) for each timeframe box Alert pop up/sound/ema
FREE

A very useful indicator for trading, which shows the current load on the deposit. The load is calculated by the formula (margin / balance) * 100%. If necessary, the indicator beeps when the load on the deposit exceeds a certain level. The load is displayed total, taking into account all open positions.
Indicator parameters:
Color - text color. Font size - font size. Font family is a font family. Right - indent to the right. Bottom - indent bottom. Max load - the maximum load at which the sound
FREE

Harrow Band is an indicator based on support and resistance values. This indicator provides six bands that indicate the nearest of support or resistance position. With this indicator, it will be easier to see where entry and exit points of a trade are located.
Pairs and Timeframes This indicator can be used in any pairs and timeframes, but it is recommended to use it in XAUUSD H1.
Parameters NumCandle - number of candles used to calculate the support and resistance position. BandColor - color
FREE
This is a Demo version of PipsFactoryInd it is works only NZD/USD but full version is works on all currency pair.
This indicator is a collection of three indicators, it is 3 in 1: PipsFactoryDaily Click Here PipsFactoryWeekly Click Here PipsFactoryMonthly Click Here
This indicator depends on High and Low price of currency in the (Last day / Last week / Last Month) depends on user input, and then I made some secret equations to draw 10 lines.
Features:
You will know what exactly price you shoul
FREE

Features It is a demo version of All inOne indicator It works only on EURUSD, but the full version works on all currency pairs. All in One indicator is a simple indicator, it makes you know about 8 indicators in all timeframes simultaneously at a single glance. Stochastic RSI Moving Average (MA) Parabolic SAR ADX MACD CCI Last Candle (Candle) In all timeframes (M1, M5, M15, M30, H1, H4, D1, MN) at the same time.
Parameters Stochastic: PercentK : Period of the %K line. PercentD : Period of the %
FREE

Bu gösterge, aktif ve aktif olmayan işlem seanslarını gösterecek ve ayrıca işlem seansının aktif (1) veya pasif (0) olup olmadığı gibi küresel değişkenleri ayarlayacaktır. iCustom kitaplık işlevini kullanarak, bu göstergeyi bir Uzman Danışmandan veya Komut Dosyasından aşağıdaki gibi çağırabilirsiniz: // Özel göstergeyi çağır iCustom ( Symbol (), PERIOD_D1 , "Market/RedeeCash_TimeZone" , 0 , 0 ,Blue,Red); // global değişkenlerin değerlerini elde etmek double NewYorkSessionIsActive = GlobalVariabl
FREE

The indicator displays a grid in the form of a "honeycomb" or regular hexagon. An alternative to the standard grid of the terminal. Description of the indicator settings: color_comb - grid color width - width, for example: 22 for a screen resolution of 1920*1080, 15 for a screen resolution of 1366*768, etc. height - height, for example: 6 for a screen resolution of 1920*1080, 4 for a screen resolution of 1366*768, etc.
FREE

Not everyone can write an indicator. But anyone can have an idea. The indicator Universal Main Window Free , which takes as an input parameter the formula by which the indicator line will be drawn, will help to implement it. This indicator is intended for use in the main chart window.
All indicators of the series Universal :
Main window Separate window Free MT4 Universal Main Window Free MT5 Universal Main Window Free MT5 MT4 Universal Separate Window Free MT5 Universal Separate Window Free MT
FREE

This is a Bot which send notifications every hour at your MT4 platform. The notification consists of four part. <<Clock>> + Your Message + Symbols + profit + Total # of Orders + Total profit Here is an example : 21:00 Hodor: #US30 $+40.31 GOLD $-5.31 Total 5 Orders $+35.00 If there is no order : 21:00 Hodor: HODOR signals: https://www.mql5.com/en/signals/977796
There is a private message parameter where you can enter your own message also. Hodor_Comment_OnOff_Flag removes the "Hodor i
FREE

This indicator calculate the minimum,maximum,average and relative (to points of the bar) spread in the chart applied period. The indicator must be applied to one or more different period on a Pair and analyze the spread for all the Pairs available by the Broker. The csv output for one minute chart is something like this https://gofile.io/?c=K5JtN9 This video will show how to apply the indicator https://youtu.be/2cOE-pFrud8 Free version works only for GBPNZD
FREE
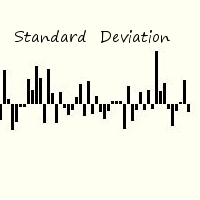
Standard deviation of returns is a popular way to view how the return of one bar relates to history. By knowing that you can better understand the magnitude of any return. The signal is calculated by taking the prior periods returns, adjusting for volatility of the returns of the last twenty periods, and dividing by the standard deviation. It is displayed in a separate panel as a histogram.
FREE

The Shanghai Stock Exchange Session's Hours
This indicator facilitates observing the currency pair's quotations during subsequent parts of the stock exchange session live. Before the session starts, a rectangle is drawn on the chart but not filled in with color. It means the extent of the session duration. Before the first bar enters the rectangle of the session, a sound signal or pop-up window will notify us that the session will just start. When the price graph crosses the edge of the sessio
FREE

The Shenzhen Stock Exchange Session's Hours
This indicator facilitates observing the currency pair's quotations during subsequent parts of the stock exchange session live. Before the session starts, a rectangle is drawn on the chart but not filled in with color. It means the extent of the session duration. Before the first bar enters the rectangle of the session, a sound signal or pop-up window will notify us that the session will just start. When the price graph crosses the edge of the sessio
FREE

The Tokyo Stock Exchange Session's Hours
This indicator facilitates observing the currency pair's quotations during subsequent parts of the stock exchange session live. Before the session starts, a rectangle is drawn on the chart but not filled in with color. It means the extent of the session duration. Before the first bar enters the rectangle of the session, a sound signal or pop-up window will notify us that the session will just start. When the price graph crosses the edge of the session r
FREE
Indicator that displays the current price and the percentage of loss or gain, compared to the previous day.
The benefits you get : Possibility to choose your favorite crosses. Never redesigns, does not retreat, never recalculates. Works on forex and CFD, timeframe from M1 to monthly. Easy to use.
Parameters : FontSize = 20; font size FontType = "Tahoma"; character type Angle = Bottom_Right; angle view (top right .. top left sect ..) Show_Price = true; view the Bid Show_Var = true; see the dif
FREE

Have you ever lost your mind? Cause you open multiple positions try to revenge the market or sometime open double, triple position to maximize the profit? if you are win it is okay, but how about if you lose? So "MaxOrdersWarning" may remind your consciousness not to open too many orders in the same time.
How to use - Drag and drop Indicator on your chart. - Set the limitation number of your position ( per Chart Symbol that you open )
Then what's next?
If you reaches the limit, the background
FREE
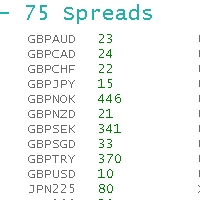
ObiForex 75 Spreads Discover a powerful indicator showcasing instant spreads for 75 currency pairs. Unlock valuable insights for informed trading decisions and optimize your strategies. The indicator features 3 columns, providing a comprehensive view of the spreads. Spread reading can be effectively used with macroeconomic news. Share your strategies! For optimal performance, install the indicator on the USDJPY currency pair. Experience the capabilities of ObiForex 75 Spreads and elevate your tr
FREE

Индикатор " AutoDiMA " рисует по графику в основном окне скользящую среднюю с динамическим периодом, рассчитываемым по стандартному индикатору " Average True Range (ATR) ". Когда " ATR " изменяется в диапазоне значений между верхним уровнем и нижним уровнем - тогда в заданном диапазоне меняется вариативный период скользящей средней. Принцип ускорения или замедления скользящей средней переключается в настройках параметром " FLATing ".
ВХОДНЫЕ ПАРАМЕТРЫ: - DRAWs : Количество баров для отображения
FREE
TradingDesk Demo – Performance Analyse MT4 This is a Demo version of TradingDesk indicator which is limited to show only EURUSD. Full version can be found here: https://www.mql5.com/en/market/product/40189
TradingDesk analysed MetaTrader 4 historical data by Symbol, Magic Number, Trade or Comment. All these evaluations will be displayed in real time on your MetaTrader 4 chart window.
All this information will be displayed in the following dashboards: account info General information about the
FREE

Not everyone can write an indicator. But anyone can have an idea. The indicator Universal Separate Window Free , which takes as an input parameter the formula by which the indicator line will be drawn, will help to implement it. This indicator is intended for use in the separate chart window.
All indicators of the series Universal :
Main window Separate window Free MT4 Universal Main Window Free MT5 Universal Main Window Free MT5 MT4 Universal Separate Window Free MT5 Universal Separate Window
FREE

Unlock key market insights with automated support and resistance lines Tired of plotting support and resistance lines? This is a multi-timeframe indicator that detects and plots supports and resistance lines in the chart with the same precision as a human eye would. As price levels are tested over time and its importance increases, the lines become thicker and darker, making price leves easy to glance and evaluate. [ Installation Guide | Update Guide | Troubleshooting | FAQ | All Products ] Boos

Precision trading: leverage wolfe waves for accurate signals Wolfe Waves are naturally occurring trading patterns present in all financial markets and represent a fight towards an equilibrium price. These patterns can develop over short and long-term time frames and are one of the most reliable predictive reversal patterns in existence, normally preceding strong and long price movements. [ Installation Guide | Update Guide | Troubleshooting | FAQ | All Products ] Clear trading signals Amazingly

Identify over 30 candlestick patterns with precision
This indicator recognizes over 30 Japanese Candlestick Patterns and highlights them beautifully on the chart. It is simply one of those indicators price action traders can't live without. [ Installation Guide | Update Guide | Troubleshooting | FAQ | All Products ]
Boost your technical analysis overnight Detect japanese candlestick patterns easily Trade reliable and universal reversal patterns Hop onto established trends safely using continua

The indicator detects the following types of Japanese candlesticks: Doji, Hammer and/or Hanging Man, Shooting Star and/or Inverted Hammer, Spinning Top, Maribozu. The indicator is intended for manual and/or automated trading within an Expert Advisor. There is a possibility to choose colors for bullish and bearish candlesticks. For automated trading, use any indicator buffer of the double type: 0, 1, 2 or 3, whose value is not zero!

The indicator is intended for detecting big (long) and/or small (short) candlesticks. There is possibility of coloring the bullish and bearish candlesticks. The indicator can be used for manual and/or automated trading within an Expert Advisor. The indicator data that can be used for automated trading can be taken from one of four buffers of the double type: 0, 1, 2 or 3. Values must not be equal to zero.

The algorithm of this indicator is based on a high-performance digital filter. The unique digital filtering algorithm allows receiving timely trading signals and estimating the current situation objectively while conducting technical analysis. The indicator is effective on small and big timeframes. Unlike common classic indicators, digital filtering method can significantly reduce the phase lag, which in turn allows obtaining a clear signal earlier than when using other indicators.

The indicator of DeMark fractals. The indicator can be drawn on the basis of price data and on the basis of a moving average. There is a possibility to color the up and down fractals. The indicator can be used for manual and for automated trading within an Expert Advisor. For automated trading, use any indicator buffer of the double type: 0 - up fractals, 1 - down fractals! Values of the buffers must not be equal to zero. A moving average is drawn on the basis of input parameters: Calc_Method

Description A universal colored indicator Stochastic. The rising and falling lines and the levels of the indicator can be colored. The indicator can be calculated as the standard one on the basis of a price or as a derivative on the basis of the following nineteen other indicators included in the standard package of the MetaTrader 4 terminal: AD - an indicator of accumulation and distribution of volume. OBV - On Balance Volume. Volume - tick volume indicator. AC - indicator of acceleration. AO

Description A universal colored indicator MACD Histo. The rising and falling of the indicator histogram can be colored. The indicator can be calculated as the standard one on the basis of a price or as a derivative on the basis of the following twelve other indicators included in the standard package of the MetaTrader 4 terminal: AD - an indicator of accumulation and distribution of volume. OBV - On Balance Volume. Volume - tick volume indicator. Force - Force Index indicator. MFI - Money Flow

Description A colored universal indicator MACD Line (MA convergence-divergence indicator, shown as a histogram). The rising and falling of the indicator histogram can be colored. The indicator can be calculated as the standard one on the basis of a price or as a derivative on the basis of the following twelve other indicators included in the standard package of the MetaTrader 4 terminal: AD - an indicator of accumulation and distribution of volume. OBV - On Balance Volume. Volume - tick volume i

Effortless trading: non-repainting indicator for accurate price reversals This indicator detects price reversals in a zig-zag fashion, using only price action analysis and a donchian channel. It has been specifically designed for short-term trading, without repainting or backpainting at all. It is a fantastic tool for shrewd traders aiming to increase the timing of their operations. [ Installation Guide | Update Guide | Troubleshooting | FAQ | All Products ] Amazingly easy to trade It provides

Description A universal indicator RSI together with moving averages based on it. Depending on the need, moving averages can be disabled. You can color the indicator lines and levels: lines of RSI, moving average lines and thresholds of overbought and oversold levels. The indicator can be calculated as the standard one on the basis of a price or as a derivative on the basis of the following eighteen other indicators included in the standard package of the MT4 terminal: AD - an indicator of accu

Description A universal indicator CCI together with moving averages based on it. Depending on the need, moving averages can be disabled. You can color the indicator lines and levels: lines of CCI, moving average lines and thresholds of overbought and oversold levels. The indicator can be calculated as the standard one on the basis of a price or as a derivative on the basis of the following eighteen other indicators included in the standard package of the MetaTrader 4 terminal: AD - an indicato

Description A multi-purpose multi-colored/multi-symbol indicator, which is a set of standard tools from the MetaTrader 4 terminal. The difference is that below the basic price chart it allows to calculate and build in a separate window any of the twenty indicators in a colored form, painting bulls and bears in different colors, for any financial instrument in accordance with the list below: AD - an indicator of accumulation and distribution of volume. OBV - On Balance Volume. Force - Force Inde

Description A colored universal indicator AO (Awesome Oscillator). The rising and falling of the indicator histogram can be colored. The indicator can be calculated as the standard one or as a derivative on the basis of the following eleven other indicators included in the standard package of the MetaTrader 4 terminal: AD - an indicator of accumulation and distribution of volume. OBV - On Balance Volume. Volume - tick volume indicator. Force - Force Index indicator. MFI - Money Flow Index. ATR

This Multi TimeFrame indicator is based on the "Fractals" classical indicator. 2 Inputs: TimeFrame1; TimeFrame2; You can put any available TimeFrame values (from M1 (Period_M1) to MN1 (Period_MN1)) equal or greater ( >= ) than the Period of the current Time Frame. The last Fractals will shown as color lines (Dots Line) of Support and Resistance for the Price moving.

This is a Multi-Time indicator which allows to display RSI and Stochastic indicators from upper timeframes on a single chart. As an example: a single chart EURUSD M5 and RSI (blue line) and Stochastic (yellow line) from H1.
Red Histogram is representing Lower trend and Green Histogram is representing Upper trend.

When you put this Multi TimeFrame Parabolic SAR indicator on the chart it will automatically use Parabolic SAR from next available 3 timeframes. Green arrow will show the beginning of Up trend and Red arrow will show the beginning of Down trend. If AlertsEnabled = true, the indicator will show the Alert (message window) with a text like this: "Price going Down on ", Symbol(), " - ", Period(), " min", " price = ", Bid; If eMailEnabled = true the Indicator will send you an eMail with the same text

The zero line is characterized the Flat trend.
V-shaped impulse indicates the entrance to the opposite direction. U-shaped impulse = entry orders in the same direction.
If AlertsEnabled = true, the indicator will show the Alert (message window) with a text like this:
"Price going Down on ", Symbol(), " - ", Period(), " min", " price = ", Bid;
If eMailEnabled = true the indicator will send you an eMail with the same text an Alert message with subject: "Trinity-Impolse" (of course you have to chec

The indicator displays the usual Moving Average with input parameters: maPeriod_1; maMethod_1; maAppPrice_1. Then it calculates and displays MA on MA1 with input parameters: maPeriod_2; maMethod_2. Then it calculates and displays MA on MA2 with input parameters: maPeriod_3; maMethod_3. If AlertsEnabled = true the Indicator will show the Alert (message window) with a text like this: "Price going Down on ", Symbol(), " - ", Period(), " min", " price = ", Bid; If eMailEnabled = true the Indicator w

Description A colored universal indicator MACD Classic (MA convergence-divergence indicator) that combines two indicators: MACD Line and MACD Histo. The rising and falling lines, the signal line and the indicator histogram can be colored. The indicator can be calculated as the standard one on the basis of a price or as a derivative on the basis of the following twelve other indicators included in the standard package of the MetaTrader 4 terminal: AD - an indicator of accumulation and distributio

Description The universal colored multicurrency/multisymbol indicator MACD Classic, consisting of two MACD indicators: MACD Line and MACD Histo. The indicator may be used with any broker, irrespective of the name of the financial instrument since it is necessary to manually enter the name as an input parameter. If you enter a non-existent or incorrect name of a financial instrument, you will receive an error message that this financial instrument is unknown (does not exist).
Inputs Currency_Nam

Multi TimeFrame Indicator "MTF CCI Trigger" based on the Commodity Channel Index from the upper TF (input parameter "TimeFrame") yellow line. Aqua line is representing ATR envelopes from the current TF. Green and Red arrows is triggered by CCI and represented UP and DOWN trends accordingly.

The BBImpulse indicator is based on the standard Moving Average indicator. You have MA input parameters:
maPeriod - Moving Average period;
maMODE - Moving Average mode (0 = MODE_SMA; 1 = MODE_EMA; 2 = MODE_SMMA; 3 = MODE_LWMA); maPRICE - Applied price (0=PRICE_CLOSE; 1=PRICE_OPEN; 2=PRICE_HIGH; 3=PRICE_LOW; 4=PRICE_MEDIAN; 5=PRICE_TYPICAL; 6=PRICE_WEIGHTED). Green Histogram is representing an UP-trend, Red Histogram is representing a Down-trend.

Multi TimeFrame indicator MTF ADX with Histogram shows ADX indicator data from the TF by your choice. You may choose a TimeFrame equal or greater than current TF. Yellow line is representing a price trend from the upper TF. Green line is representing +DI from the upper TF. Red line is representing -DI from the upper TF. Green histogram is displaying an Up-trend. Red histogram is displaying a Down-trend.

Description A colored universal indicator/oscillator based on crossing moving averages. The rising and falling lines of the indicator histogram can be colored. The combined use of the line and the histogram increases the level of the analysis when making a decision to open or close deals. The indicator can be calculated as the standard Price Oscillator or as a derivative on the basis of the following eleven other indicators included in the standard package of the MetaTrader 4 terminal: AD - an i

Description A universal colored multicurrency/multi-symbol indicator RAVI. Was proposed by T. Chand as a trend indicator. RAVI means Range Action Verification Index. The indicator may be used with any broker, irrespective of the name of the financial instrument since it is necessary to manually enter the name as an input parameter. If you enter a non-existent or incorrect name of a financial instrument, you will receive an error message that this financial instrument is unknown (does not exist).

Description A colored multicurrency/multisymbol oscillator of the market mood. The oscillator is designed for detecting the continuation or change of the market mood prior to its occurrence. An excellent example is the screenshots that show all the features of the oscillator. The oscillator may be used with any broker, irrespective of the name of the financial instrument since it is necessary to manually enter the name as an input parameter. If you enter a non-existent or incorrect name of a fin

Description The indicator determines the appearance of internal bars on the chart, and paints them in accordance with the bullish and/or bearish mood. The indicator can notify of the appearance of a formed internal bar by playing a beep, as well as display the time remaining until the end of the formation of the current bar in the format of <d:h:m:s, where: < means the current bar. d - days. h - hours. m - minutes. s - seconds. The bullish and bearish mood can be colored.
Inputs Sound_Play - a

This Indicator creates 2 white lines based on Exponential Moving Averag e of High and Low prices. You can regulate how many bars will be involved in the calculation with input parameter HL_Period. Red and Blue arrows are displaying the moment to go Short and Long trades accordingly.

The most common way to interpreting the price Moving Average is to compare its dynamics to the price action.
When the instrument price rises above its Moving Average, a buy signal appears, if the price falls below its moving average, what we have is a sell signal. To avoid a spontaneous entries one may use this update from Moving Average Indicator = Stepper-MA.

Envelopes technical Indicator is formed with two Moving Averages one of which is shifted upward and another one is shifted downward. Envelopes define the upper and the lower margins of the price range. Signal to sell appears when the price reaches the upper margin of the band; signal to buy appears when the price reaches the lower margin. To avoid a spontaneous entries one may use this update from Envelopes Indicator = Envelopes-Stepper.

The interpretation of the Bollinger Bands is based on the fact that the prices tend to remain in between the top and the bottom line of the bands. Abrupt changes in prices tend to happen after the band has contracted due to decrease of volatility;
If prices break through the upper band, a continuation of the current trend is to be expected;
If the pikes and hollows outside the band are followed by pikes and hollows inside the band, a reverse of trend may occur;
The price movement that has starte

Fibonacci sequence is defined by integer sequence: 0, 1, 1, 2, 3, 5, 8, 13, 34, 55, 89, 144, ... By definition, it starts from 0 and 1, the next number is calculated as a sum of two previous numbers. Instead of the standard moving average, the indicator uses the caluclation of average price in form:
Bar0 + Bar1 + Bar2 + Bar3 + Bar5 + Bar8 + Bar13 +... Input parameters: FiboNumPeriod (15) - Fibonacci period; nAppliedPrice (0) - applied price (PRICE_CLOSE=0; PRICE_OPEN=1; PRICE_HIGH=2; PRICE_LOW=

This indicator present a main Moving Average line with input parameters maPeriod_1, maMethod_1 and maAppPrice_1. The second line will be a calculation of the Moving Average data of a first line with input parameters maPeriod_2, maMethod_2. The third line will be a calculation of the Moving Average data of a second line with input parameters maPeriod_3, maMethod_3. To avoid a spontaneous entries one may use this indicator-stepper.

Description The indicator determines the appearance of the bars that signal of a reversal of current local moods and plays a beep. It also paints these bars in accordance with the bullish and/or bearish priority. You can select the color for bullish and bearish moods.
Inputs Sound_Play - a flag that allows the sound notification.
Use Detection of the reversal bar can be a signal to perform appropriate trading activities. The indicator can be used for manual or automated trading in an Expert A

Description The indicator determines the appearance of bars that notify of the reversal of the current trend, and paints them in accordance with the bullish and/or bearish mood. The indicator can notify of the appearance of a formed reversal bar by playing a beep, as well as display the time remaining until the end of the formation of the current bar in the format of <d:h:m:s, where: < means the current bar. d - days. h - hours. m - minutes. s - seconds. You can select the color for bullish and

Description A universal colored multicurrency/multi-symbol indicator of moving averages: Moving Average, Double Moving Average, Triple Moving Average . The indicator is drawn in a separate window, so below the main trading chart a user can see the development of another financial instrument. It is very useful when considering the combined values of various moving averages for different financial instruments below the main trading chart. The indicator may be used with any broker, irrespective of

Description A universal colored indicator of moving averages: Moving Average, Double Moving Average, Triple Moving Average . The indicator provides various opportunities for the analysis of prices based on different ways of constructing moving averages in the window of the main financial instrument. You can color bullish and bearish moods.
Inputs MA_Type - type of multiplicity: Moving Average. Double Moving Average. Triple Moving Average. MA_Period - the MA period. MA_Method - the averaging met

Description A colored universal multicurrency/multi-symbol indicator Bollinger Bands to be drawn in a separate window below the main financial instrument. The rising and falling line of the main indicator and Bollinger Bands can be colored. The indicator can be calculated based on one of the eleven basic indicators included in the standard package of the MetaTrader 4 terminal: AD - an indicator of accumulation and distribution of volume. OBV - On Balance Volume. Force - Force Index indicator. MF

Description A colored universal multicurrency/multi-symbol indicator Channel to be drawn in a separate window below the main financial instrument. The indicator uses the calculation method of the Price Channel indicator. The rising and falling line of the main indicator and the Channel lines can be colored. The indicator can be calculated based on one of the eleven basic indicators included in the standard package of the MetaTrader 4 terminal: AD - an indicator of accumulation and distribution o

This indicator (as almost all others) is based on classical Moving Averages. It shows the Average Bar under the current bar colored in aqua or over the current bar colored in orange. Input Parameters: ma_Period and ma_Method. The Average Bar maybe helpful to predict where the price will move in the nearest future. Of course, this "near future" depends of the current time frame.

Description A colored universal multicurrency/multi-symbol indicator ZigZag to be drawn in a separate window below the main financial instrument. The indicator may be used with any broker, irrespective of the name of the financial instrument since it is necessary to manually enter the name as an input parameter. If you enter a non-existent or incorrect name of a financial instrument, you will receive an error message that this financial instrument is unknown (does not exist). The indicator can
MetaTrader mağazası - yatırımcılar için alım-satım robotları ve teknik göstergeler doğrudan işlem terminalinde mevcuttur.
MQL5.community ödeme sistemi, MetaTrader hizmetlerindeki işlemler için MQL5.com sitesinin tüm kayıtlı kullanıcıları tarafından kullanılabilir. WebMoney, PayPal veya banka kartı kullanarak para yatırabilir ve çekebilirsiniz.
Alım-satım fırsatlarını kaçırıyorsunuz:
- Ücretsiz alım-satım uygulamaları
- İşlem kopyalama için 8.000'den fazla sinyal
- Finansal piyasaları keşfetmek için ekonomik haberler
Kayıt
Giriş yap
Gizlilik ve Veri Koruma Politikasını ve MQL5.com Kullanım Şartlarını kabul edersiniz
Hesabınız yoksa, lütfen kaydolun
MQL5.com web sitesine giriş yapmak için çerezlerin kullanımına izin vermelisiniz.
Lütfen tarayıcınızda gerekli ayarı etkinleştirin, aksi takdirde giriş yapamazsınız.