 MetaTrader 5
 Uzmanlar
 Göstergeler
 Komut dosyaları
 Kütüphaneler
 Depo
Depo
Fan sayfamıza katılın

SessionReopenEA - MetaTrader 5 için uzman

- Görüntülemeler:
- 10
- Derecelendirme:
- Yayınlandı:
-
 Alım-satım fırsatlarını kaçırıyorsunuz:
- Ücretsiz alım-satım uygulamaları
- İşlem kopyalama için 8.000'den fazla sinyal
- Finansal piyasaları keşfetmek için ekonomik haberler
Kayıt Giriş yapWeb sitesi politikasını ve kullanım şartlarını kabul edersiniz
Hesabınız yoksa, lütfen kaydolun -
 Bu koda dayalı bir robota veya göstergeye mi ihtiyacınız var? Freelance üzerinden sipariş edin
Freelance'e git
Bu koda dayalı bir robota veya göstergeye mi ihtiyacınız var? Freelance üzerinden sipariş edin
Freelance'e git
Altın, CME’de günlük bir bakım molası verir. Bu moladan sonraki ilk işlem saatinde, rastlantısallıkla açıklanamayacak kadar yüksek bir artış gözlemlenir; bu durum, on bir yıllık örneklemdeki her takvim yılında tekrarlanır — oysagünün geri kalan saatlerinde fiyat yatay seyretmektedir.
Bu Uzman Danışman, piyasanın yeniden açıldığı anda alım yapar, volatiliteye göre ölçeklendirilmiş sunucu tarafı stop emriyle sabit bir süre pozisyonu tutar ve başka hiçbir işlem yapmaz. Her seansta tek bir işlem gerçekleştirilir. Ortalama alma, ızgara stratejisi, martingale veya toparlanma stratejisi kullanılmaz.
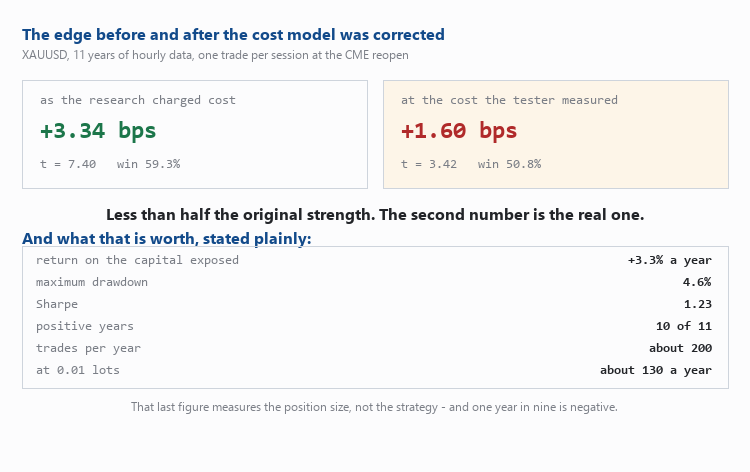
Rakam, ve ardından maliyet modelimin yanlış olduğunu fark ettikten sonraki rakam
11 yıllık saatlik veriler üzerinden ölçüldü; piyasanın yeniden açılışında giriş yapıp iki saat boyunca pozisyon tutuldu:
| araştırmada hesaplanan maliyet üzerinden | testçinin ölçtüğü maliyet üzerinden | |
|---|---|---|
| işlem başına | +3,34 baz puan | +1,60 baz puan |
| t istatistiği | 7,40 | 3,42 |
| kazanma oranı | %59,3 | %50,8 |
| kar faktörü | 1,63 | 1,30 |
| kârlı yıllar | 11'in 11'i | 11'in 10'u |
Sol sütun, çoğu insanın durduğu yerde durmuş olsaydım yayınlayacağım sonuçlardır. Ardından, MetaTrader'ın kendi Strateji Test Aracı'nda yapılan gerçek zamanlı geriye dönük test, yeniden açılışta gerçek gidiş-dönüş maliyetinin, araştırmamda hesapladığım 19 değil, yaklaşık60 puan olduğunu gösterdi — çünkü M1 çubuğununspread alanı çubuk başına bir özet olup, yeniden açılış spreadini yaklaşık üç kat daha az gösterir.
Avantaj, bu düzeltmeden sonra da orijinal gücünün yarısından az bir seviyede kalır ve kazanma oranı, sıklık yerine olumlu bir getiri ile desteklenen bir yazı tura atışına dönüşür. Sağdaki sütun gerçektir ve bu EA'nın dayandığı da budur.
Nedir, ne değildir
Bu bir geçim kaynağı değildir ve kaynak dosyanın başlığında, herhangi bir parametre açıklanmadan önce bu belirtilmiştir. %20'lik bir düşüşe göre ayarlanmış sermaye ile yıllık yaklaşık%3,3 getiri, %4,6'lık maksimum düşüş, 1,23 Sharpe oranı ve yılda yaklaşık 200 işlem kaydeder — bu daher dokuz yılda birinin negatif olduğu anlamına gelir. 0,01 lotta bu, yılda yaklaşık 130 döviz birimi demektir ve bu rakam stratejiyi değil,pozisyon büyüklüğünü gösterir.
Tek başına ele alındığında, 2,5 yıllık bir dönem içint değeri +1,12’dir — bu istatistiksel olarak anlamlı değildir. Bu stratejinin kârlı bir iki yıllık geriye dönük testi tek başına hiçbir şeyi kanıtlamaz; asıl önemli olan on bir yıllık örneklemdir.
Sonuca güvenmeden önce, sonuç ne gibi zorlukları atlattı?
Bunların her biri sonucu geçersiz kılabilirdi ve bunların listelenmesinin nedeni, kimsenin çürütmeye çalışmadığı bir sonucun gerçek bir sonuç olmamasıdır:
- Bu bir boşluk değildir. Kırılma boyunca kaydedilen boşluk ortalaması −0,011 'dir — hareket piyasaaçıkken gerçekleşir.
- Bu, çubuk oluşturma kaynaklı bir sapma değildir. Bağımsız olarak alınan M1 çubuklarından saatlik grafiği yeniden oluşturmak , örtüşen 73 günün tamamında H1 serisiyle 0,0000'e kadar uyum göstermektedir.
- Bu, uç değerler değildir. %1'lik kesilmiş ortalama, tam örneklemdeki +0,75'e karşı +0,70'tir; medyan ise +0,48'dir.
- Bu, bariz bir tuzak olabilecekspread normalizasyonu da değildir; zira MT5 çubukları alış tarafındadır ve yeniden açılış spread'i daha geniştir: spread tüm saat boyunca sabit kalır, dolayısıyla etkinin %0'ını açıklar.
- Kesin yeniden açılış tikine gerek yoktur. 15 dakika geç girilse de kâr edilir, 30 dakika geç girilse de kâr edilir ve 45 dakikada kâr ortadan kalkar.
- Haftalık yeniden açılış bunun bir parçası DEĞİLDİR. Pazar günü , t = 0,88 ile +1,11 baz puan ölçülür — gürültüden ayırt edilemez — buna karşılık günlük açılışlar için +3,90 baz puan ve t = 8,32 ölçülür. İşte bu yüzdenInpSkipMonday vardır ve varsayılan değeri true’dur.
Girişler ve neden bu şekilde oldukları
| Giriş | Anlam |
|---|---|
| InpEntryHour | Yeniden açılışın sunucu saati. Sunucu saatine göre çalışılması kasıtlıdır: bu broker'ın saati ABD yaz saati uygulamasına uyar, bu nedenle yeniden açılış tüm yıl boyunca sabit bir sunucu saatinde gerçekleşir; oysa UTC tetikleyicisi yılda iki kez bir saat kayma yaşatırdı. |
| InpEntryWindowMin | Sadece saatin bu kadar dakika içindeki süre içinde giriş yapın. |
| InpHoldHours | Zamanında kapanmadan önce bekletme süresi (saat cinsinden). |
| InpSkipMonday | Haftalık yeniden açılışı atlayın. Yukarıdaki Pazar rakamlarına bakın. |
| InpLots | Sabit lot. Asla ölçeklendirme yapılmaz. |
| InpStopAtrMult | Stop = bu değer × ortalama saatlik aralık. Varsayılan değer 2,0'dır, ilk sürümde kullanılan 1,5 değildir — aşağıya bakınız. |
| InpRangeBars | Ortalama aralık birimindeki H1 çubukları. 480, yaklaşık 20 seansa karşılık gelir. |
| InpMaxSpreadPts | Spread bu değerden daha kötü ise giriş yapılmaz. |
Stop çarpanı hakkında. Düzeltilmiş maliyetle , 1,5× +1,60 baz puan (t 3,42) verirken, 2,0× +1,91 (t 4,07) verir ve işlemlerin %2,6'sı yerine %1,3'ünde tetiklenir. Spread daha geniş olsa bile performans artmaya devam eder — ve stop kalır, çünkü “stop’u kaldırırsanız geriye dönük test sonuçları iyileşir” mantığı, tam da martingale stratejisini kârlı gösteren mantıktır. Stop, kuyruk olayını sınırlayan unsurdur; çıkış zamanı ise geri kalanını sınırlar.
Yukarıdakilerin herhangi birine inanmadan önce bunu test edin
Ve bunugerçek tick verilerine dayalı olarak her tick ile test edin. Başka bir kodumda, aynı kurallar aynı dönem için 1 dakikalık çubuk modellemesinde −15.627, gerçek tick verilerinde ise +79.000 sonuç verdi. Modelleme modunu belirtmeyen bir geriye dönük test, size neyi ölçtüğünü söylemiyor demektir.
MetaQuotes Ltd tarafından İngilizceden çevrilmiştir.
Orijinal kod: https://www.mql5.com/en/code/77060
 Prop Daily Loss Meter
Shows how much of the daily loss limit of a prop firm account is already used, and how much is left. Read-only indicator.
 Server Clock Check
Measures how far your PC clock is from the trade server's clock, from the server time stamped on live ticks, and tells you how to fix it.
Trade Excursion Report: MFE and MAE of every closed trade, to CSV
Kapanan her işlem için, hesap özetinde yer almayan rakamları içeren bir CSV satırı dışa aktarır: işlemin gösterdiği en yüksek gerçekleşmemiş kâr (MFE), atlattığı en kötü gerçekleşmemiş zarar (MAE), MFE’nin ne kadarının fiilen elde edildiği, kaç çubuk boyunca sürdüğü ve ne kadar süreyle açık kaldığı. Trade Excursion göstergesiyle aynı ölçümler, grafikte gösterilmek yerine bir dosyaya yazılır; çünkü bu verilerle ilgili sorulması gereken sorular, bir grafiğin cevaplayamayacağı sorulardır: yakalama oranı giriş saatine bağlı mıdır? Erken kapattığım işlemler, en uzun süre tuttuklarım mı? Pazartesi günleri gerçekleşen zararlı işlemlerin MAE değeri, Cuma günlerinkinden farklı mı? CSV dosyası hazır olduğunda, bu soruların yanıtlarını bir pivot tablo ile kolayca elde edebilirsiniz. Çıktı, MQL5\Files dizininde başlık satırı ile birlikte noktalı virgülle ayrılmış haldedir; herhangi bir elektronik tabloda açılabilir. Ölçüm sınırı: sapmalar, seçilen zaman dilimindeki çubukların en yüksek ve en düşük değerlerinden elde edilir; çubuk içindeki yol bilinmemektedir. Çubuklar sütunu, her işlemin elde ettiği çözünürlüğü bildirir ve özet, tek çubuklu işlemleri ortalamak yerine ayrı ayrı sayar.
 CGoldSymbol - find the broker's gold and size the position correctly on it
Aracı kurumun buna ne ad verdiği fark etmeksizin altın sembolünü algılar, sözleşme şartlarını varsaymak yerine terminalden okur ve hesap para birimindeki riski, o aracı kurum için doğru olan lot büyüklüğüne dönüştürür.