 MetaTrader 5
 Uzmanlar
 Göstergeler
 Komut dosyaları
 Kütüphaneler
 Depo
Depo
Fan sayfamıza katılın

Trade Excursion: how much of each winner you actually kept (MFE/MAE from your own history) - MetaTrader 5 için gösterge

- Görüntülemeler:
- 936
- Derecelendirme:
- Yayınlandı:
- Güncellendi:
-
 Alım-satım fırsatlarını kaçırıyorsunuz:
- Ücretsiz alım-satım uygulamaları
- İşlem kopyalama için 8.000'den fazla sinyal
- Finansal piyasaları keşfetmek için ekonomik haberler
Kayıt Giriş yapWeb sitesi politikasını ve kullanım şartlarını kabul edersiniz
Hesabınız yoksa, lütfen kaydolun -
 Bu koda dayalı bir robota veya göstergeye mi ihtiyacınız var? Freelance üzerinden sipariş edin
Freelance'e git
Bu koda dayalı bir robota veya göstergeye mi ihtiyacınız var? Freelance üzerinden sipariş edin
Freelance'e git
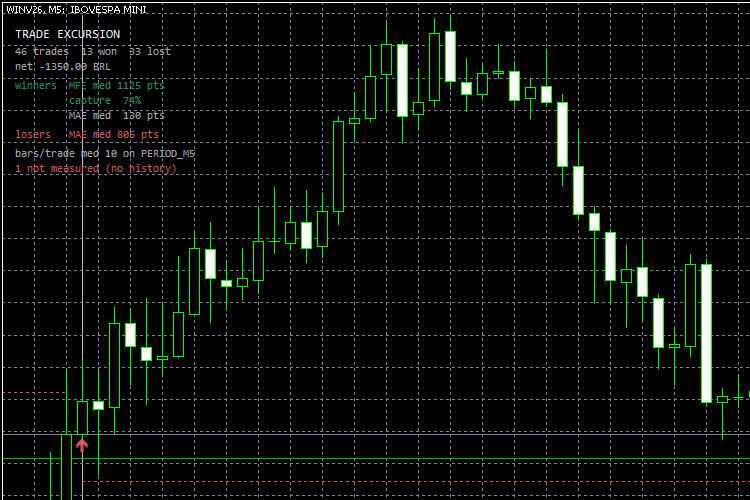
Your statement tells you what you kept. It does not tell you what you had. This indicator reads your own closed trades from the account history and draws, for each one, the full range it travelled: the best unrealised profit it ever showed (maximum favourable excursion, MFE) and the worst unrealised loss it survived (maximum adverse excursion, MAE). For each trade it draws a vertical span from the worst point to the best point, an arrow at the entry and a line at the exit; a panel summarises the whole set.
The gap between what a trade showed and what it paid is where two very common problems hide, and neither is visible in a balance curve: winners closing far below their best unrealised profit - the exit leaves money on the table; and losers whose worst excursion barely exceeded the stop - the stop sits inside the noise, and the trade was actually right.
The number to look at is the capture ratio: of the profit a winning trade showed at its best, how much did you actually take home? A median of 90% says the exits are well placed. A median of 30% says the market kept offering and the exit kept refusing. The panel prints the medians for winners (MFE, MAE, capture) and losers (MAE), the number of trades, and the median number of bars per trade.
Measurement limit, stated up front: excursions come from the high and low of the bars each trade spanned, on the timeframe the indicator runs on. The path inside a bar is unknown. Run it on a timeframe fine enough for your holding period - the panel reports the median bars per trade so you can see when the resolution is too coarse, and trades that fit inside a single bar are counted separately instead of quietly averaged in. Trades on symbols whose chart history is not available (an expired futures contract, for example) are reported as not measured, not as zeros.
Inputs: InpDias (90) - days of history to read; InpSoEsteAtivo (true) - this chart's symbol only; InpCorGanho / InpCorPerda - colours for winners and losers; InpCorMFE - colour of the excursion span; InpLarguraSpan (1) - span line width; InpMostrarPainel (true) - show the summary panel; InpPainelX / InpPainelY (12 / 24) - panel position in pixels.
Trades are grouped by position identifier, so positions built or unwound in parts are handled with a volume-weighted average price. Tested on a hedging demo account with 158 closed trades (47 measurable on the current contract, capture median 74%); netting accounts use the same grouping but were not tested at the time of publication. The companion script Trade Excursion Report writes the same numbers to a CSV, one line per trade. It predicts nothing: it measures trades that already happened, on your own account.
 Decision Watchdog: refuse yesterday's decision, fail closed, log once
A daily process writes "today's decision" (which strategy runs, or FLAT) to a file the EAs read at the open. One day the writer did not run. The EAs read yesterday's file, compared its date with TimeCurrent() - the server clock, which had stepped back to the previous day overnight - saw a match, and traded all morning on a 24-hour-old decision. No error anywhere. Two rules, both in this class: 1) staleness is judged against TimeLocal(), which always moves forward; TimeCurrent() is the last tick's stamp - it freezes without ticks and can step back on reconnect. 2) When in doubt the answer is FLAT: missing file, bad date, wrong day, empty line - every failure path returns "do nothing", and each is logged ONCE per state change, not on every tick and not never. File format: line 1 = ISO date, line 2 = decision string. The demo writes a fresh, a stale, a malformed, an empty and a missing file, and shows that only the first is allowed to trade.
Exposure Cap: one position limit per symbol across all your EAs
Four EAs on the same symbol, each one honest on its own: each checks "do I have a position?" with its own magic number, sees none, and enters. On a demo account this reached 22 contracts on a symbol meant to carry 1, and a watchdog had to close 16 positions in one morning. The cap belongs at the door, not after the fact. ExposureCap::Allowed(symbol, lots, cap) sums the volume of every open position on the symbol - all magic numbers, manual trades included - and refuses the order BEFORE it is sent when it would breach the cap. One log line with the three numbers (held, requested, cap) says why. Deliberately simple: gross exposure, no netting of longs against shorts, no per-EA quota. It is a check, not a lock: two EAs deciding on the same tick can both pass; in practice EAs on different charts decide on different ticks. The demo script prints held / cap / room for the current symbol and shows the refusal line. Nothing is traded.
 Trade Excursion Report: MFE and MAE of every closed trade, to CSV
Exports one CSV line per closed trade with the numbers a statement does not carry: the best unrealised profit the trade showed (MFE), the worst unrealised loss it survived (MAE), how much of the MFE was actually kept, how many bars it spanned, and how long it was held. Same measurement as the Trade Excursion indicator, written to a file instead of drawn, because the questions worth asking of this data are ones a chart cannot answer: does the capture ratio depend on the hour of entry? Are the trades I close early the ones I hold longest? Do losers on Mondays reach a different MAE than on Fridays? Those are one pivot table away once the CSV exists. Output is semicolon separated with a header row, in MQL5\Files; opens in any spreadsheet. Measurement limit: excursions come from bar highs and lows on the chosen timeframe; the path inside a bar is unknown. The bars column reports the resolution each trade got, and the summary counts single-bar trades separately instead of averaging them in.
 SessionReopenEA
Gold has a daily maintenance break on the CME. The first hour after it rises more than chance explains, in every calendar year of an 11-year sample - while every other hour of the day measures flat. One trade per session, a volatility-scaled server-side stop, no averaging or grid. Then my cost model turned out to be wrong. A real-tick backtest showed the true round-trip cost at the reopen is about 60 points, not the 19 my research had charged - the M1 bar spread field is a per-bar summary and understates it roughly threefold. Re-running 11 years at the corrected cost: +3.34 bps, t 7.40, 59.3% wins -> +1.60 bps, t 3.42, 50.8% wins The edge survives, at less than half its original strength. That second number is the real one. What it is not: about +3.3% a year with 4.6% drawdown, roughly one year in nine negative. At 0.01 lots that is ~130 a year - a figure that measures the position size, not the strategy.