 MetaTrader 5
 Uzmanlar
 Göstergeler
 Komut dosyaları
 Kütüphaneler
 Depo
Alım-satım robotlarını ücretsiz olarak nasıl indirebileceğinizi izleyin
Bizi Telegram üzerinde bulun!
Fan sayfamıza katılın
Fan sayfamıza katılın
Kodu beğendiniz mi? MetaTrader 5 terminalinde deneyin

USDX_Slope - MetaTrader 5 için gösterge

- Görüntülemeler:
- 9919
- Derecelendirme:
- Yayınlandı:
- Güncellendi:
-
 Alım-satım fırsatlarını kaçırıyorsunuz:
- Ücretsiz alım-satım uygulamaları
- İşlem kopyalama için 8.000'den fazla sinyal
- Finansal piyasaları keşfetmek için ekonomik haberler
Kayıt Giriş yapWeb sitesi politikasını ve kullanım şartlarını kabul edersiniz
Hesabınız yoksa, lütfen kaydolun -
 Bu koda dayalı bir robota veya göstergeye mi ihtiyacınız var? Freelance üzerinden sipariş edin
Freelance'e git
Indicator USDX vs Slope Direction Line is an information and signal indicator. It compares the line directions of two indicators, USDX and Slope Direction Line, and shows in a separate window the colored signal pointers, the color of which corresponds with the match/mismatch of the directions of Slope Direction Line and USDX.
It has five adjustable parameters:
- SDL Period - Slope Direction Line calculation period
- SDL Method - Slope Direction Line calculation method
- SDL Applied price - Slope Direction Line calculation price
- USDX slope shift - shift between the two data points to identify the direction of the USDX line
- USDX reverce - chart reverse of USDX (Yes/No)
- If the lines of USDX and Slope Direction Line are directed upwards:
- the green signal pointer is set
- If the lines of USDX and Slope Direction Line are directed downwards:
- the red signal pointer is set
- In any other case, the gray signal pointer is placed.
Slope Direction Line and USDX are not required to be in the terminal, since they are calculated by the indicator independently.
Indicator USDX is calculated by Close prices
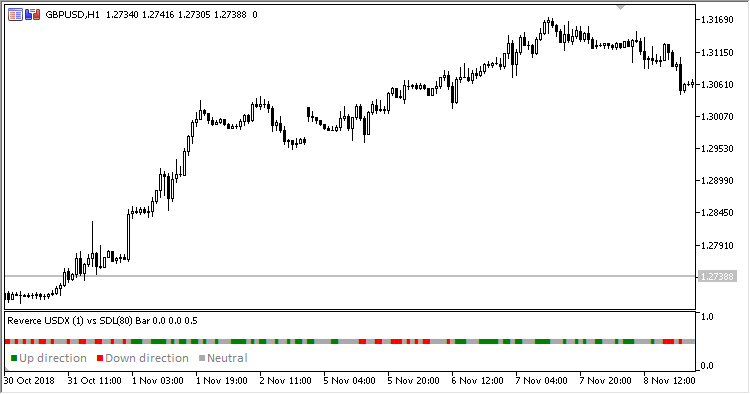
Fig. 1. USDX vs Slope Direction Line, USDX reverce = Yes, chart scale = 2
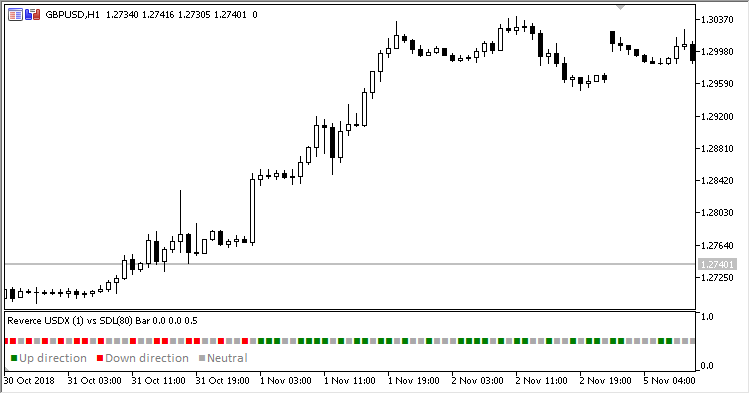
Fig. 2. USDX vs Slope Direction Line, USDX reverce = Yes, chart scale = 3
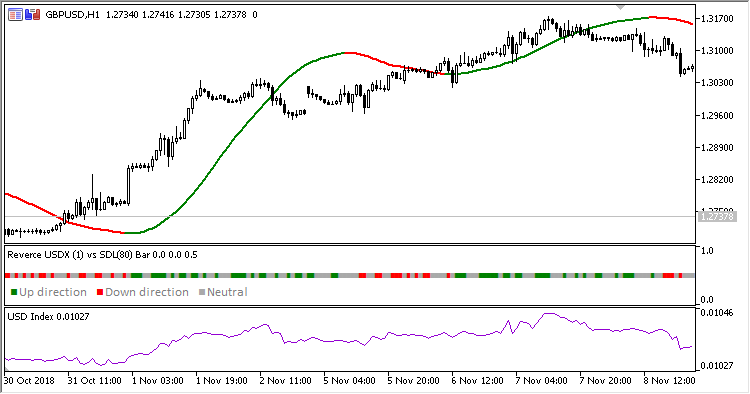
Fig. 3. USDX vs Slope Direction Line + USDX + Slope Direction Line, USDX reverce = Yes, chart scale = 2
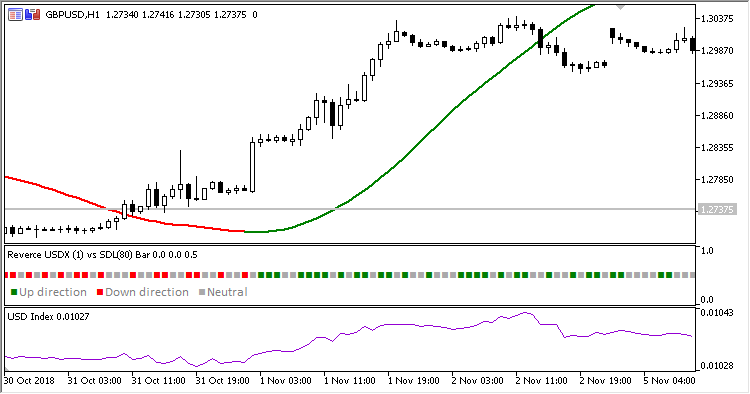
Fig.4. USDX vs Slope Direction Line + USDX + Slope Direction Line, USDX reverce = Yes, chart scale = 3
MetaQuotes Ltd tarafından Rusçadan çevrilmiştir.
Orijinal kod: https://www.mql5.com/ru/code/23411
Float_Pivot_Smoothed_Digit_System_HTF
Indicator Float_Pivot_Smoothed_Digit_System with the timeframe selection option in its input parameters
Heiken_Ashi_Smoothed_Volatility_Volume_HTF
Indicator Heiken_Ashi_Smoothed_Volatility_Volume with the timeframe selection option in its input parameters
Dynamic_Trend_MTF
Indicator Multi timeframe Dynamic Trend
3_in_1_Stochastic
Indicator 3 in 1 MTF Stochastic with MA Smoothing options