Fan sayfamıza katılın

MFI_normalized - MetaTrader 5 için gösterge
- Görüntülemeler:
- 7943
- Derecelendirme:
- Yayınlandı:
-
 Alım-satım fırsatlarını kaçırıyorsunuz:
- Ücretsiz alım-satım uygulamaları
- İşlem kopyalama için 8.000'den fazla sinyal
- Finansal piyasaları keşfetmek için ekonomik haberler
Kayıt Giriş yapWeb sitesi politikasını ve kullanım şartlarını kabul edersiniz
Hesabınız yoksa, lütfen kaydolun -
 Bu koda dayalı bir robota veya göstergeye mi ihtiyacınız var? Freelance üzerinden sipariş edin
Freelance'e git
Bu koda dayalı bir robota veya göstergeye mi ihtiyacınız var? Freelance üzerinden sipariş edin
Freelance'e git
Bollinger Bands are used for calculating overbought/oversold zones.
There are four input parameters:
- MFI period - MFI calculation period
- MFI applied volume - volume used for MFI calculation
- BB period - Bollinger Bands calculation period
- BB deviation - Bollinger Bands deviation
Calculation:
NormMFI = (MFI-BL) / (TL-BL)
where:
TL = BBands(MFI, BB period, BB deviation, UPPER_BAND)
BL = BBands(MFI, BB period, BB deviation, LOWER_BAND)
MFI - Money Flow Index(MFI period, MFI applied volume)
BBands - UPPER_BAND and LOWER_BAND of Bollinger Bands
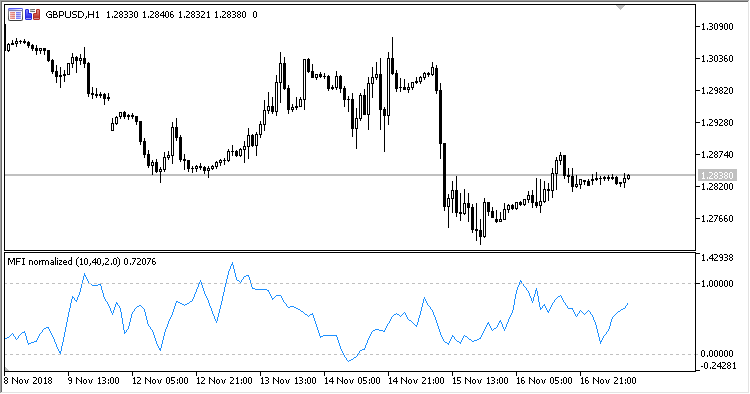
Fig.1. MFI normalized
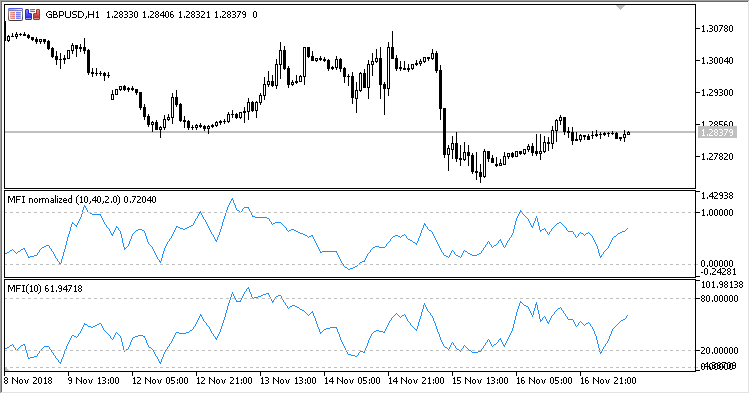
Fig.2. MFI normalized + MFI
MetaQuotes Ltd tarafından Rusçadan çevrilmiştir.
Orijinal kod: https://www.mql5.com/ru/code/23285
ColorMFI_X20_Cloud
The ColorMFI_X20 indicator featuring background filling in overbought/oversold areas
ColorMFI_X20
Twenty MFI indicators displayed in one window. Each line can be colored depending on its position relative to overbought and oversold areas
CandlesAutoFibo
The indicator builds Fibonacci levels at candlesticks High and Low, based on the timeframe specified in the indicator parameters
XFisher_org_v1_Vol_Supr_Zer_HTF
The XFisher_org_v1_Vol_Supr_Zer indicator with the possibility to change the indicator timeframe using input parameters