Fan sayfamıza katılın

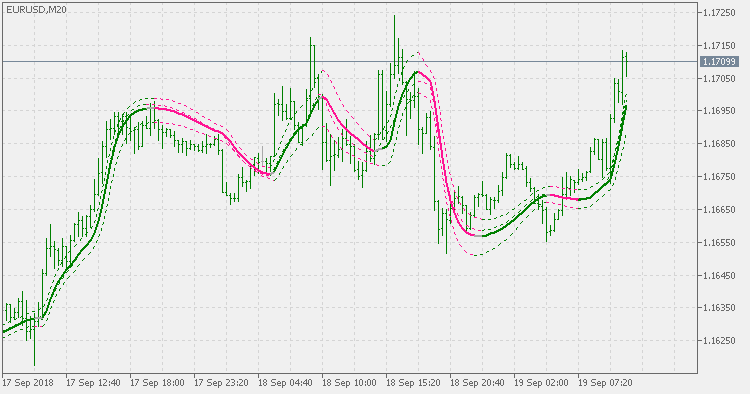
Jurik smooth on chart generic trend - MetaTrader 5 için gösterge

- Görüntülemeler:
- 8924
- Derecelendirme:
- Yayınlandı:
-
 Alım-satım fırsatlarını kaçırıyorsunuz:
- Ücretsiz alım-satım uygulamaları
- İşlem kopyalama için 8.000'den fazla sinyal
- Finansal piyasaları keşfetmek için ekonomik haberler
Kayıt Giriş yapWeb sitesi politikasını ve kullanım şartlarını kabul edersiniz
Hesabınız yoksa, lütfen kaydolun -
 Bu koda dayalı bir robota veya göstergeye mi ihtiyacınız var? Freelance üzerinden sipariş edin
Freelance'e git
Bu koda dayalı bir robota veya göstergeye mi ihtiyacınız var? Freelance üzerinden sipariş edin
Freelance'e git
Basics :
This indicator is using the well known JMA (Jurik Moving Average) to calculate a sort of a generic trend. The way it calculates it :
- it calculates the jma of high
- it calculates the jma of low
- it calculates the jma of close
- it calculates the jma of typical price (high+low+close)/3 - the "generic" value (it s not the same as (jma(high)+jma(low)+jma(close))/3 hence the name "generic")
- the slope of the "generic" depends on the slopes of the first 3 valuse
- if all are sloping up the color of the "generic value is the color for up
- if all are sloping down the color of the "generic value is the color for down
- otherwise the color of the "generic' is indicating neutral (thus filtering out some potential false signals)
Usage :
You can use the color of the "generic" value as a signal. Also, the colors of the other 3 jmas can be used as early warnings fo potential trend change or reversal
Step chart of RSX of average
Short description.
Volatility Indicator
Great indicator for Time series analysis as shows stationary properties. Indicator calculates the difference between a 14 period Double exponential moving average and price closes. Great to help identify unusual price activity.
RSX of alb average
RSX of adaptive lookback average
 High frequency volatility trader ( EURUSD H1 ONLY)
Expert advisor uses the difference between bar closes and a close moving average to detect unusual activity, it will then buy arbitrary volatility spikes. This is a prototype that I will be expanding on in the future, at the moment the user can input an arbitrary level to buy at. In future developments I plan on building a neural network in the EA that detects and compares volatility levels.