Fan sayfamıza katılın
Öyleyse bir link gönderin -
başkalarının da faydalanmasını sağlayın
- Görüntülemeler:
- 4855
- Derecelendirme:
- Yayınlandı:
-
Bu koda dayalı bir robota veya göstergeye mi ihtiyacınız var? Freelance üzerinden sipariş edin Freelance'e git
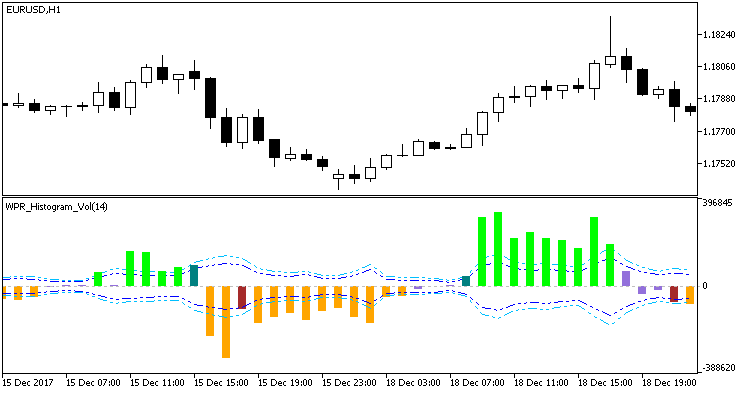
Williams’ Percent Range oscillator displayed as a color histogram, using volumes.
Calculation formula:
WPR Histogram Vol = ( WPR + 50) * Volume
For quite understandable reasons, the recalculation of overbought and oversold levels in such a modified oscillator should be performed using the same formula. In the final version, these levels are no longer permanent. Two levels with the appropriate breakout indication were used.
input int                 HighLevel2=+20;           // overbought level 2
input int                 HighLevel1=+15;           // overbought level 1
input int                 LowLevel1=-15;            // oversold level 1
input int                 LowLevel2=-20;            // oversold level 2
In the indicator input parameters, these levels are shifted by the levels of 50 of the source WPR, and then multiplied by volumes at each indicator tick.

Fig. 1. WPR_Histogram_Vol
MetaQuotes Ltd tarafından Rusçadan çevrilmiştir.
Orijinal kod: https://www.mql5.com/ru/code/22393
 Harami_Alert
The indicator defines Harami patterns and features alerts, emails and push notifications
 WPR_Histogram_Vol_HTF
WPR_Histogram_Vol indicator with the timeframe selection option available in input parameters
 Exp_BrainTrend2_AbsolutelyNoLagLwma_X2MACandle_MMRec
Three independent trading systems using BrainTrend_V2, AbsolutelyNoLagLWMA and X2MACandle indicators within a single EA with an ability to change the volume of a forthcoming trade depending on the results of the previous trades for this trading system
 Exp_Skyscraper_Fix_ColorAML_X2MACandle_MMRec
Three independent trading systems using Skyscraper_Fix, ColorAML and X2MACandle indicators within a single EA with an ability to change the volume of a forthcoming trade depending on the results of the previous trades for this trading system