Fan sayfamıza katılın

LBR_Paint_Bars - MetaTrader 5 için gösterge
- Görüntülemeler:
- 7706
- Derecelendirme:
- Yayınlandı:
-
 Alım-satım fırsatlarını kaçırıyorsunuz:
- Ücretsiz alım-satım uygulamaları
- İşlem kopyalama için 8.000'den fazla sinyal
- Finansal piyasaları keşfetmek için ekonomik haberler
Kayıt Giriş yapWeb sitesi politikasını ve kullanım şartlarını kabul edersiniz
Hesabınız yoksa, lütfen kaydolun -
 Bu koda dayalı bir robota veya göstergeye mi ihtiyacınız var? Freelance üzerinden sipariş edin
Freelance'e git
Bu koda dayalı bir robota veya göstergeye mi ihtiyacınız var? Freelance üzerinden sipariş edin
Freelance'e git
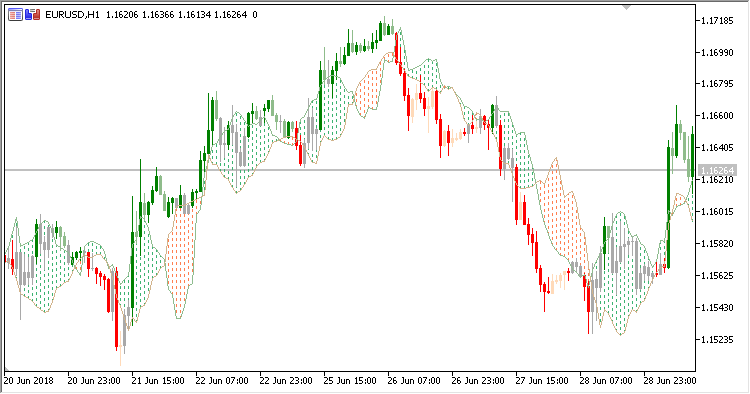
LBR Paint Bars indicator draws color candles depending on a trend direction. The trend is defined by the location of two volatility lines. A color cloud histogram is displayed along these two lines.
It has four inputs:
- Factor - ATR share in the cloud width calculation
- ATR period - ATR calculation period
- HL period - cloud borders calculation period
- Color Candles - display color candles (Yes/No)
Calculation:
Edge1 = Min(Lowest(Low, HL period) + Delta;
Edge2 = Max(Highest(High, HL period) - Delta;
where:
Delta = ATR(ATR period) * Factor
If color candles display is enabled (Color Candles = Yes):
- if the bullish candle is closed above the cloud, a green candle is displayed
- if the bearish candle is closed above the cloud, a light-green candle is displayed
- if the bearish candle is closed below the cloud, a red candle is displayed
- if the bullish candle is closed below the cloud, an orange candle is displayed
MetaQuotes Ltd tarafından Rusçadan çevrilmiştir.
Orijinal kod: https://www.mql5.com/ru/code/22200
Rahul_Mohindar_Osc
Rahul Mohindar oscillator
Standard_Deviation_Moving_Average_Ratio
Standard Deviations/Moving Average Ratio indicator
Hurst_Oscillator
Hurst oscillator indicator
XHullTrend_Digit_System
The indicator implements a breakout system using the XHullTrend_Digit indicator cloud