Fan sayfamıza katılın

FGDI - MetaTrader 5 için gösterge
- Görüntülemeler:
- 6205
- Derecelendirme:
- Yayınlandı:
-
 Alım-satım fırsatlarını kaçırıyorsunuz:
- Ücretsiz alım-satım uygulamaları
- İşlem kopyalama için 8.000'den fazla sinyal
- Finansal piyasaları keşfetmek için ekonomik haberler
Kayıt Giriş yapWeb sitesi politikasını ve kullanım şartlarını kabul edersiniz
Hesabınız yoksa, lütfen kaydolun -
 Bu koda dayalı bir robota veya göstergeye mi ihtiyacınız var? Freelance üzerinden sipariş edin
Freelance'e git
Bu koda dayalı bir robota veya göstergeye mi ihtiyacınız var? Freelance üzerinden sipariş edin
Freelance'e git
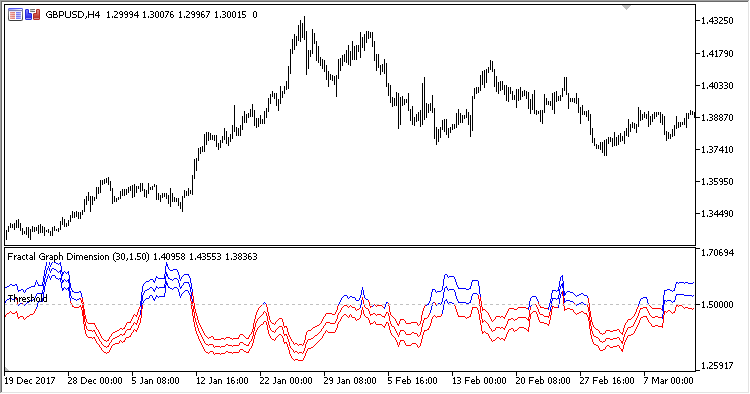
Fractal Graph Dimension Indicator shows the market state: trend or volatility.
It was described in "Technical Analysis of Stocks and Commodities" in March, 2007, in the article by Radha Panini, based on the article "A procedure to Estimate the Fractal Dimension of Waveforms" by Carlos Sevcik.
The indicator has three input parameters:
- Period - calculation period
- Applied price
- Threshold - the threshold level
Values below the threshold mean the trend state of the market and are displayed in red. Values above the threshold indicate the unstable volatile state and are displayed in blue.
MetaQuotes Ltd tarafından Rusçadan çevrilmiştir.
Orijinal kod: https://www.mql5.com/ru/code/21826
Forecast
The Forecast oscillator indicator
 Exp_Trend_Intensity_Index
A trading system based on the Trend_Intensity_Index oscillator signals.