Fan sayfamıza katılın

Wildhog - MetaTrader 5 için gösterge
- Görüntülemeler:
- 7049
- Derecelendirme:
- Yayınlandı:
- Güncellendi:
-
 Alım-satım fırsatlarını kaçırıyorsunuz:
- Ücretsiz alım-satım uygulamaları
- İşlem kopyalama için 8.000'den fazla sinyal
- Finansal piyasaları keşfetmek için ekonomik haberler
Kayıt Giriş yapWeb sitesi politikasını ve kullanım şartlarını kabul edersiniz
Hesabınız yoksa, lütfen kaydolun -
 Bu koda dayalı bir robota veya göstergeye mi ihtiyacınız var? Freelance üzerinden sipariş edin
Freelance'e git
Bu koda dayalı bir robota veya göstergeye mi ihtiyacınız var? Freelance üzerinden sipariş edin
Freelance'e git
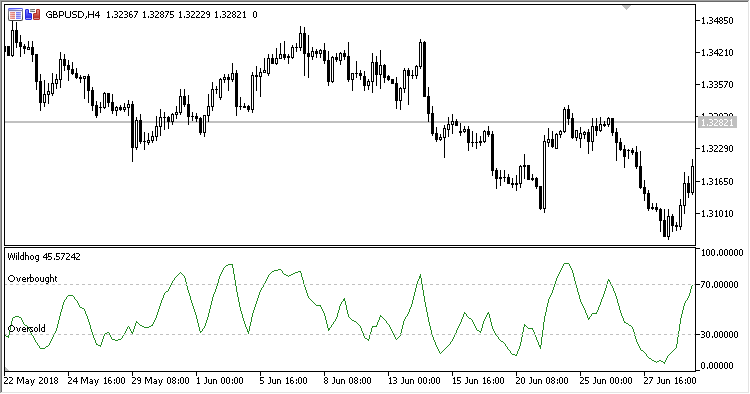
Wildhog oscillator displays asset's overbought/oversold states, as well as searches for divergences. It works on any timeframe.
The system is based on the last High, Low and Close eight bars.
The indicator has three input parameters:
- Period - calculation period
- Overbought - overbought level
- Oversold - oversold level
Calculation:
Wildhog = 100 * (Close-Min) / (3 * (Max-Min)) + PrevWildhog
where:
Max, Min are the highest and lowest prices within the Period interval
MetaQuotes Ltd tarafından Rusçadan çevrilmiştir.
Orijinal kod: https://www.mql5.com/ru/code/21393
DEMA_Range_Channel_HTF
DEMA_Range_Channel indicator with the timeframe selection option available in input parameters
DirectCandlesCounter_Candle
DirectCandlesCounter indicator in the form of candles.
 MostasHaR15 Pivot
The EA uses the following indicators: iADX (Average Directional Movement Index, ADX), two iMAs (Moving Average,MA) - one indicator at CLOSE prices and another one at OPEN prices, iOsMA (Moving Average of Oscillator, OsMA).
AMA Histogram
The histogram displays the difference of a Close price and iAMA (Adaptive Moving Average, AMA) indicator value.