Alım-satım robotlarını ücretsiz olarak nasıl indirebileceğinizi izleyin
Bizi Facebook üzerinde bulun!
Fan sayfamıza katılın
Fan sayfamıza katılın
Komut dosyasını ilginç mi buldunuz?
Öyleyse bir link gönderin -
başkalarının da faydalanmasını sağlayın
Öyleyse bir link gönderin -
başkalarının da faydalanmasını sağlayın
Komut dosyasını beğendiniz mi? MetaTrader 5 terminalinde deneyin
- Yayınlayan:
- Vladimir Karputov
- Görüntülemeler:
- 5955
- Derecelendirme:
- Yayınlandı:
-
Bu koda dayalı bir robota veya göstergeye mi ihtiyacınız var? Freelance üzerinden sipariş edin Freelance'e git
Idea by: Yuri.
MQL5 code by: Vladimir Karputov.
Operation algorithm
Searching for a signal within the interval from bar "0" to Depth of search.
Buying:
- RSI must be below 30;
- The price must reach the lowest Bollinger Band;
- Then wait until the candlestick moves to above the middle Bollinger Band;
- Stop Loss is placed below the last local Low. Take Profit is placed above the upper Bollinger Band;
- As soon as the upper line is reached, the stop must be moved to the breakeven point.
Sell:
- RSI must be above 70;
- The price must reach the upper Bollinger Band;
- Then wait until the candlestick moves to below the middle Bollinger Band;
- Stop Loss is placed above the last local High. Take Profit is placed below the lower Bollinger Band;
- As soon as the lower line is reached, the stop must be moved to the breakeven point.
Inputs
- Lots - position volume.
- Bands - Bands: Averaging period;
- RSI - RSI: Averaging period;
- Indent from High and Low - indent from High and Low when placing Stop Loss and Take Profit;
- Depth of search - number of bars, among which the signal is searched for;
- magic number - unique identifier for the EA.
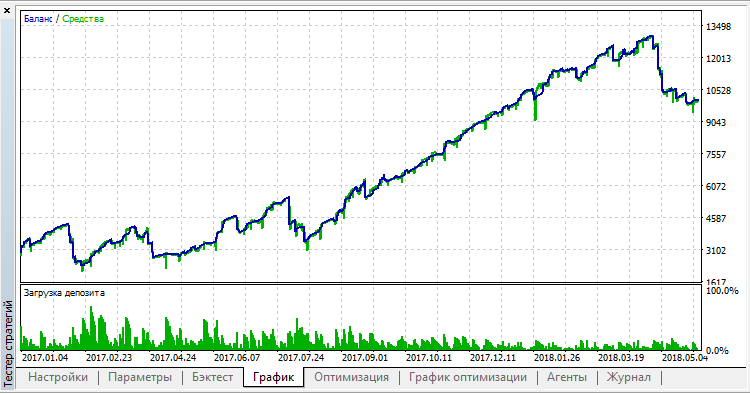
Upon optimization (attention: Non-optimized parameters are in the code; you have to search for the necessary values independently) on EURUSD,H1:

MetaQuotes Ltd tarafından Rusçadan çevrilmiştir.
Orijinal kod: https://www.mql5.com/ru/code/21032
 ColorX2MA_x2_cloud_HTF
Two indicators ColorX2MA from different timeframes, the area between lines being filled with a cloud, the color of which corresponds with the trend direction on the market
 Cutler_RSI
Cutler's RSI.
 DBB
DBB
Indicator Distance from Bollinger Bands.
 Directional_Breakout
An indicator of the movement direction and stop.
