Fan sayfamıza katılın

RSI_STARC - MetaTrader 5 için gösterge
- Görüntülemeler:
- 6304
- Derecelendirme:
- Yayınlandı:
-
 Alım-satım fırsatlarını kaçırıyorsunuz:
- Ücretsiz alım-satım uygulamaları
- İşlem kopyalama için 8.000'den fazla sinyal
- Finansal piyasaları keşfetmek için ekonomik haberler
Kayıt Giriş yapWeb sitesi politikasını ve kullanım şartlarını kabul edersiniz
Hesabınız yoksa, lütfen kaydolun -
 Bu koda dayalı bir robota veya göstergeye mi ihtiyacınız var? Freelance üzerinden sipariş edin
Freelance'e git
Bu koda dayalı bir robota veya göstergeye mi ihtiyacınız var? Freelance üzerinden sipariş edin
Freelance'e git
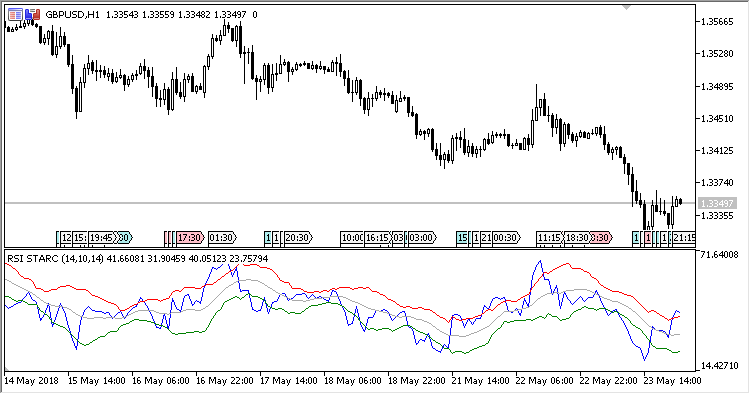
The indicator represents a combination of RSI and STARC (Stoller Average Range Channels), which is similar to indicator Bollinger Bands in its behavior: Its bands get narrower on stable markets and wider on volatile markets.
However, STARC is not based on close prices and it does not consider standard square deviation. It is calculated using average true range (ATR), providing more detailed information on market volatility.
The indicator has five input parameters:
- RSI period - RSI calculation period;
- ATR period - ATR period for calculating STARC;
- Smoothing - smoothing the central line of the STARC channel;
- Top line multiplier - multiplier of the channel top line (range upwards from the mean line);
- Bottom line multiplier - multiplier of the channel bottom line (range downwards from the mean line).
Calculations:
RSI = Relative Strength Index(Close price, RSI period)
MA = MA(RSI, Smoothing)
Top = MA + Top line multiplier * ATR
Bottom = MA -Bottom line multiplier * ATR
where:
ATR = MA(TR, ATR period)TR[i] = Abs(RSI[i] - RSI[i-1])
MetaQuotes Ltd tarafından Rusçadan çevrilmiştir.
Orijinal kod: https://www.mql5.com/ru/code/20869
ProfitCalculator
Panel indicator with the date on closed positions.
Trend_Angle
The indicator calculates the inclination angle of the last segment of moving average and shows it in the chart together with the MA line and the line drawn from the last segment of moving average.