Join our fan page

RSI_STARC - indicator for MetaTrader 5
- Views:
- 6299
- Rating:
- Published:
-
 You are missing trading opportunities:
- Free trading apps
- Over 8,000 signals for copying
- Economic news for exploring financial markets
Registration Log inYou agree to website policy and terms of use
If you do not have an account, please register -
 Need a robot or indicator based on this code? Order it on Freelance
Go to Freelance
Need a robot or indicator based on this code? Order it on Freelance
Go to Freelance
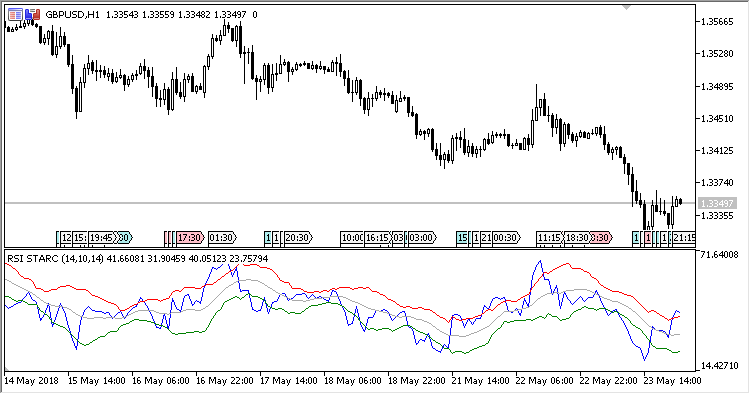
The indicator represents a combination of RSI and STARC (Stoller Average Range Channels), which is similar to indicator Bollinger Bands in its behavior: Its bands get narrower on stable markets and wider on volatile markets.
However, STARC is not based on close prices and it does not consider standard square deviation. It is calculated using average true range (ATR), providing more detailed information on market volatility.
The indicator has five input parameters:
- RSI period - RSI calculation period;
- ATR period - ATR period for calculating STARC;
- Smoothing - smoothing the central line of the STARC channel;
- Top line multiplier - multiplier of the channel top line (range upwards from the mean line);
- Bottom line multiplier - multiplier of the channel bottom line (range downwards from the mean line).
Calculations:
RSI = Relative Strength Index(Close price, RSI period)
MA = MA(RSI, Smoothing)
Top = MA + Top line multiplier * ATR
Bottom = MA -Bottom line multiplier * ATR
where:
ATR = MA(TR, ATR period)TR[i] = Abs(RSI[i] - RSI[i-1])
Translated from Russian by MetaQuotes Ltd.
Original code: https://www.mql5.com/ru/code/20869
ProfitCalculator
Panel indicator with the date on closed positions.
Trend_Angle
The indicator calculates the inclination angle of the last segment of moving average and shows it in the chart together with the MA line and the line drawn from the last segment of moving average.