 MetaTrader 5
 Uzmanlar
 Göstergeler
 Komut dosyaları
 Kütüphaneler
 Depo
Alım-satım robotlarını ücretsiz olarak nasıl indirebileceğinizi izleyin
Bizi Telegram üzerinde bulun!
Fan sayfamıza katılın
Fan sayfamıza katılın
Kodu beğendiniz mi? MetaTrader 5 terminalinde deneyin

Cumulative_Volume - MetaTrader 5 için gösterge

- Görüntülemeler:
- 7860
- Derecelendirme:
- Yayınlandı:
- Güncellendi:
-
 Alım-satım fırsatlarını kaçırıyorsunuz:
- Ücretsiz alım-satım uygulamaları
- İşlem kopyalama için 8.000'den fazla sinyal
- Finansal piyasaları keşfetmek için ekonomik haberler
Kayıt Giriş yapWeb sitesi politikasını ve kullanım şartlarını kabul edersiniz
Hesabınız yoksa, lütfen kaydolun -
 Bu koda dayalı bir robota veya göstergeye mi ihtiyacınız var? Freelance üzerinden sipariş edin
Freelance'e git
This oscillator indicator provides an interesting method for presenting volume data. It displays the total volume over the selected period.
Volume data can be represented in several ways:
- Combined
- Absolute
- Relative
- Separated
- Absolute
- Relative
Volumes can be displayed in relative or absolute values, as well as in a combined or a separated way.
The indicator has three input parameters:
- Period - calculation period;
- Combined - show data either in a combined or in a separated way (Yes/No);
- Relative - choose between relative/absolute values (Yes/No).
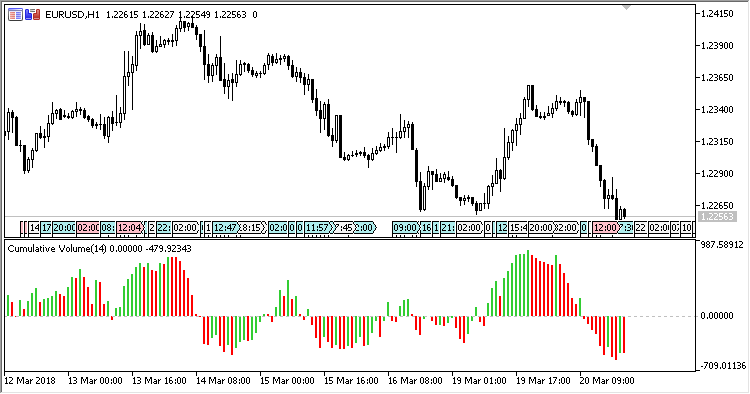
Fig.1. Combined, relative representation
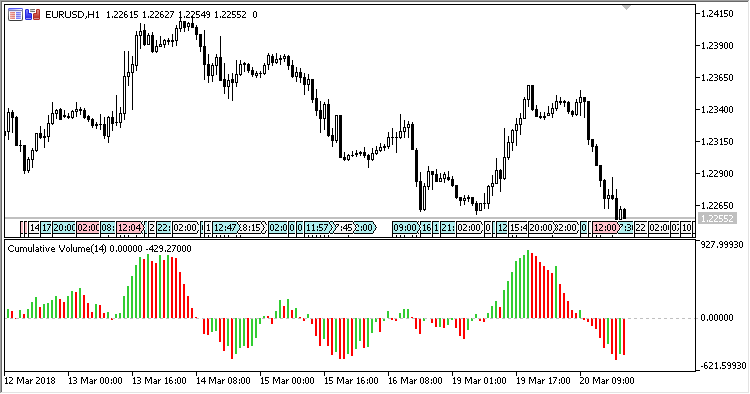
Fig.2. Combined, non-relative representation
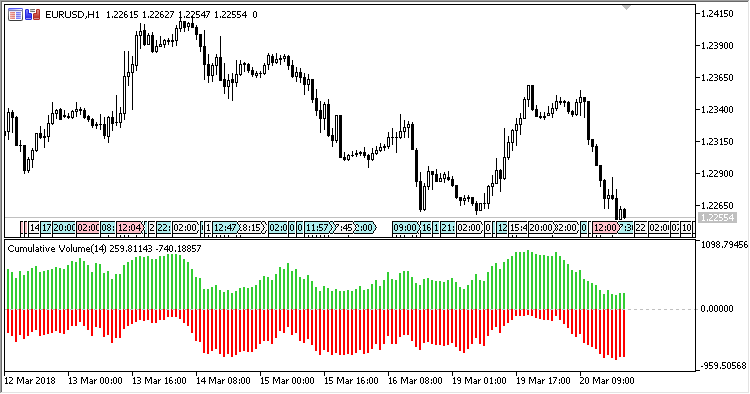
Fig.3. Non-combined, relative representation
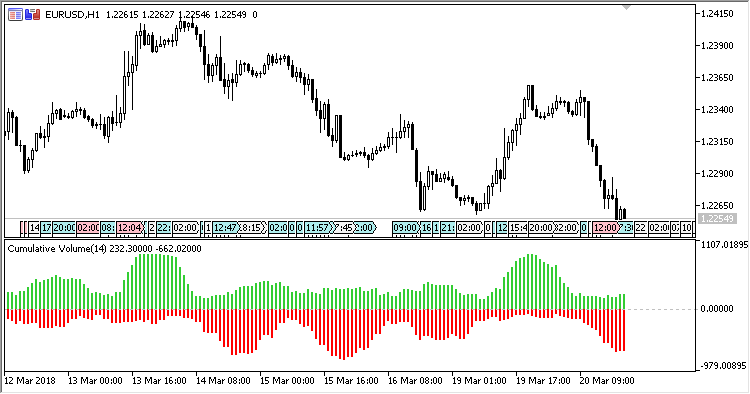
Fig.4. Non-combined, non-relative representation
MetaQuotes Ltd tarafından Rusçadan çevrilmiştir.
Orijinal kod: https://www.mql5.com/ru/code/20267
SHL_MA_Band
A trend indicator: Smoothed High/Low Linear regression band.
HL_MA_Band
A trend indicator: High/Low Linear regression band.
MA_Difference
An oscillator indicator showing a difference between MA and the price.
Period_Open_Line
The indicator shows the open price of a period.