Fan sayfamıza katılın

Woodies CCI - MetaTrader 5 için gösterge

- Görüntülemeler:
- 16681
- Derecelendirme:
- Yayınlandı:
-
 Alım-satım fırsatlarını kaçırıyorsunuz:
- Ücretsiz alım-satım uygulamaları
- İşlem kopyalama için 8.000'den fazla sinyal
- Finansal piyasaları keşfetmek için ekonomik haberler
Kayıt Giriş yapWeb sitesi politikasını ve kullanım şartlarını kabul edersiniz
Hesabınız yoksa, lütfen kaydolun -
 Bu koda dayalı bir robota veya göstergeye mi ihtiyacınız var? Freelance üzerinden sipariş edin
Freelance'e git
Bu koda dayalı bir robota veya göstergeye mi ihtiyacınız var? Freelance üzerinden sipariş edin
Freelance'e git
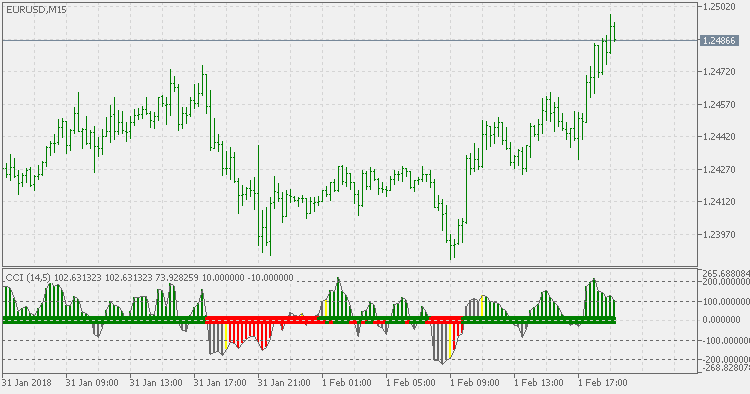
Woodies CCI is a momentum indicator that was developed by Ken Woods. It's based on a 14 period Commodity Channel Index (CCI). It's a fully unbounded oscillator with a base value of 0 and has no lower or upper limit.
Some traders use the indicator to spot a number of tradable CCI patterns both with and against the trend, such as the zero line reject, the reverse divergence and the trendline break. The 200 level signals an extreme reading. The indicator is often used in combination with other signals.
ATR Probability Levels
Probability levels based on ATR. "Probability" is calculated based on the projected Average True Range and previous period Close.
HOPS and LOPS
HOPS and LOPS indicator. The "HOPS" and "LOPS" stand for High Of the Previous Session and Low Of the Previous Sessions.
Percentage Price Oscillator
The Percentage Price Oscillator (PPO) is a technical Momentum indicator showing the relationship between two Moving Averages. To calculate the PPO, subtract the 26-day Exponential Moving Average (EMA) from the nine-day EMA, and then divide this difference by the 26-day EMA. The end result is a percentage that tells the trader where the short-term average is relative to the longer-term average.
Percentage Price Oscillator Extended
The Percentage Price Oscillator Extended (PPO) is a technical Momentum indicator showing the relationship between two Moving Averages. To calculate the PPO, subtract the 26-day Exponential Moving Average (EMA) from the nine-day EMA, and then divide this difference by the 26-day EMA. The end result is a percentage that tells the trader where the short-term average is relative to the longer-term average.