Fan sayfamıza katılın
- Yayınlayan:
- Görüntülemeler:
- 21424
- Derecelendirme:
- Yayınlandı:
- Güncellendi:
-
 Alım-satım fırsatlarını kaçırıyorsunuz:
- Ücretsiz alım-satım uygulamaları
- İşlem kopyalama için 8.000'den fazla sinyal
- Finansal piyasaları keşfetmek için ekonomik haberler
Kayıt Giriş yapWeb sitesi politikasını ve kullanım şartlarını kabul edersiniz
Hesabınız yoksa, lütfen kaydolun -
 Bu koda dayalı bir robota veya göstergeye mi ihtiyacınız var? Freelance üzerinden sipariş edin
Freelance'e git
Bu koda dayalı bir robota veya göstergeye mi ihtiyacınız var? Freelance üzerinden sipariş edin
Freelance'e git

Real author:
TrendLaboratory
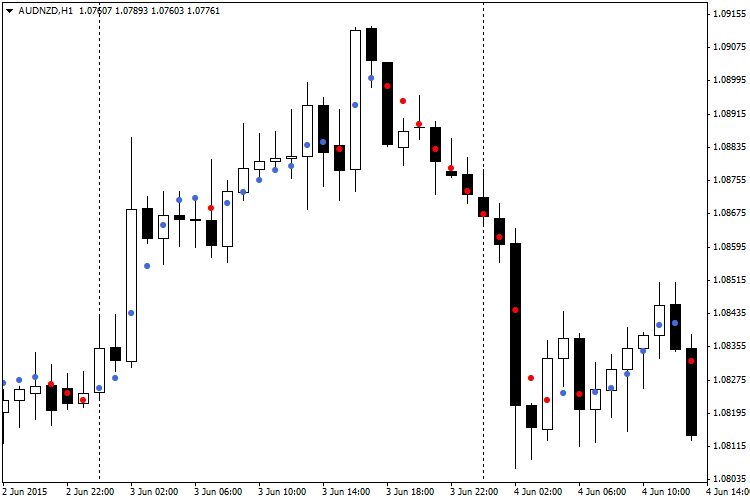
The Dots indicator is based on an indicator developed by TrendLaboratory in 2006. The indicator shows current trend direction by placing colored dots on the main chart. Blue dots indicate an uptrend, red dots indicate a downtrend.
Although the indicator calculation is not based on standard MetaTrader platform indicators, it uses the iMA (Moving Average) function to get prices of a specified type (Open, Close, Maximum, Minimum, Typical etc.). The calculation is based on cosine of a price change angle. The user can set several input parameters.
Input Parameters:
- Length (by default = 10) — indicator period. The higher this value, the higher the time lag, and the fewer false signals are displayed.
- AppliedPrice (by default = PRICE_CLOSE) — price type to use in calculations.
- Filter (by default = 0) — useful parameter allowing to filter price surges without adding display lags.
- Deviation (by default = 0) — vertical indicator shift.
- Shift (by default = 0) — horizontal indicator shift.
Recommendations:
- Recommended strategy is to wait for 2 identical dots and open positions by trend. Unfortunately, sometimes it fails. A suitable alternative would be to use one dot as a signal with Filter parameter set as Spread x 3.
MetaQuotes Ltd tarafından Rusçadan çevrilmiştir.
Orijinal kod: https://www.mql5.com/ru/code/13179
 WRB
WRB
The indicator detects and marks the WRB (Wide Range Bars) or candlesticks with Wide Range Bodies.
Divergence Petr
The indicator of divergences on 30 oscillators of choice.
Easy Trend Visualizer
A simple visualizer of trends.
GainLossInfo
Shows the current gain and loss for the candlesticks on the chart.