
Thomas DeMark's contribution to technical analysis
Introduction
It has been argued that technical analysis is both science and art. The reason behind this duality lies in individual points of view of various traders and analysts. For example, the exact same trend line can be drawn completely differently. Such uncertainty is frowned upon in commodities trading where accuracy is the key. Any trader who ever attempted to generate a trend line and discovered that there are few ways to do it, has encountered this problem. Such disorder doesn't contribute to the creation of accurate trading systems that could analyze markets with trend lines. There are some other problems caused by this multiplicity: discrepancy when searching for a local extremum, divergence and convergence based on a trend line that wasn't properly constructed etc.
But not all have accepted such overly flexible approach to technical analysis. For example, Thomas DeMark managed to find an analytical approach to this issue and suggested ways of solving it. In his book called "The New Science of Technical Analysis" he described his methods of a more accurate analysis of a current price situation. In this article, I will tell you about his two findings — TD points and TD lines. By all means, this is not the only subject of the Thomas DeMark's book: he also covers market periodicity, the Elliott Wave Principe and many more.
This article also presents and explains the process of writing three indicators and two Expert Advisors created on the basis of Thomas DeMark's ideas. I believe this article will appeal to many traders, in particular to Forex newbies.
1. TD points
The first invention of Thomas DeMark simplifies the process of finding price extremums for building trend lines. He decided to use a daily chart to find candlesticks whose maximum prices would be higher than maximums of a day before and a day after a defined day (I will be using this word to refer to a candlestick used to determine the presence of a TD point). If this condition is met, then a TD point can be built on a chart based on a maximum price of a defined candlestick. Accordingly, if a minimum of a defined day is lower than a minimum of a previous and following days, then a TD point can be build on a defined candlestick based on a minimal price.
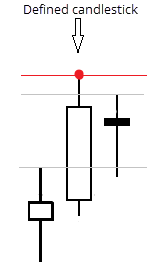

Fig. 1. Bullish and bearish TD points
The first figure above shows a level 1 TD point (it is marked red). As seen, maximum of the defined candle is greater than maximum of the previous and the following candlesticks. Values of maximums appear in the figure as gray horizontal lines. The second figure shows a similar case but with a bearish TD point. Rules are met the same way: minimum of the defined candle is lower than minimum of the previous and the following candlesticks.
Only level 1 TD points were considered above. This means that the price of a defined candlestick is compared only with one before and one after it. If it's required to build a level 2 TD point, then the maximum price of a defined candlestick must be compared with two previous and two following candles. Similarly, the same applies for minimum prices.
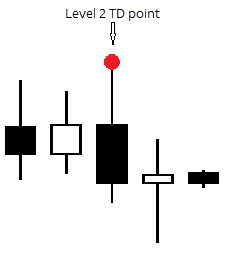
Fig. 2. Example of level 2 TD point
The figure above shows the level 2 TD point. The maximum price of the defined candle is noticeably higher than two maximum prices of candlesticks before and two candlesticks after it.
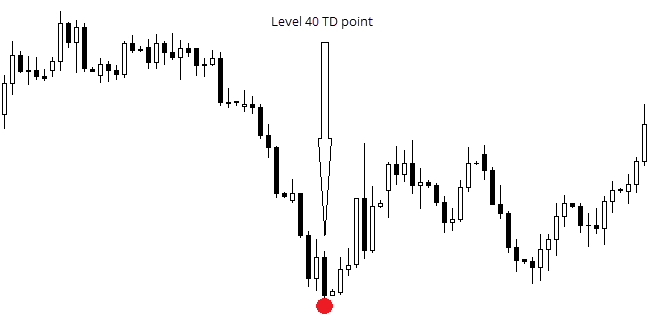
Fig. 3. Level 40 TD point.
There may be more than two levels of TD points, depending on the amount of maximum and minimum values that should be compared against a defined candlestick. It is only logical that a level 3 TD point, for example, is simultaneously a point for lower levels — second and first. In his book, Thomas DeMark covers points up to level 3.
It is worth noting that the indicator operating on such principle already exists for a long time. Indeed, Bill Williams' fractals are nothing less than level 2 TD points. I recall that they are built if minimum 2 candlesticks before and 2 candlesticks after a defined candle have lower maximums and higher minimums, which entirely matches the definition of level 2 TD points.
2. TD lines
TD points alone are simply extremums. We will need two points (2 maximums or 2 minimums) to build a trend line. At the same time, Thomas DeMark have used only two last points as the most significant ones.


Fig. 4. Level 1 TD Lines/ level 2 TD lines.
The figure on the left shows two level 2 TD lines (blue line — minimums, green line — maximums). A line level refers to a level of points used to build this line. The figure on the right shows level 3 TD lines.
Thomas DeMark has also developed 3 price projectors that are directly linked to TD lines, and I will touch this subject briefly in the "Additional information" section.
3. Creating indicators
3.1. iTDDots
It would be quite exhausting to build new points and lines for every new candlestick manually. I believe that if something can be automated without effecting the quality, then it should be done. The process of creating an indicator that builds TD points will be described below. In this example we are operating with the MQL4 language.
First, the indicator's plan was finalized. The current candlestick is not considered in the indicator's operation since its maximums and minimums can be changed leading to wrongly constructed points. Therefore, only previous candlesticks are considered.
A plan for indicator operation:
- Build all TD points on the existing history when adding it on a chart. Their level is set up by a user.
- Check each new candlestick for a possibility of building a new point, and proceed further, if it appears.
Main task of the indicator is to determine a candle whose extremum is higher than relevant n extremums of adjacent candlesticks. That is why I suggest writing a function that will determine maximum and minimum candlestick prices in a range that I require. In order to determine how many candlesticks should be checked each time, I multiple the level of points by 2 and add 1 to the result.
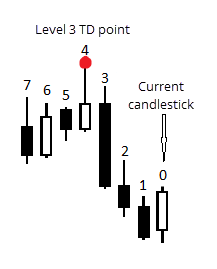
Fig. 5. Candlesticks used in the indicator
The figure above shows an example of how candlesticks calculated by the indicator are numbered. It clearly demonstrates the method of their amount calculation.
Now I will show you how the code was developed.
The indicator must have two buffers to display points, since one candlestick can be with both TD points built on maximum and minimum at the same time. So, this is how the program starts:
#property indicator_chart_window        //To display indicator in the chart window
#property indicator_buffers 2           //2 buffers are used
#property indicator_plots   2           //2 buffers will be displayed
#property indicator_color1 clrGreen     //Standard color of the first buffer
#property indicator_type1   DRAW_ARROW  //Type of drawing the first buffer
#property indicator_width1 2            //Standard line thickness for displaying the first buffer
#property indicator_color2 clrBlue      //Standard color of the second buffer
#property indicator_type2   DRAW_ARROW  //Type of drawing the second buffer
#property indicator_width2 2            //Standard line thickness for displaying the second buffer
A user must determine a level of creating TD points for the indicator when adding it to the chart:
input int Level = 1;
The following variables declared as global are used for the indicator operation:
bool new_candle = true;
double  pdH,                    //For maximum price of a defined candlestick
        pdL,                    //For minimum price of a defined candlestick
        pricesH[],              //Array for storing maximum prices
        pricesL[];              //Array for storing minimal prices
bool    DOTH,                   //To display a point (based on maximum)
        DOTL;                   //To display a point (based on minimum)
double  UpDot[],                //Buffer's array for points drawn based on maximums
        DownDot[];              //Buffer's array for points drawn based on minimums
The Init() function is provided below:
int OnInit()
  {
   ChartRedraw(0);                              //Required to prevent issues with displaying when switching time frames
   SetIndexBuffer(0, UpDot);
   SetIndexBuffer(1, DownDot);
   SetIndexEmptyValue(0,0.0);
   SetIndexEmptyValue(1,0.0);
   SetIndexArrow(0,159);                        //Set symbol number from Wingdings font
   SetIndexArrow(1,159);
   SetIndexLabel(0, "TD " + Level + " High");   //These names will be displayed in the data window
   SetIndexLabel(1, "TD " + Level + " Low");
   return(INIT_SUCCEEDED);
  }
To obtain prices of required candlesticks, I have created a function that you can see below:
void GetVariables(int start_candle, int level)
  {
   /*In this function, the indicator collects information from candlesticks to build a point. All variables used here are already declared as global*/
   pdH = iHigh(NULL, 0, start_candle + 1 + level);      //High of defined candle
   pdL = iLow(NULL, 0, start_candle + 1 + level);       //Low of defined candle

   ArrayResize(pricesH, level * 2 + 1);                 //Set array sizes
   ArrayResize(pricesL, level * 2 + 1);                 //

   for (int i = level * 2; i >= 0; i--){                //Collect all prices (maximums and minimums) of the required candles in arrays
      pricesH[i] = iHigh(NULL, 0, start_candle + i + 1);
      pricesL[i] = iLow(NULL, 0, start_candle + i + 1);
  }
And, finally, the most interesting — the code of the start() function:
int start()
  {
   int i = Bars - IndicatorCounted();                   //Required to avoid counting the same every time a new candlestick appears
   for (; i >= 0; i--)
     {                                                  //All activities related to building TD points take place here
      DOTH = true;
      DOTL = true;
      GetVariables(i, Level);                           //Obtain current price values

      for(int ii = 0; ii < ArraySize(pricesH); ii++)
        {                                              //Determine if there is a TD point in this interval
         if (pdH < pricesH[ii]) DOTH = false;
         if (pdL > pricesL[ii]) DOTL = false;
        }

      if(DOTH) UpDot[i + Level + 1] = pdH;              //If so, then its construction is as follows
      if(DOTL) DownDot[i + Level + 1] = pdL;

      if(UpDot[i + Level + 1] ==  UpDot[i + Level + 2]) UpDot[i + Level + 2] = 0;       //Here I cover a case where two candlesticks
      if(DownDot[i + Level + 1] ==  DownDot[i + Level + 2]) DownDot[i + Level + 2] = 0; //consequently have the same minimum and maximum prices, and build a TD point
     }                                                                                  //on the last candlestick pair
   return(0);
  }
So, we got acquainted with a course of writing the indicator for creating TD points. Two charts with a set TDDots indicator are shown below. The first chart has Level = 1, and the second chart — Level = 10. It means that all TD points on the first chart are surrounded with, at least, one candlestick with lower maximums or higher minimums, and 10 such candles on the second chart. These charts are provided to demonstrate, how the indicator operates.
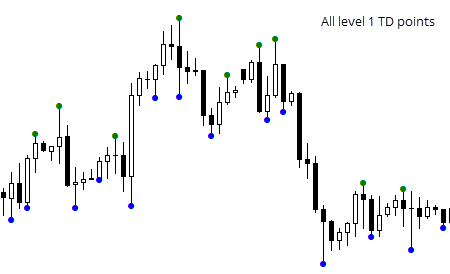

Fig. 6. Example of the indicator operation: creating level 1 TD points and level 10 TD points.
3.2. iTDLines
As I have stated previously, Thomas DeMarke used only two last points for drawing a TD line. I will automate this approach in my indicator. The indicator's goal is to build two straight lines through the set points. The question is how to build them. Certainly, you can use a linear function of type: y = kx + b. Coefficients k and b must be selected, so the line would pass strictly through the set points.
Coordinates of two points should be known in order to build a straight line through them. Using the formulas below, we will find k and b for a linear function. With x we mark the number of candlesticks from the right side of the chart, and with y — prices.
b = (x2 * y1 - x1 * y2) / (x2 - x1),
where x1 - candlestick number with a first point,
x2 - candlestick number with a second point,
y1 - price of a first point,
y2 - price of a second point.
Knowing k and b, it remains to solve a simple linear equation on every candlestick to obtain the point's price located on the TD line.
The indicator's code is provided below:
#property indicator_chart_window
#property indicator_buffers 2
#property indicator_plots 2

#property indicator_color1 clrGreen
#property indicator_color2 clrBlue

input int Level = 1;

double LU[], LD[];

//This variable will be used to minimize calculations.
datetime LastCount;
One variable, which is a value of the points' level for building lines, is used in the indicator. It is set by a user, the same way as with TDDots. This is followed by two arrays that will contain price values of all points of the lines. The LastCount variable will be used for the indicator to conduct calculations on each candlestick just once.
A function that instantly finds k and b values for each line is presented further. It will be described partially:
void GetBK(double &Ub, double &Uk, double &Db, double &Dk, int &EndUN, int &EndDN)
  {
   double TDU[];
   double TDD[];
   int TDU_n[];
   int TDD_n[];
   ArrayResize(TDU, 2, 2);
   ArrayResize(TDD, 2, 2);
   ArrayResize(TDU_n, 2, 2);
   ArrayResize(TDD_n, 2, 2);
The function returns six values. While the assignment of the first four variables is clear, the last two variables appear more complex. We will find them useful for displaying lines. Each of them indicates the length of the line in candlesticks, starting from the current one.
//Receive values of points' prices and number of candlesticks from the beginning
   int Ui = 0;
   int Di = 0;
   for(int i = 0;; i++)
     {
      double current_bar_U = iCustom(NULL, 0, "TDDots", Level, 0, i);
      double current_bar_D = iCustom(NULL, 0, "TDDots", Level, 1, i);

      if(current_bar_U > 0 && Ui < 2)
        {
         TDU[Ui] = current_bar_U;   //Price
         TDU_n[Ui] = i;             //Number
         Ui++;
        }
      if(current_bar_D > 0 && Di < 2)
        {
         TDD[Di] = current_bar_D;
         TDD_n[Di] = i;
         Di++;
        }
      if(Ui == 2 && Di == 2) break;
     }
This part of the code receives values of two last TD points. Prices are saved in arrays to operate with them in the future.
   Ub = ( (TDU_n[0] * TDU[1]) - (TDU[0] * TDU_n[1]) ) / ( TDU_n[0] - TDU_n[1] );
   Uk = (TDU[0] - TDU[1]) / (TDU_n[0] - TDU_n[1]);

   Db = ( (TDD_n[0] * TDD[1]) - (TDD_n[1] * TDD[0]) ) / ( TDD_n[0] - TDD_n[1] );
   Dk = (TDD[0] - TDD[1]) / (TDD_n[0] - TDD_n[1]);

   EndUN = TDU_n[1];
   EndDN = TDD_n[1];
  }
Since candlesticks are numbered as in time series (from right to left), the opposite values of points should be used. In other words, x2 should be replaced with x1, and x1 with x2 etc in the above mentioned formulas. This is how it will look:
b = (x1 * y2 - x2 * y1) / (x1 - x2),
k = (y1 - y2) / (x1 - x2),
where x1 - candlestick number with a first point,
x2 - candlestick number with a second point,
y1 - price of a first point,
y2 - price of a second point.
It is followed by OnInit() function:
int OnInit()
  {
   SetIndexBuffer(0, LU);
   SetIndexLabel(0, "TDLU");
   SetIndexBuffer(1, LD);
   SetIndexLabel(1, "TDLD");

   SetIndexEmptyValue(0, 0);
   SetIndexEmptyValue(1, 0);

   LastCount = iTime(NULL, 0, 1);

   return(INIT_SUCCEEDED);
  }
Buffers are initialized and named in this function. Also, in order for the indicator to calculate the lines' location at the first tick of new data, data from the previous candlestick is written in the LastCount variable. In fact, any data, apart from the current one, can be written there.
Then, we will write the start() function:
int start()
  {
   //New candle or first launch
   if(iTime(NULL, 0, 0) != LastCount)
     {
      double Ub, Uk, Db, Dk;
      int eUp, eDp;

      GetBK(Ub, Uk, Db, Dk, eUp, eDp);

      //Remove old values
      for(int i = 0; i < IndicatorCounted(); i++)
        {
         LU[i] = 0;
         LD[i] = 0;
        }

      //Build new values
      for(i = 0; i <= eUp; i++)
        {
         LU[i] = Uk * i + Ub;
        }

      for(i = 0; i <= eDp; i++)
        {
         LD[i] = Dk * i + Db;
        }

      LastCount = iTime(NULL, 0, 0);
     }

   return 0;
  }
It is required to clear the chart from old values prior to drawing new values. Therefore, a separate loop is implemented in the beginning of the function. Now, according to the equation above, two lines are being built, and the LastCount variable is assigned the current date to avoid performing these operations again on the current candlestick.
As a result, the indicator operates accordingly:

Fig. 7. Example of the indicator operation: building TD lines based on level 5 TD points.
It is not hard to understand that fig. 7 shows the indicator's operation with the Level = 5 variable value.
3.3 Horizontal line indicator
Certainly, there is a number of ways to determine prices of horizontal levels on the chart. I suggest a simple way of building two levels regarding the current price. iTDDots that we have written already will be used in the indicator operation (see. p. 3.1).
The point is simple:
- The indicator obtains n number values of TD points of a certain level set by a user
- Average price value of these points is calculated
- Horizontal line is displayed on the chart based on it
However, there are cases when TD points are positioned far from the last point, which seriously distances the horizontal level from the current price. A variable that reduces distance between points, introduced by a user, was implemented for solving this problem. It means that the indicator finds an average value between the last n extremums that are distanced from one another for no more than a certain number of points.
Let's have a look at the indicator's code.
Values of 2 buffers and 3 variables, that a user should enter, are used:
#property indicator_chart_window
#property indicator_buffers 2
#property indicator_plots   2
#property indicator_color1 clrGreen
#property indicator_type1   DRAW_LINE
#property indicator_width1 2
#property indicator_color2 clrBlue
#property indicator_type2   DRAW_LINE
#property indicator_width2 2

input int TDLevel = 1;       //Level of points
input int NumberOfDots = 3;  //Number of points
input double Delta = 0.001;  //Maximum distance between two points

double TDLU[], TDLD[];
Two horizontal lines are created in this indicator. Since they may hold value at the long term analysis (other than trend lines in the TDLines indicator), I've decided to use graphic objects, such as horizontal lines, for their creation. However, it will be much easier to use this indicator in the future, if values of horizontal levels will be stored in the indicator buffers. I've decided to store these values on the current candlestick with 0 index, so I could always have a simple way of obtaining the price level value by addressing iCustom from another program.
int OnInit()
  {
   SetIndexBuffer(0,TDLU);
   SetIndexBuffer(1,TDLD);
   SetIndexEmptyValue(0,0.0);
   SetIndexEmptyValue(1,0.0);
   SetIndexLabel(0, "U HL");
   SetIndexLabel(1, "D HL");
   ObjectCreate(0, "U horizontal level", OBJ_HLINE, 0, iTime(NULL, 0, 0), 0);
   ObjectCreate(0, "D" horizontal level, OBJ_HLINE, 0, iTime(NULL, 0, 0), 0);
   return(INIT_SUCCEEDED);
  }
A function that calculates a price of a specific horizontal level is presented below.
double GetLevelPrice(int ud,int n,double delta,int level)
  {
   /* ud - indicator of the line type. 0 - U, other value - D.
   n - number of points.
   delta - maximum distance between them
   level - level of points.*/

   //Arrays for storing points' prices are prepared
   double TDU[];
   double TDD[];
   ArrayResize(TDU,n,n);
   ArrayResize(TDD,n,n);
   ArrayInitialize(TDU,0);
   ArrayInitialize(TDD,0);

   //Loop operates twice, because only 2 data buffers exist
   for(int Buffer=0; Buffer<2; Buffer++)
     {
      int N=0;
      int Fails=0;
      bool r=false;
      for(int i=0; r==false; i++)
        {
         double d=iCustom(NULL,0,"TDDots",level,Buffer,i);
         if(d>0)
           {
            if(N>0)
              {
               if(Buffer==0) double cp=TDU[N-1];
               else cp=TDD[N-1];
               if(MathAbs(d-cp)<=delta)
                 {
                  if(Buffer == 0)
                     TDU[N] = d;
                  else TDD[N]=d;
                  N++;
                 }
               //If distance is too long, then 1 is added to error
               else
                 {
                  Fails++;
                 }
              }
            else
              {
               if(Buffer == 0)
                  TDU[N] = d;
               else TDD[N]=d;

               N++;
              }
           }
         //If there are many errors, the loop terminates
         if(Fails>2 || N>n) r=true;
        }
     }

   //Obtain average value
   double ATDU = 0;
   double ATDD = 0;
   N=0;
   for(i=0; i<ArraySize(TDU); i++)
     {
      ATDU=ATDU+TDU[i];
      if(TDU[i]==0)
        {
         i=ArraySize(TDU);
        }
      else
        {
         N++;
        }
     }
   ATDU=ATDU/N;
   N=0;
   for(i=0; i<ArraySize(TDD); i++)
     {
      ATDD=ATDD+TDD[i];
      if(TDD[i]==0)
        {
         i=ArraySize(TDD);
        }
      else
        {
         N++;
        }
     }
   ATDD=ATDD/N;

   //The function returns value
   if(ud == 0) return ATDU;
   else return ATDD;
  }
It simply remains to obtain price values and assign them to already created objects in the function called at every new tick:
void start()
  {
   //I remove values of indicator buffers on the previous candlestick
   TDLD[1] = 0;
   TDLU[1] = 0;

   TDLD[0] = GetLevelPrice(1, TDLevel, Delta, NumberOfDots);
   TDLU[0] = GetLevelPrice(0, TDLevel, Delta, NumberOfDots);

   //If objects somehow disappeared
   if(ObjectFind("U horizontal level") < 0)
     {
      ObjectCreate(0, "U horizontal level", OBJ_HLINE, 0, iTime(NULL, 0, 0), 0);
     }
   if(ObjectFind("D horizontal level") < 0)
     {
      ObjectCreate(0, "D" horizontal level, OBJ_HLINE, 0, iTime(NULL, 0, 0), 0);
     }

   ObjectSetDouble(0, "U horizontal level", OBJPROP_PRICE, TDLU[0]);
   ObjectSetDouble(0, "D horizontal level", OBJPROP_PRICE, TDLD[0]);
  }
For the convenience of use, after deleting the indicator objects should be deleted also:
void OnDeinit(const int reason)
  {
   if(!ObjectDelete("U horizontal level")) Print(GetLastError());
   if(!ObjectDelete("D horizontal level")) Print(GetLastError());
  }
Eventually, the created indicator provides a simple way of building horizontal lines automatically based on the user set parameters.

Fig. 8. Example of indicator operation.
4. Expert Advisor for trading by means of the horizontal line indicator
Any indicator should be used for gaining profit, preferably automatically, if such opportunity exists. Clearly, the Expert Advisor described in this article won't be able to bring profit anytime and on any market, but the goal behind its creation is different. It was written to demonstrate opportunities of indicators in action, as well as to show the Expert Advisor's structure in general.
It will get more specific now. Using the horizontal line indicator, we can write an Expert Advisor that will trade based on the signals mentioned below.
Buy conditions:
- The price broke through the upper horizontal level
- The price increased by n points from the price value of the upper horizontal level
Sell conditions are mirrored:
- The price broke through the lower horizontal level
- The price decreased by n points from the price value of the lower horizontal level
Otherwise, this can be shown in figures:
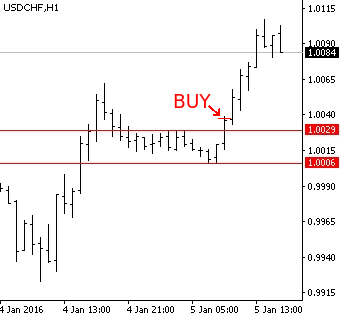
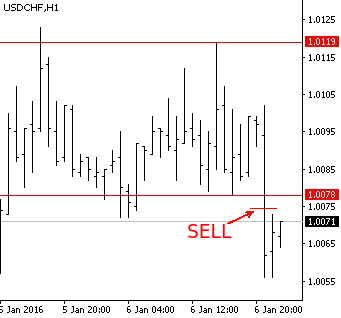
Fig. 9. Buy and sell conditions
The Expert Advisor will open only one order and accompany it with a Trailing Stop, i.e. it will shift Stop Loss by the number of points set by a user at its launch.
Making an exit will be performed solely with a Stop Loss.
Let's look at the Expert Advisor's code developed in the MQL4 language.
First, we will describe variables, whose values are set by a user prior to running the program.
input int MagicNumber = 88341;      //The Expert Advisor will open orders with this Magic Number
input int GL_TDLevel = 1;           //Level of TD points used by the horizontal level indicator
input int GL_NumberOfDots = 3;      //Number of points used by the horizontal level indicator
input double S_ExtraPoints = 0.0001;//Number of additional points that are L supplements from the figures above
input double GL_Delta = 0.001;      //Distance where values of TD points are considered by the horizontal level indicator
input int StopLoss = 50;            //Stop Loss level
input double Lot = 0.01;            //Lot size
The next function checks if the TD line was crossed. To avoid getting a position opening signal every time when a current price crosses a line built by the iglevels indicator, we check whether in case of an upside breakout the high of the previous candle is lower than the upper level in case of an downside breakout the low of the previous candle is higher than the lower level. This way, an opportunity of obtaining the signal exclusively on one candlestick is achieved. The code of this function is presented further:
int GetSignal(string symbol,int TF,int TDLevel,int NumberOfDots,int Delta,double ExtraPoints)
  {
//Price value of the level built on the upper TD points
   double UL=iCustom(symbol,TF,"iglevels",GL_TDLevel,GL_NumberOfDots,GL_Delta,0,0)+ExtraPoints;
//...on the lower TD points
   double DL=iCustom(symbol,TF,"iglevels",GL_TDLevel,GL_NumberOfDots,GL_Delta,1,0)-ExtraPoints;

   if(Bid<DL && iLow(symbol,TF,1)>DL)
     {
      return 1;
     }
   else
     {
      if(Ask>UL && iHigh(symbol,TF,1)<UL)
        {
         return 0;
        }
      else
        {
         return -1;
        }
     }
  }
The following variables must be declared globally for the operation of the Expert Advisor:
int Signal = -1;          //Current signal
datetime LastOrder;       //Date of the last executed trade. It is required to avoid cases of opening multiple orders on one candlestick.
The Init() function should assign any recent date to the LastOrder variable for opening a new order.
int OnInit()
  {
   LastOrder = iTime(NULL, 0, 1);
   return(INIT_SUCCEEDED);
  }
The OnTick function for most important activity is shown below:
void OnTick()
  {
   bool order_is_open=false;
//Search for an open order
   for(int i=0; i<OrdersTotal(); i++)
     {
      if(!OrderSelect(i,SELECT_BY_POS)) Print(GetLastError());

      if(OrderMagicNumber()==MagicNumber)
        {
         order_is_open=true;
         break;
        }
     }

//Obtain current signal
   Signal=GetSignal(Symbol(),0,GL_TDLevel,GL_NumberOfDots,GL_Delta,S_ExtraPoints);

//Calculation of Stop Loss size
   double tsl=NormalizeDouble(StopLoss*MathPow(10,-Digits),Digits);


   if(order_is_open==true)
     {
      //Calculation of Stop Loss price
      double p=NormalizeDouble(Ask-tsl,Digits);
      if(OrderType()==1) p=NormalizeDouble(Ask+tsl,Digits);

      if(OrderType()==0 && OrderStopLoss()<p)
        {
         if(!OrderModify(OrderTicket(),OrderOpenPrice(),p,0,0)) Print(GetLastError());
        }
      if(OrderType()==1 && OrderStopLoss()>p)
        {
         if(!OrderModify(OrderTicket(),OrderOpenPrice(),p,0,0)) Print(GetLastError());
        }
     }
//If there are no orders
   if(order_is_open==false)
     {
      //If orders haven't opened on the current candlestick
      if(iTime(NULL,0,0)!=LastOrder)
        {
         //Buy
         if(Signal==0)
           {
            if(!OrderSend(NULL,0,Lot,Ask,5,Ask-tsl,0,NULL,MagicNumber)) Print(GetLastError());
            LastOrder=iTime(NULL,0,0);
           }
         //Sell
         if(Signal==1)
           {
            if(!OrderSend(NULL,1,Lot,Bid,5,Ask+tsl,0,NULL,MagicNumber)) Print(GetLastError());
            LastOrder=iTime(NULL,0,0);
           }
        }
     }
  }
It is used for checking the existence of an open order, and if there is one, then the Expert Advisor checks for a possibility to transfer a Stop Loss. If there is no order yet, then it operates according to a signal obtained by the GetSignal function. Important: if you are planning to compare two real numbers in your program, use the NormalizeDouble function beforehand, otherwise you risk to obtain completely illogical comparison results.
The Expert Advisor operates accordingly:
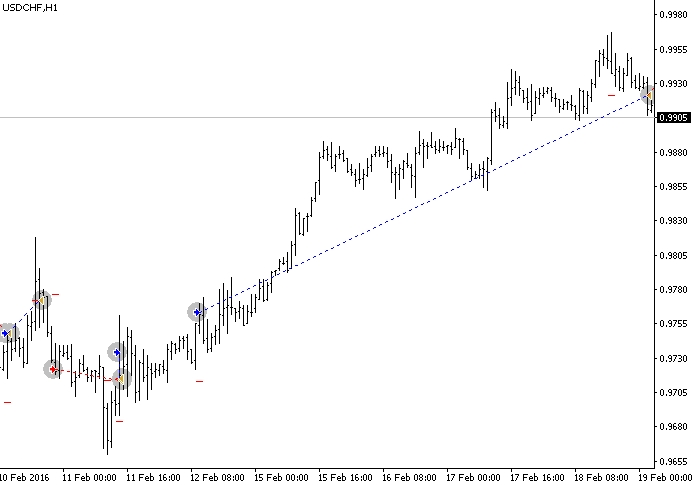
Fig.10. Example of Expert Advisor's operation in the strategy tester
Fig. 10 shows that it gives both loss-making and profitable positions. Profits exceed losses, because as per set conditions losses are limited and profitable trades are accompanied with a TrailingStop. EA can show both good and disappointing results. However, we need to remember that it was created not for real trading, but for demonstrating opportunities of applying TD points and indicators created based on them in practice. Our Expert Advisor is able to handle this task.
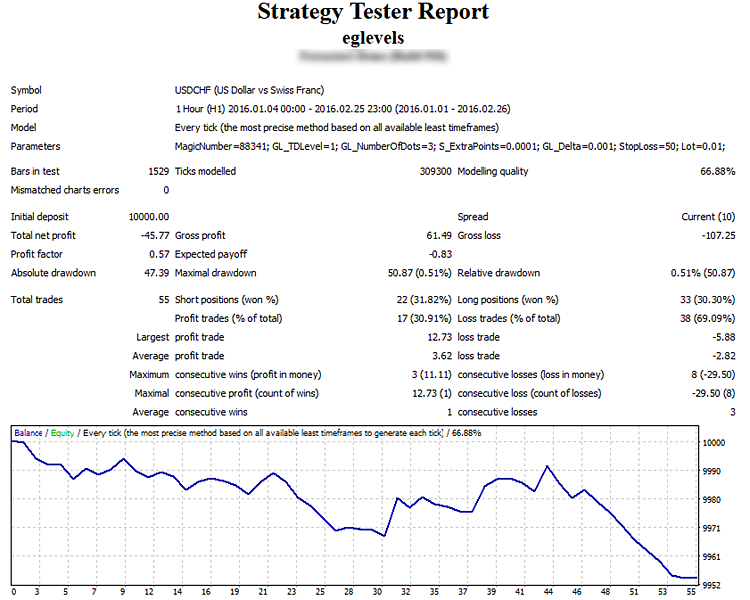
Fig.11. Testing result
This Expert Advisor can be improved by adding partial position closing in achieving a certain profit in order to avoid getting minus at the trend correction, as it sometimes happens. In that case, the position would have closed without any loss or profit, contributing to the capital preservation. It's also fair to note that the Stop Loss size must change depending on the activity of a price movement.
5. Expert Advisor for trading on TD lines
This Expert Advisor is an example of using TD lines in the creation of trading systems. Generally, TD lines are trend lines. It means that if a price crosses a TD line and proceeds moving in the same direction, then the trend may change.
The Expert Advisor trades only two signals:
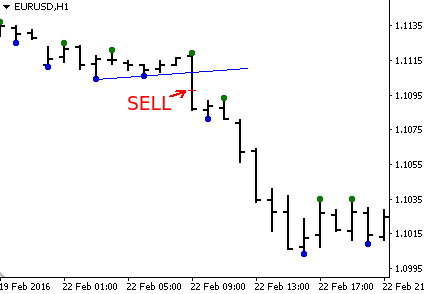
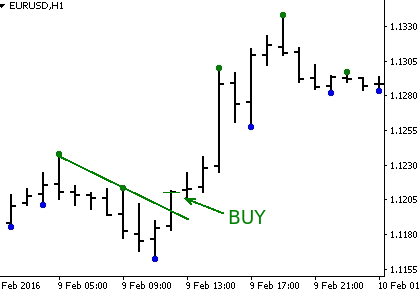
Fig.12. Signals used by etdlines for trading
A buy position is opened if a bullish TD line was broken through above, and the price passed few more points (set by a user) in the same direction. Furthermore, a TD line should be positioned downwards, i.e. the smallest value of the line's price should correspond to a candlestick with a later date.
A symmetrical sell position is opened if a bearish TD line was broken through below, and the price decreased additionally by few points. The TD line is directed upwards.
The position is accompanied with a fixed size Trailing Stop. The position closure is performed only by a Stop Loss.
Below you will find a code that describes variables entered by a user:
input int Level=1;                 //Level of TD lines
input double Lot=0.01;             //Lot size
input int AddPips=3;               //Additional number of points
input int Magic=88342;             //Magical number of orders
input int Stop=50;                 //Size of Stop Loss in points
input int Bars_To_Open_New_Order=2;//Interval in bars until opening a new order

datetime LastBar;
datetime Trade_is_allowed;
A delay between closing an old order and opening a new order is used in this Expert Advisor. This prevents positions from opening too frequently.
The Expert Advisor assigns values to the LastBar and Trade_is_allowed variables in the OnInit function:
int OnInit()
  {
   LastBar=iTime(NULL,0,1);
   Trade_is_allowed=iTime(NULL,0,0);

   return(INIT_SUCCEEDED);
  }
The next function GetSignal returns a trading signal:
int GetSignal()
  {
//If a new candlestick
   if(LastBar!=iTime(NULL,0,0))
     {
      double DU = iCustom(NULL, 0, "itdlines", Level, 0, 0);
      double DD = iCustom(NULL, 0, "itdlines", Level, 1, 0);
      double DU1 = iCustom(NULL, 0, "itdlines", Level, 0, 1);
      double DD1 = iCustom(NULL, 0, "itdlines", Level, 1, 1);
     }

   double add_pips=NormalizeDouble(AddPips*MathPow(10,-Digits),Digits);

//U line breakthrough --> buy
   if(Ask>DU+add_pips && iLow(NULL,0,0)<Ask && DU<DU1)
     {
      return 0;
     }
   else
     {
      //D line breakthrough --> sell
      if(Bid<DD-add_pips && iHigh(NULL,0,0)>Bid && DD>DD1)
        {
         return 1;
        }
      //No breakthrough --> signal is missing
      else
        {
         return -1;
        }
     }

   return -1;
  }
The LastBar variable is used to determine a new candlestick. This is needed to avoid calculating two last points of the TD line with every new tick, since they are calculated just once, when a new candlestick appears. The function returns: 0 — buy, 1 — sell, -1 — no signal.
Finally, the OnTick function, where all operations with orders take place:
void OnTick()
  {
   int signal=GetSignal();
   bool order_is_open=false;

//Searching for an open order
   for(int i=0; i<OrdersTotal(); i++)
     {
      if(!OrderSelect(i,SELECT_BY_POS)) Print(GetLastError());

      //By magical number value
      if(OrderMagicNumber()==Magic)
        {
         order_is_open=true;
         i=OrdersTotal();
        }
     }

//Stop Loss size
   double stop=Stop*MathPow(10,-Digits);
//If order is already open
   if(order_is_open==true)
     {
      //Checking the ability to transfer Stop Loss

      //Value of Stop Loss price
      double order_stop=NormalizeDouble(OrderStopLoss(),Digits);

      //If buy order
      if(OrderType()==0)
        {
         if(order_stop<NormalizeDouble(Ask-stop,Digits))
           {
            if(!OrderModify(OrderTicket(),OrderOpenPrice(),NormalizeDouble(Ask-stop,Digits),0,0))Print(GetLastError());
           }
        }
      //If sell order
      if(OrderType()==1)
        {
         if(order_stop>NormalizeDouble(Bid+stop,Digits))
           {
            if(!OrderModify(OrderTicket(),OrderOpenPrice(),NormalizeDouble(Bid+stop,Digits),0,0))Print(GetLastError());
           }
        }
      Trade_is_allowed=iTime(NULL,0,0)+ChartPeriod(0)*60*Bars_To_Open_New_Order;
     }
//If there is no open order yet
   else
     {
      if(signal>=0 && iTime(NULL,0,0)>Trade_is_allowed)
        {
         if(signal==0)
           {
            if(!OrderSend(NULL,signal,Lot,Ask,5,Ask-stop,0,NULL,Magic)) Print(GetLastError());
           }
         if(signal==1)
           {
            if(!OrderSend(NULL,signal,Lot,Bid,5,Bid+stop,0,NULL,Magic)) Print(GetLastError());
           }

        }
     }
  }
First, the signal is calculated, the order is searched with the for loop, whose magic number equals the number set by a user (with consideration that there won't be any matches with other systems). Then, if there's an order already, the opportunity to transfer a Stop Loss is checked and performed upon such conditions. If there are no orders, then a new order can be opened according to the signal, but only on condition that data of the current candlestick is greater than data of the Trade_is_allowed variable (which changes its value with every new tick when there is an open order).
This Expert Advisor trades accordingly:

Fig.13. Example of operation of the etdlines Expert Advisor
It is visible that the Expert Advisor trades well on long price movements, however, sharp price movements create a certain number of false signals leading to unprofitable trades. The result of testing the Expert Advisor is provided below:
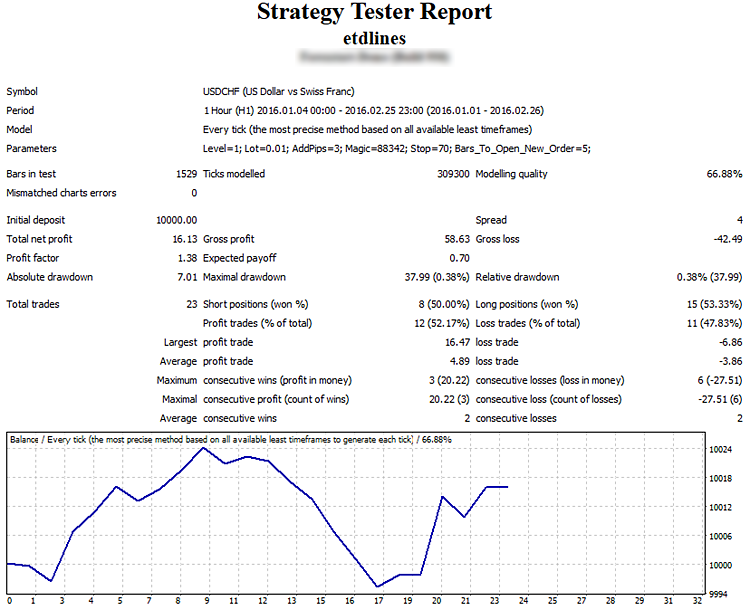
Fig.14. Result of testing etdlines
Conclusion
My goal was to describe TD points and TD lines developed by Thomas DeMark, and show the implementation of his developments in the MQL4 language. This article provides the example of creating 3 indicators and 2 Expert Advisors. We can see that DeMark's ideas are logically built into trading systems, and open great prospects of usage.
Translated from Russian by MetaQuotes Ltd.
Original article: https://www.mql5.com/ru/articles/1995
 Graphical Interfaces II: The Main Menu Element (Chapter 4)
 Universal Expert Advisor: Custom Strategies and Auxiliary Trade Classes (Part 3)
 Graphical Interfaces III: Simple and Multi-Functional Buttons (Chapter 1)
 Graphical Interfaces II: Setting Up the Event Handlers of the Library (Chapter 3)
- Free trading apps
- Over 8,000 signals for copying
- Economic news for exploring financial markets
You agree to website policy and terms of use
Fig. 4. Level 1 TD Lines/ level 2 TD lines.
The figure on the left shows two level 3 TD lines (blue line — minimums, green line — maximums). A line level refers to a level of points used to build this line. The figure on the right shows the level 2 TD lines.
2 errors here. Left is "level 2 TD lines" and right is "level 3 TD lines".
There is a typo on line 10 of "itddots.mq4" indicator. Need to remove the leading "s" to compile this file.