Abiroid ProfitPercent Arrows MA Confluence

5

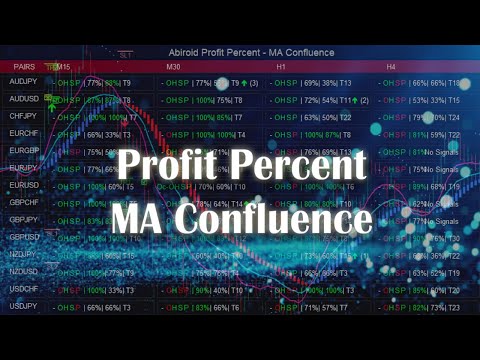
Profit Percent Series 2

The scanner dashboard available here (for Free):

And read detailed information about MA Confluence here:

https://www.mql5.com/en/blogs/post/747474


Here's a post about Common Settings for all Profit Percent Series Indicators:

https://www.mql5.com/en/blogs/post/747456


Strategy:

Main Signal Indicators (Any One): MA Cross (In-built) or Hull, OBV Cross, Heiken Ashi Cross

Validation Indicators (Preferably less than 3): OBV (with Min Distance), Heiken Ashi, ADX, SuperTrend, PSAR, Higher TimeFrame EMA Alignment

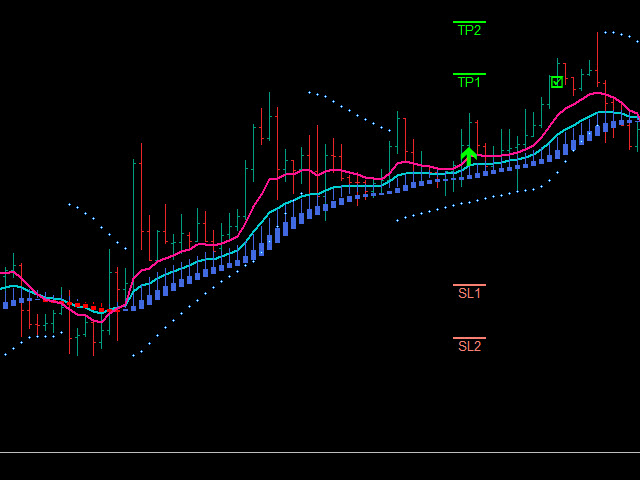
Main Signal will first generate a BUY/SELL Signal when:

If MA Cross True:

- BUY: Fast MA crosses Slow MA upwards
- SELL: Fast MA Crosses Slow MA Downwards

    If OBV Cross True:

    -  BUY: OBV Crosses OBV-MA upwards
    -  SELL: OBV Crosses OBV-MA downwards

      If Heiken True:

      -  BUY: Heiken Changes from Bearish to Bullish
      -  SELL: Heiken Changes from Bullish to Bearish

        If MA Cross is true and OBV Cross and Heiken are also True, it will only use MA Cross as Main Signal. While OBV and Heiken will be used as Validating Signals.

        There can be only 1 Main Signal which will generate the BUY/SELL Arrows. All other indicators will be used for validation only.


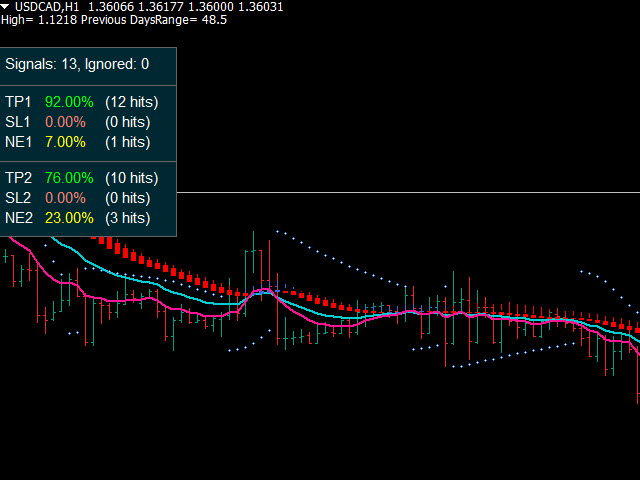
        Once a BUY/SELL Signal is generated, it will check all validating indicators and see if they also indicate a BUY/SELL.

        If they don't validate, then signal is ignored. Or else if everything is in Confluence then you will get a BUY or SELL Arrow and SL and TP lines will be generated.

        All Signal Settings:

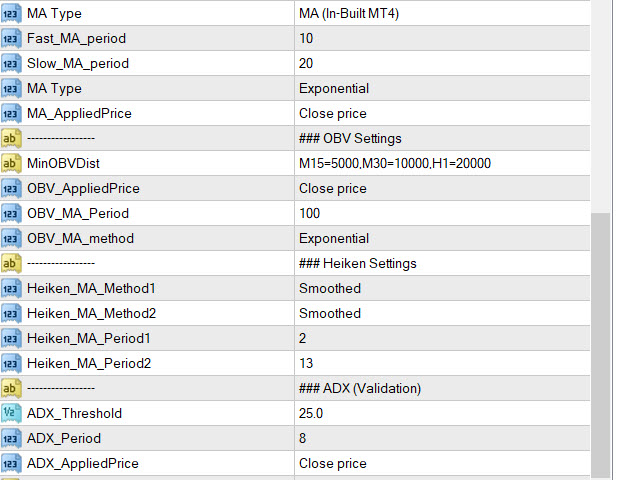
        MA Cross Checks (Main Signal)

        -  MA (In-Built with MT4)
        -  Hull MA

          OBV Cross Check (Main or Validation)

          In Dashboard, for MinOBVDist (Minimum OBV Distance) you can also set different values for different timeframes. This will also work in Arrows Indicator.

          It's useful in arrows because you might want to save a common template that the dash will open. And would like all values to be preset.

          OBV-MA: Is the Moving Average of "OBV_MA_Period" number of last OBV Values. Using "OBV_MA_method" Moving Average Method.

          BUY: OBV should be at least Min Distance above OBV-MA

          SELL: OBV should be at least Min Distance below OBV-MA

          Heiken Cross Check (Main or Validation)

          BUY: Heiken should be Bullish

          SELL: Heiken should be Bearish

          ADX (Validation):

          ADX should be above Threshold for both BUY and SELL

          BUY: +DI should be above -DI

          SELL: -DI should be above +DI

          SuperTrend (Validation)

          BUY: SuperTrend should indicate Buy (Blue)

          SELL: SuperTrend should indicate SELL (Orange)

          PSAR (Validation)

          BUY: PSAR dot should be under the price

          SELL: PSAR dot should be above the price

          EMA Higher Timeframe Align (Validation)

          If Number of timeframes is 3, it will check current timeframe alignment with 2 higher timeframe alignment.

          If all are aligned with Main Signal, then it will allow the signal.

          Отзывы 1
          Paulina Andrea Madariaga Figueroa
          4192
           

          I don't understand how this indicator is not so popular. All of this author's products are fantastic.

          Рекомендуем также
          This is a simple arrow system based on Engulfing Candlestick Pattern. It gives you alerts on your smartphone when there is an engulfing candlestick pattern happens. Which type of alerts available? 1. It paints on chart Up/Down Arrows. 2. Popup message and sound alert in trading terminal window. 3. Push notification or Alert on your Android and IOS mobile phones (requires MT4 or MT5 app installed!) *Note: Use it on higher timeframes like H4 (4 hours), D1 (1 Day) then find trade opportunities on s
          KT Candlestick Patterns Scanner is a Multi-Symbol and Multi-Timeframe scanner that fetches and shows various candlestick patterns on 28 currency pairs and 9 time-frames concurrently . The scanner finds the candlestick patterns by loading the KT Candlestick Patterns indicator as a resource in the background. Features The scanner can find the candlestick patterns on 252* combinations of symbols and time-frames from a single chart. Open the signal's chart loaded with a predefined template with a s
          Сканер Stochastic Multicurrency Scanner Dashboard MT4 — это мощный инструмент для мониторинга множества валютных пар и таймфреймов с использованием осциллятора Стохастик. Он организует сигналы в табличном формате, отображая статус каждого символа по таймфреймам от M1 до MN1. Трейдеры могут включать или отключать определенные таймфреймы в соответствии со своими стратегиями. Версия для MT5 доступна здесь: Stochastic Oscillator Multicurrency Scanner MT5 Для подробной документации нажмите здесь: Док
          QuantumAlert Stoch Navigator is a free indicator available for MT4/MT5 platforms, its work is to provide "alerts" when the market is inside "overbought and oversold" regions in the form of "buy or sell" signals. This indicator comes with many customization options mentioned in the parameter section below, user can customise these parameters as needful. Join our   MQL5 group , where we share important news and updates. You are also welcome to join our private channel as well, contact me for the p
          FREE
          Документация по торговой стратегии TequilaEA 1. Основная информация Название : TequilaEA Версия : 1.0 Пригодный инструмент : XAUUSD (Золото/Доллар США) Пригодный таймфрейм : M1 (1-минутный график) Разработчик : Tulip Financial Technology 2. Основная торговая логика Данный экспертный совет (EA) принимает торговые решения на основе комбинации технических индикаторов и распознавания ценовых паттернов, с следующей основной логикой: Определение тенденции Определение общего направления тенденции с исп
          FREE
          MASi Three Screens основан на торговой стратегии Доктора Александра Элдера. Данный индикатор является сборником алгоритмов. Алгоритмы основаны на анализе графиков нескольких таймфреймов. Вы можете применить любой из предоставленных. Список версий алгоритмов ThreeScreens v1.0 - Простая реализация, с анализом MACD линии; ThreeScreens v1.1 - Простая реализация, с анализом MACD гистограммы; ThreeScreens v1.2 - Совмещение двух первых алгоритмов в одной версии; ThreeScreens v1.2.1 - В алгоритм внедре
          FREE
          Session Kill zones with panel for quick changes. Asia Killzone London Killzone New York Killzone London Close Killzone In this indicator GMT+2 timings are used that are most common among many brokers. read the image attached in the screenshots to know more about sessions adjustments Session timings can be changed according to your broker timings and day light savings. Thank you :) Always open to feedback and criticism if it helps me provide you more value. - Rahul  My other indicators you may l
          This is an indicator that has been updated from the previous VRC indicator, which has both buy and sell arrows now, and it is optimised from the previous one. You can try it out, the version is upgraded and might suit your trading style. You can also use this indicator as a confluence, or you can use it as a main signal provider; it can be used along with your strategy or top-down approach analysis. Past performance does not guarantee future performance; kindly do a top-down analysis and keep yo
          Торговый советник предназначен для торговли валютной парой "USDJPY"на минутном графике.  Торговая стратегия основана на теории вероятности. Советник использует фиксированный стоп лосс и тейк профит с соотношением один к двум. Для восстановления советник частично использует коэффициент восстановления увеличения объёма. Хотя советник использует мартингейл он не торгует против тренда и не накапливает по убыточные позиции. В советник встроен более тридцати торговых стратегий и каждый ордер живёт сво
          Breakout Box
          Claus Dietrich
          4.33 (24)
          BREAKOUT-SESSION-BOX ЛОНДОН ЕС США АЗИЯ Открытый Ожидание волатильного движения выше или ниже диапазона открытия Мы берем максимум диапазона в качестве входа в длинную сделку, а стоп-лосс будет минимумом диапазона. и наоборот, минимум диапазона как вход для короткой сделки и максимум для SL. Размер диапазона - это расстояние до TP (Take Profit) Диапазон часов работы не должен превышать примерно 1/3 среднего дневного диапазона. 4 примера прорыва уже предопределены: Азия, Франкфурт, Лондон, США.
          FREE
          Please contact me at telegram  https://t.me/smartforex7 After purchasing SmartForex Indicator then Use This Indicator...................... SMART EXIT PROFIT LINE Indicator is very Helpful with SmartForex Indicator ........................................ SMART EXIT PROFIT LINE Indicator Attach with SmartForex Indicator after then Red Line Show Exit buy Profit , Green Line show Exit Sell Profit................
          FREE
          Этот советник не совершает никаких сделок, но он сканирует все символы в ваших обзорах рынка и сканирует каждую акцию одну за другой в разных таймфреймах, и в конце он показывает вам, какой символ в каком таймфрейме имеет мощную поглощающую свечу. Кроме того, вы можете определить период MA и верхний и нижний пределы RSI, и он показывает вам, какие символы, на каком таймфрейме, будут пересекать скорректированную скользящую среднюю, и какой символ, на каком таймфрейме, будет пересекать верхний или
          FREE
          ExportCSV
          Etsushi Ishizuka
          Обзор ExportCSVFile — это скрипт для MetaTrader 4, который экспортирует историю счёта за выбранный период в файл CSV. Он предназначен для анализа сделок, построения отчётов в Excel и ведения журнала торговли. Скрипт не открывает и не изменяет ордера, что делает его полностью безопасным. Основные функции Экспорт истории счёта за указанный пользователем период Сохранение в формате CSV (разделитель — запятая), который открывается в Excel Вывод основных полей: Ticket, Type, Symbol, OpenTime, CloseTi
          FREE
          Бесплатный информационный индикатор-помощник Email Alert & InfoPanel. Особенно будет полезен трейдерам, использующим большое количество валютных пар или сеточные торговые системы с усреднением или Мартингейлом. Также он просто удобен, как информатор с возможность отправки сообщения на почту или мобильное приложение. Выполняет следующие функции: Рассчитывает просадку депозита по эквити и отправляет сообщение пользователю, если она больше, чем указана в настройках. Отправляет уведомление о просадк
          FREE
          YOU CAN NOW DOWNLOAD FREE VERSIONS OF OUR PAID INDICATORS . IT'S OUR WAY OF GIVING BACK TO THE COMMUNITY ! >>>    GO HERE TO DOWNLOAD   The system is a free open source pine script originally published on TradingView by everget   . It was converted to Mt4 by Forex Robot Makers. This system is a  popular trend indicator based on ATR ( Average True Range ) , Moving Averages and the Donchian channel . System BackGround ATR The average true range is an indicator of the price volatility of an asse
          FREE
          MT Scanner
          Niravkumar Maganbhai Patel
          4 (2)
          Данный индикатор позволяет сканировать символы в окне "Обзор рынка" (не более 15 в демо-версии), отфильтровывать тренды и отправлять оповещения. Он работает на основе эффективного индикатора "SuperTrend" , который используется многими трейдерами для торговли: Когда цвет ячейки меняется на " зеленый " или " красный ", это указывает на изменение тренда для открытия длинной или короткой позиции. Также появится экранное уведомление. Когда цвет меняется на зеленый , это указывает на восходящий тренд
          FREE
          QuantumAlert RSI Navigator is a free indicator available for MT4/MT5 platforms, its work is to provide "alerts" when the market is inside "overbought and oversold" regions in the form of "buy or sell" signals. This indicator comes with many customization options mentioned in the parameter section below, user can customise these parameters as needful. Join our   MQL5 group , where we share important news and updates. You are also welcome to join our private channel as well, contact me for the pri
          FREE
          Ema Dashboard — это инновационная панель, позволяющая отслеживать скользящую среднюю на нескольких символах и на разных таймфреймах. Панель позволяет анализировать информацию на 28 парах с одного графика. Функции включают в себя анализ на таймфреймах H1, H4, дневном, недельном и месячном. Такая функциональность позволяет с легкостью определять долгосрочный тренд. Панель помогает предпринимать важные направленные движения. Нажатие на кнопку открывает новый график (символ и таймфрейм). Графически
          Market Dashboard Indicator gives you advanced information’s about your selected Symbols in MarketWatch Daily Price Movements (M1 – D1) RSI Values with Highlight Function for your current Timeframe & H1 & H4 Profit per Symbol and traded lots (buy & sell) EMA 5 – 100 based on selected period Swap Information (which direction is positive) FIBO Info & Tracking (highlighted FIBO Levels close to current price – based on selected period) One Click ChartOpen   Important: Get informed about new Products
          Parabolic SAR extreme
          Teng Qi Sheng Joshua
          5 (1)
          Parabolic SAR extreme When the Parabolic SAR value indicates an uptrend or downtrend, the EA will open a buy or sell trade respectively, given that all other criteria are met This EA allows you to set up to 21 separate Parabolic SAR  criteria for the EA to work on  There are 3 input parameter sets (SAR1, SAR2, and SAR3) Each set allows you to determine the parameters (such as the step and max step) for each set And within each set, you get to indicate up to 7 timeframe for the EA to operate in
          FREE
          Vantage
          Waseem Raza
          5 (1)
          Vantage - полуавтоматическая утилита для управления сделками в один клик, оснащенная пользовательским интерфейсом. Базовая стратегия советника - сеточная торговля. Откройте первоначальную сделку при помощи кнопок на графике, советник сделает все остальное. Сетка может быть открыта на стороне убытка, на стороне прибыли или на обеих сторонах одновременно. Также можно торговать без применения сетки. Используйте низкое соотношение риска к балансу, запускайте советника на VPS-сервере. Это позволит со
          This indicator uses a different approach from the previous version to get it's trendlines. This method is derived from Orchard Forex, and the process of making the indicator is demonstrated in there video   https://www.youtube.com/watch?v=mEaiurw56wY&t=1425s . The basic idea behind this indicator is it draws a   tangent line   on the highest levels and lowest levels of the bars used for calculation, while ensuring that the lines don't intersect with the bars in review (alittle confusing? I know
          FREE
          Quick Lines Tool: Удобный индикатор для построения трендовых линий и прямоугольников Quick Lines Tool — это мощный и интуитивно понятный индикатор для MetaTrader 4, предназначенный для трейдеров, которым нужны быстрые и эффективные инструменты для технического анализа. С помощью этого индикатора вы сможете легко создавать трендовые линии, уровни поддержки/сопротивления (AP/DW) и прямоугольники, оптимизируя процесс разметки графиков. Индикатор идеально подходит как для новичков, так и для професс
          Order Block Draw MTF
          Jorge Delgado Segura
          4 (1)
          Just $30 for six months!!!. This will draw Order Blocks just by clicking on a candle with different colors for different timeframes. It will use the body or the wicks. It can also draw the mean threshold of the candle open/close or high/low. As a drawing tool, it is not active all the time after adding it to the chart. Activate by pressing 'b' twice on the keyboard within a second. If activated but then decided not to draw, deactivate by pressing 'b' once.  Box color depends if candle is abov
          For more info,  questions   and problems join to discord.gg/reitakfx Very informative and detailed tool for your account.  - pairs, number of trades, lot size, profit, lose, nett p/l, net pips - profit growth chart Instalation : - open chart and delete every other indicator on it - put this report on chart Setting : - magic number - filters (comment, symbols, currencies) - date (today, week, month custom) - Start / End date (this is for custom date) - report type (open - only active trades wi
          FREE
          MACD Scanner With Alerts
          Niravkumar Maganbhai Patel
          4 (2)
          Панель инструментов MACD   Этот индикатор помогает сканировать символы, которые находятся в окне "Обзор рынка", и отфильтровывать тренд по MACD. Дивергенция схождения скользящих средних (MACD) - это индикатор импульса, следующий за трендом, который показывает взаимосвязь между двумя скользящими средними цены ценной бумаги. MACD рассчитывается путем вычитания 26-периодной экспоненциальной скользящей средней (EMA) из 12-периодной EMA. Результатом этого расчета является линия MACD. Затем пове
          FREE
          Простой скрипт для анализа возможности получения прибыли по всему рынку по всем символам. Вы можете указать минимальную и максимальную прибыль в процентах и количество шагов для каждого периода. Скрипт найдет самые интересные символы в зависимости от вашей конфигурации. Вы получите быстрый и актуальный анализ всего рынка, который поможет вам сделать правильный выбор сделок, вы больше никогда не упустите возможность.
          FREE
          MirrorEA
          Eugenio Bravetti
          The new version of  MirrorSoftware 2021  has been completely rewriten and optimized.  This version requires to be loaded only on a single chart because  it can detect all actions on every symbol and not only the actions of symbol where it is loaded. Even the  graphics and the configuration mode  have been completely redesigned. The MirrorSoftware is composed of two components (all components are required to work):  MirrorController  (free indicator): This component must be loaded into the MASTER
          QuantumAlert CCI Navigator is a free indicator available for MT4/MT5 platforms, its work is to provide "alerts" when the market is inside "overbought and oversold" regions in the form of "buy or sell" signals. This indicator comes with many customization options mentioned in the parameter section below, user can customise these parameters as needful. Join our   MQL5 group , where we share important news and updates. You are also welcome to join our private channel as well, contact me for the pri
          FREE
          Полная версия индикатора находится здесь . Индикатор предназначен для торговли внутри дня. Строит канал по пробою крайних уровней которого вы можете открывать ордер на покупку или продажу. Во флетовом рынке работа ведётся на отбой от этих уровней. Для фильтрации входов используется цветная гибридная скользящая средняя. Настройки по умолчанию предназначены для терминального времени GMT +3 (подходит для большинства брокеров) и для терминалов с пятизначными котировками. Индикация канала и уровней A
          FREE
          С этим продуктом покупают
          Meravith
          Ivan Stefanov
          5 (1)
          Индикатор анализирует объем с каждой точки и рассчитывает уровни истощения рынка для этого объема. Он состоит из трех линий: Линия истощения бычьего объема Линия истощения медвежьего объема Линия, указывающая на тренд рынка. Эта линия меняет цвет в зависимости от того, является ли рынок медвежьим или бычьим. Вы можете анализировать рынок с любой выбранной вами точки. Как только достигнута линия истощения объема, определите новую точку для начала следующего анализа. Можно анализировать что угодно
          Инновационный индикатор, использующий эксклюзивный алгоритм для быстрого и точного определения тренда. Индикатор автоматически рассчитывает время открытия и закрытия позиций, а также подробную статистику работы индикатора на заданном отрезке истории, что позволяет выбрать наилучший торговый инструмент для торговли. Вы также можете подключить свои пользовательские стрелочные индикаторы к Scalper Inside Pro для проверки и расчета их статистики и прибыльности. Инструкция и настройки: Читать... Осно
          В настоящее время скидка 20%! Лучшее решение для новичка или трейдера-эксперта! Эта приборная панель работает на 28 валютных парах. Он основан на 2 наших основных индикаторах (Advanced Currency Strength 28 и Advanced Currency Impulse). Он дает отличный обзор всего рынка Forex. Он показывает значения Advanced Currency Strength, скорость движения валюты и сигналы для 28 пар Forex на всех (9) таймфреймах. Представьте, как улучшится ваша торговля, когда вы сможете наблюдать за всем рынком с помощ
          В НАСТОЯЩЕЕ ВРЕМЯ СКИДКА 20%! Лучшее решение для новичка или трейдера-эксперта! Этот индикатор специализирован для отображения силы валюты для любых символов, таких как экзотические пары, товары, индексы или фьючерсы. Впервые в своем роде, любой символ может быть добавлен в 9-ю строку, чтобы показать истинную силу валюты золота, серебра, нефти, DAX, US30, MXN, TRY, CNH и т.д. Это уникальный, высококачественный и доступный торговый инструмент, потому что мы включили в него ряд собственных функци
          Advanced Supply Demand
          Bernhard Schweigert
          4.91 (296)
          Этот индикатор является уникальным, качественным и доступным инструментом для торговли, включающим в себя наши собственные разработки и новую формулу. В обновленной версии появилась возможность отображать зоны двух таймфреймов. Это означает, что вам будут доступны зоны не только на старшем ТФ, а сразу с двух таймфреймов - таймфрейма графика и старшего: отображение вложенных зон. Обновление обязательно понравится всем трейдерам, торгующим по зонам спроса и предложения. Важная информация Для макс
          Trend indicator AI
          Ramil Minniakhmetov
          5 (74)
          Индикатор Trend Ai - отличный инструмент, который улучшит анализ рынка трейдером, сочетая идентификацию тренда с точками входа и предупреждениями о развороте. Этот индикатор позволяет пользователям уверенно и точно ориентироваться в сложностях рынка Форекс Помимо первичных сигналов, индикатор Trend Ai определяет вторичные точки входа, возникающие во время откатов или коррекций, позволяя трейдерам извлекать выгоду из коррекции цены в рамках установленного тренда. Важные преимущества: · Работае
          Если вы покупаете этот индикатор, вы получите мой профессиональный Trade Manager + EA БЕСПЛАТНО. Прежде всего стоит подчеркнуть, что эта торговая система является индикатором без перерисовки, без повторной отрисовки и без задержки, что делает ее идеальной как для ручной, так и для роботизированной торговли. Онлайн курс, руководство и загрузка пресетов. «Smart Trend Trading System MT5» - это комплексное торговое решение, созданное для новичков и опытных трейдеров. Он объединяет более 10 премиаль
          Этот индикатор представляет собой индикатор автоматического волнового анализа, который идеально подходит для практической торговли! Случай... Примечание.   Я не привык использовать западные названия для классификации волн. Из-за влияния соглашения об именах Тан Лунь (Тан Чжун Шуо Дзен) я назвал основную волну   ручкой   , а вторичную полосу волн —   сегментом   Ат. в то же время сегмент имеет направление тренда. Именование   в основном является трендовым сегментом   (этот метод именования буде
          FX Power: Анализируйте силу валют для более эффективной торговли Обзор FX Power — это ваш незаменимый инструмент для понимания реальной силы валют и золота в любых рыночных условиях. Определяя сильные валюты для покупки и слабые для продажи, FX Power упрощает принятие торговых решений и выявляет высоковероятные возможности. Независимо от того, хотите ли вы следовать за трендами или предсказывать развороты с использованием экстремальных значений дельты, этот инструмент идеально адаптируется под
          Looking for a powerful yet lightweight swing detector that accurately identifies market structure turning points? Want clear, reliable buy and sell signals that work across any timeframe and any instrument? Buy Sell Arrow MT Swing is built exactly for that — precision swing detection made simple and effective. This indicator identifies Higher Highs (HH) , Higher Lows (HL) , Lower Highs (LH) , and Lower Lows (LL) with remarkable clarity. It is designed to help traders easily visualize market str
          Dynamic Forex28 Navigator — инструмент для торговли на рынке Форекс нового поколения. В НАСТОЯЩЕЕ ВРЕМЯ СКИДКА 49%. Dynamic Forex28 Navigator — это эволюция наших популярных индикаторов, объединяющая мощь трех в одном: Advanced Currency Strength28 Indicator (695 отзывов) + Advanced Currency IMPULSE with ALERT (520 отзывов) + CS28 Combo Signals (бонус). Подробности об индикаторе https://www.mql5.com/en/blogs/post/758844 Что предлагает индикатор Strength нового поколения?  Все, что вам нравило
          ACB Breakout Arrows
          KEENBASE SOFTWARE SOLUTIONS
          4.15 (34)
          Индикатор ACB Breakout Arrows предоставляет ключевой сигнал на вход в рынок, обнаруживая особую модель пробоя. Индикатор непрерывно сканирует график на наличие стабилизирующегося импульса в одном направлении и выдает точный сигнал перед значительным рыночным движением.  Получите сканер с поддержкой мульти-символов и мульти-таймфреймов здесь - Сканер для ACB Breakout Arrows MT4 Ключевые особенности Уровни Стоп-лосса и Тейк-профита задаются индикатором. Поставляется с панелью сканера MTF, которая
          В НАСТОЯЩЕЕ ВРЕМЯ СКИДКА 26% Лучшее решение для новичка или трейдера-эксперта! Этот индикатор является уникальным, высококачественным и доступным торговым инструментом, поскольку мы включили в него ряд собственных функций и новую формулу. С помощью всего лишь ОДНОГО графика вы можете определить силу валюты для 28 пар Форекс! Представьте, как улучшится ваша торговля, потому что вы сможете точно определить точку запуска нового тренда или возможность скальпирования? Руководство пользователя:  
          SMC Blast Signal with FVG, BOS and trend Breakout The SMC Blast Signal  is a  Precise trading system for Meta Trader 4 that uses Smart Money Concepts (SMC) , including Fair Value Gaps (FVG) and Break of Structure (BOS) , to identify high-probability trades. It incorporates a Trend Filter using a higher timeframe moving average, ensuring trades align with the prevailing market trend. TREND SIGNAL-FVG DETECTION-BOS DETECTION-TRADE CONFIRMED-Precise Signal entries on m15  Best TF-M15 AND ABOVE Be
          Топовый индикатор МТ4, дающий сигналы для входа в сделки без перерисовки! Идеальные точки входа в сделки   для  валют, крипты, металлов, акций, индексов !  Смотрите  видео  (6:22) с примером отработки всего одного сигнала, окупившего индикатор. Версия индикатора для MT5 Преимущества индикатора Сигналы на вход без перерисовки Если сигнал появился, он никуда НЕ исчезает! В отличие от индикаторов с перерисовкой, которые ведут к потере депозита, потому что могут показать сигнал, а потом убрать его.
          Hidden Cycles
          Lev Vladimirovic Marushkin
          5 (1)
          Black Friday Sale – Limited Time! Grab Hidden Cycles for only $129 (regular price $179 ). This is your chance to boost your strategy with a powerful, easy-to-use cycle-based trading tool. Offer ends soon — don’t miss it! Based on Universal Laws — NOT Some Guy’s Algorithm: Let the market adjust to the Hidden Cycles Geometry — not the other way around. Most indicators are based on a man-made formula. They often lag, fail over time, or need constant re-optimization.  Hidden Cycles is different.
          Adaptive Volatility Range [AVR] - это мощнейший инструмент для определения ключевых  разворотов тренда. AVR  - с точностью отображает Средний Истинный Диапазон  волатильности с учетом Средневзвешенной по объему цены .Индикатор позволяет адаптироваться абсолютно под  любую волатильность рынка,путем расчета средней волатильности за определенный период времени -это обеспечивает устойчивый показатель положительных сделок. Вы получаете не просто индикатор,а  профессиональную автоматизированную торго
          СЕЙЧАС СКИДКА 31% !!! Лучшее решение для новичка или трейдера-эксперта! Этот индикатор является уникальным, высококачественным и доступным торговым инструментом, поскольку мы включили в него ряд собственных функций и секретную формулу. Всего на ОДНОМ графике он выдает алерты по всем 28 валютным парам. Представьте, как улучшится ваша торговля, ведь вы сможете точно определить точку запуска нового тренда или возможность скальпирования! Построенный на новых базовых алгоритмах, он позволяет еще
          Royal Wave Pro M4
          Vahidreza Heidar Gholami
          5 (3)
          Royal Wave is a Trend-Power oscillator which has been programmed to locate and signal low-risk entry and exit zones. Its core algorithm statistically analyzes the market and generates trading signals for overbought, oversold and low volatile areas. By using a well-designed alerting system, this indicator makes it easier to make proper decisions regarding where to enter and where to exit trades. Features Trend-Power Algorithm Low risk Entry Zones and Exit Zones Predictions for Overbought and Over
          Сколько раз вы покупали торговый индикатор с отличными бэк-тестами, доказательством производительности на реальном счете с фантастическими числами и статистикой повсюду , но после использования вы в конечном итоге сливали свой счет? Вам не следует доверять сигналу самому по себе, вам нужно знать, почему он появился в первую очередь, и это то, что RelicusRoad Pro делает лучше всего! Руководство пользователя + Стратегии + Обучающие видео + Приватная группа с VIP-доступом + Доступна мобильная верс
          FX Volume
          Daniel Stein
          4.62 (37)
          FX Volume: Оцените подлинную динамику рынка глазами брокера Краткий обзор Хотите вывести свою торговлю на новый уровень? FX Volume дает вам информацию в реальном времени о том, как розничные трейдеры и брокеры распределяют свои позиции — задолго до появления запаздывающих отчетов типа COT. Независимо от того, стремитесь ли вы к стабильной прибыли или ищете дополнительное преимущество на рынке, FX Volume поможет выявлять крупные дисбалансы, подтверждать пробои и совершенствовать управление риск
          ProEngulfing
          Ashkan Hazegh Nikrou
          4.5 (2)
          Представляем ProEngulfing - ваш профессиональный индикатор паттерна "Engulf" для MT4 Разблокируйте мощь точности с ProEngulfing - передовым индикатором, разработанным для выявления и выделения квалифицированных паттернов "engulf" на рынке Forex. Работая на платформе MetaTrader 4, ProEngulfing предлагает тщательный подход к распознаванию паттернов "engulf", обеспечивая получение только самых надежных сигналов для принятия решений в торговле. Как работает ProEngulfing: ProEngulfing использует слож
          Candle Binary Scalper - продукт технического анализа для форекс и бинарных опционов. Включает в себя нескольно технических индикаторов объединенных в торговую систему. Подходит для ручной торговли внутри тренда, для скальпинга и бинарных опционов. Работает на всех тайм-фреймах и торговых инструментах. Рекомендуемые Тайм-фреймы для торговли M15, M30, H1 и H4, M5 и M1 использовать при высокой волатильности. Имеется несколько типов оповещений. Как использовать продукт Оптимальные настройки уже по
          Introducing Volume Orderflow Profile , a versatile tool designed to help traders visualize and understand the dynamics of buying and selling pressure within a specified lookback period. Perfect for those looking to gain deeper insights into volume-based market behavior! MT5 Version -  https://www.mql5.com/en/market/product/122657 The indicator gathers data on high and low prices, along with buy and sell volumes, over a user-defined period. It calculates the maximum and minimum prices during this
          TrendLine PRO MT4
          Evgenii Aksenov
          4.83 (167)
          Индикатор   Trend Line PRO   является самостоятельной торговой стратегией. Он показывает смену тренда, точку входа в сделку, а так же автоматически рассчитывает три уровня Take Profit и защиту от потери Stop Loss Trend Line PRO   идеально подходит для всех символов Meta Trader:  валют, металлов, криптовалют, акций и индексов. Индикатор применяется в торговле на реальных счетах, что подтверждает надежность стратегии. Наши Сигналы  вы можете найти здесь:  https://robomarket.org/product-category/si
          CONGESTION BREAKOUT PRO This indicator scans the breakout of congestion zones . This indicator unlike any other congestion indicator you will find in the market right now,  it uses an advanced algorithm not peculiar to most traditional congestion indicators available today . The advanced algorithm used to define the congestions  is greatly responsible for the high rate real congestion zones and low rate fake congestion zones spotted by this product. UNDERSTANDING CONGESTION Congestion are ar
          OrderFlow Absorption – Профессиональный индикатор дельты и сигналов абсорбции для MT4 Откройте для себя настоящую силу анализа потока ордеров с OrderFlow Absorption – лучшим индикатором дельты и сигналов абсорбции для MetaTrader 4. Этот инструмент создан для трейдеров, которые хотят видеть, что действительно происходит за каждым движением цены, выявляя скрытое давление покупателей/продавцов и события абсорбции, которые двигают рынок. Возможности Визуализация дельты:   Мгновенно определяйте давле
          Extreme Value Sniper is a detrended price indicator  Indicator finds the potential reversal levels by checking value ranges and price cycles. MT5 Version of the product :  https://www.mql5.com/en/market/product/114550 It shows the overbought and oversold levels using the average range. Overbought Levels are between 4 and 10 Oversold levels are bewtween -4 and -10 Those levels can be used as a reversal levels. Extreme Value Sniper look for some special divergence and convergence patterns to c
          Индикатор " Dynamic Scalper System " разработан для скальпингового метода торговли внутри трендовых волн. Тестировался на основных валютных парах и золоте, возможна совместимость с другими торговыми инструментами. Дает сигналы для кратковременного открытия позиций по тренду с дополнительным сопровождением движения цены. Принцип действия индикатора. Большие стрелки определяют направление тренда. Внутри трендовых волн действует алгоритм генерации сигналов для скальпинга в виде маленьких стрело
          Свинг-трейдинг - это первый индикатор, предназначенный для обнаружения колебаний в направлении тренда и возможных разворотов. Он использует базовый подход свинговой торговли, широко описанный в торговой литературе. Индикатор изучает несколько векторов цен и времени для отслеживания направления совокупного тренда и выявляет ситуации, когда рынок перепродан или перекуплен и готов к исправлению. [ Руководство по установке | Руководство по обновлению | Устранение неполадок | FAQ | Все продукты ] П
          Другие продукты этого автора
          TDI Multi Timeframe Scanner: This Dashboard indicator uses the TDI (Trader's Dynamic Index) Indicator to find best trades. Read detailed How to Use Guide: https://www.mql5.com/en/blogs/post/758252 Extra indicators also available in above post. Checks for: - SharkFin Pattern Free indicator for SharkFin: https://www.mql5.com/en/market/product/42405/ - TDI Trend: Strong/Weak Trend Up/Down - TDI Signal: Strong/Medium/Weak Signal for Buy/Sell - Consolidation - Overbought/Oversold - Volatility Ban
          A Fibonacci indicator is best used with other indicators like Pivots, Support/Resistance etc. Price tends to use Fibo levels as Support or Resistance lines. So, this indicator is very useful to know when price might reverse or if a level is crossed, price might continue the trend. Also, to find the best Take Profit and StopLoss lines. Don't use Fibo Indicator alone for trading as it might not always be accurate. Use it to make your strategies better as a supporting indicator. Settings: Auto Fib
          FREE
          This indicator is based on Guppy's GMMA Strategy. And shows arrows when GMMA lines cross up or down. To have this indicator and get alerts for Multiple Timeframes and multiple Pairs you can check out the demo of this GMMA Trend Scanner indicator: https://www.mql5.com/en/market/product/38747 About GMMA In Brief: GMMA attempts to identify trends by combining two groups of moving averages with differing time periods: The long-term EMAs (30, 35, 40, 45, 50, and 60) the behaviors of investors that h
          FREE
          Dashboard uses Ichimoku Strategy to find best trades. Get extra Indicators/Template: And read more about detailed Product Description and usage here: https://www.mql5.com/en/blogs/post/747457 Read more about Scanner Common features in detail here: https://www.mql5.com/en/blogs/post/747456 Features: Price Kumo Breakout Tenkan-Kijun Cross Chikou/CLoud and Chikou/Price Support/Resistance (SR-SS or SR-NRTR) Stochastic OB/OS and back Awesome Oscillator Higher Timeframe Ichimoku Trend Align
          This is a Sharkfin Arrows Indicator. Detailed explanation and TDI extras: https://www.mql5.com/en/blogs/post/759138 This indicator will show only Arrows. It does not have TDI symbols on chart. Please get the extras from links above for TDI indicators. Sharkfin Scanner (paid): https://www.mql5.com/en/market/product/123566 TDI Scanner Dash (paid): https://www.mql5.com/en/market/product/41826 About: This Indicator finds the Shark Fin Pattern. It will show an arrow in the current bar if RSI sha
          FREE
          3 Level ZZ Semafor Scanner: This is a Dashboard indicator which uses 3LZZ Indicator in the background to find semafors. It will give priority to the semafors3 because they specify a strong signal. So, even if there is a sem1 or 2 on current bar, and if Sem3 was within "Check Previous Bars for Sem 3". Then it will show Sem3 instead. Read about this in detailed post: https://www.mql5.com/en/blogs/post/758250 And get all extra Indicators/Template from above link. Please note: Number of settings
          How To Use Check out this post for detailed description on  All Indicator extras and template: https://www.mql5.com/en/blogs/post/758259 The Best Heiken Ashi System is a simple trading system for trading based only two indicators for generate signals: Heiken ashi smoothed and Vqzz indicator multi-timeframe. The system was created for scalping and day trading but can also be configured for higher time frames. As mentioned, the trading system is simple, you get into position when the two indica
          FREE
          Read detailed blogpost with screenshots here: https://www.mql5.com/en/blogs/post/764306 Note: This is the MT5 only version. The MT4 version is available here: https://www.mql5.com/en/market/product/149941 Features Kalman smoothing to reduce market noise. Supertrend bands for trend direction. Color-coded dots and arrows for quick reading. Arrow signals for trend continuation. Alerts for trend changes. Adjustable inputs for different styles. How to Use Green dots = bullish bias. Red dots = bea
          Features: - Current TF GMMA Cross and Trend (Mandatory Check.. G-Up/G-Down) - HTF GMMA Trend Check (Optional.. slanting arrow) - TDI or NRTR Trend Check (Optional.. diamond) Read post for detailed description and downloading extra indicators: https://www.mql5.com/en/blogs/post/758264 Scanner: This is a Dashboard Scanner for finding good trades using the GMMA method as base and TDI method for trend verification. All buttons for all Pairs and Timeframes are clickable and will change the chart f
          Features: 1- Get OB/OS Levels from Golden MA Levels 2- Wait for Buy/Sell Start Level Cross 3- Optional: Should price cross Mid Level in earlier bars 4- Optional: Crossing bar High/Medium Volume 5- Optional: MA Stacked to check up/down trend for current TF 6- Optional: NRTR higher timeframes aligned Check Detailed blog post explained: https://www.mql5.com/en/blogs/post/758457 Levels with Buffers available here: Golden MA Levels Indicator: https://www.mql5.com/en/market/product/119515 Note: Arr
          FREE
          How the Indicator Works: This is a Multi-timeframe MA multimeter indicator which studies if price is above or below a particular EMA range and shows Red/Green/Yellow signals. Red: Price Below EMA range Green: Price above range Yellow: Price within range Indicator Properties: EMA Settings: - Default Period is 200. You can change all MA Settings like Period, MA Method (SMA, EMA, etc) or MA Applied Price (Close, Open, etc). - EMA Range list is a comma separated value list for different timeframes
          FREE
          Features: - Moving Average Slope for Max Past Bars - Slope Period - Slope Thresholds - Multiple Slope Type options - See slope visually as a histogram - Info Panel Show/Hide Slope Calculations and Types: The slope value is calculated using the Slope Period. Suppose Period is 5, it will check the MA value for bar (x) and bar (x+5). And find the slope angle between them. Read detailed description about Slope Types and Settings here: https://www.mql5.com/en/blogs/post/747651
          FREE
          Description This scanner uses 3LZZ TRO ex4 and scans for Semafors at given “Shift” bar. Scanner Detailed Settings: https://www.mql5.com/en/blogs/post/747456 Other Settings: Set Periods for Semafor 1,2,3 Set alerts on/off for Semafor 1,2,3 Shift bar (Bar on which semafor is scanned) Refresh After Ticks (Number of ticks when dash is refreshed) This scanner is pretty simplistic version. And a more detailed version with a different strategy is available here: https://www.mql5.com/en/market/product
          FREE
          Moving Average Rainbow Stack: Free: Single Currency & Single Timeframe MA Stack Very useful for finding current and higher timeframe trends. Best suited for long term trend based trading. Use fewer MAs for quick scalping. And not suitable during low volatility. Only use during high volatility and steady trending markets. Use this to enhance your existing Trend based strategies to find best trends. Read detailed description https://abiroid.com/product/abiroid-ma-stack Available MTF and Scanner v
          FREE
          Abiroid Multi Slope indicator allows you to calculate a Slope Histogram for any line of any indicator . Histogram is for 1 slope line only, but slope values can be calculated for 3 lines total. To have multiple histograms, add as many Slope indicators for custom indicators as you like on chart. You just need to provide the Indicator name, buffer value, slope's period and max number of bars back. By default it has slope calculation for TDI_v4.ex4 indicator. There is no way to specify parameters f
          FREE
          Extreme TMA System with Arrows Indicator And Buy/Sell Boxes with Take Profit & Stop Loss This is a Non-Repainting Arrows Indicator based on the Extreme TMA System. It shows TMA cross signals and the best BUY/SELL signals. Along with the most predicted TakeProfit. And StopLoss based on TakeProfit ratio. Please note: This is an Arrows only Indicator. Dashboard is sold separately here: https://www.mql5.com/en/market/product/44825 About Indicator: This indicator shows BUY/SELL Signal Arrows and
          This Scanner Dashboard uses the Extreme TMA System Arrows Indicator to show good BUY/SELL signals. This Product contains dashboard only. It does not contain the Abiroid_Arrow_Extreme_TMA.ex4 indicator. Arrows indicator is not necessary for dashboard to work.  To see arrows, you can buy the arrows indicator separately if you like: https://www.mql5.com/en/market/product/44822 Dash shows Slopes for current and Higher Timeframes. - 1st diamond is current TF. Next diamonds are higher TFs (Please Not
          Scanner Dashboard for Best Heiken Ashi VQZZ Arrows Indicator here: https://www.mql5.com/en/market/product/45900 Check out this post for detailed description on How To Use All Indicator extras and template: https://www.mql5.com/en/blogs/post/758259 Please note that if you are using too many pairs/timeframes, then VQZZ calculations might slow down the dashboard. So be careful not to use too many VQZZ Higher timeframes if you are using too many pairs. Also, VQZZ is based on higher timeframes. e.g
          Abiroid Profit Percent Series 1: Arrows Indicator Stochastic Ichimoku with ATR Get the Scanner for free. For getting Profit Percentages for Multiple Timeframes and Multiple Pairs. And read detailed description about this indicator and all the settings here. And get extra Indicators, Templates and settings for download: https://abiroid.com/product/profit-percent-stoch-ichimoku-with-atr Watch the tutorial video here: https://youtu.be/C45-9kWPE2Q About The Strategy: This strategy has 3 main par
          This is a slope indicator for COG (Center of Gravity) indicator.   Download extra COG Indicators and read detailed description and strategy here: https://www.mql5.com/en/blogs/post/759120 Description: You can set the Slope Threshold for indicating Buy/Sell heightened levels. In the above Image the Threshold is set to 0, because of that all Bullish slope is Green and Bearish is Red. Suppose we set Threshold to -10 and 10, then this is what we get: And also set Slope Period. Default is 5, which
          This Indicator uses Center of Gravity (COG) Indicator to find you the best trades. It is a reversal based Swing Indicator which contains an  Arrows Indicator. That you can buy here from Metatrader Market. Check out this blog post for detailed How to Use Guide and links to free scanner: https://www.mql5.com/en/blogs/post/758262 Scanner needs this arrows indicator in same directory to run Copy scanner ex4 in same folder as your Arrows Indicator: MQL4/Indicators/Market/ All extra indicators and
          This strategy is best used for Trend based trading. While market is trending, price still makes smaller ranges. Darvas boxes show breakouts from these small ranges, while still following the original market trend. Detailed Description: https://www.mql5.com/en/blogs/post/747919 Features: Darvas - Check Darvas Box Breakout -   Check Price Above/Below MA or Darvas Box has crossed MA -   Min, Max Box Height -   Max Distance Between Entry Price and Darvas Box Other Indicators: - NRTR Trend Check
          Free scanner available here: https://abiroid.com/product/abiroid-ema-scalper Basic Strategy: 1: MA Crossover Up/Down Arrow (Mandatory Check) Optional Checks: 2: If NRTR Check On (Optional): For BUY: Check if NRTR blue and For SELL: NRTR Red If NRTR Shadow Distance On (Optional): Check price for 'x' bars back: at Shadow distance (ATR Multiplier distance) from NRTR line. 3: If High Volume bar On: Check if High Volume or if Medium (if on) Volume bar 'x' bars back 4: If HTF Trend Align On (Optiona
          This is a Multi-currency multi-timeframe Support/Resistance Scanner Dashboard for Metatrader 4 (MT4) platform. Get all extras and download free demo here: https://www.mql5.com/en/blogs/post/760210 Read detailed description in post above. And get the SR Indicator for individual charts. Features: Scan Support/Resistance zones (also called Supply/Demand zones) Show alert when price is inside these zones and highlights the pair/timeframe Show or hide SR zones price nearest to current price (Price
          This strategy is useful for small timeframe scalping and binary options. Best timeframes: M5,M15,M30 M1 timeframe is too unpredictable. So be careful with that. Read Detailed Description and Get All: - Free Demo - Free Scanner - Extra Indicators ex4 files from https://abiroid.com/product/abiroid-donchian-scanner-and-arrows Arrows Demo only works in strategy tester. So, Arrows Demo won't work with the free scanner. Scanner needs "Abiroid Donchian Arrow.ex4" to work. So make sure both arrows and
          Read detailed description and Get Free Demo and extra indicators: https://www.mql5.com/en/blogs/post/758610 Features: Halftrend Arrow Scan: Scan Max Past Bars for Halftrend arrows. Show how many bars back the arrow occurred in a bracket Past Bars Back Alerts: Num of bars back for which scanner will send alerts Halftrend HTF Align: Scan Higher timeframes for Trend Direction of Halftrend Indicator and if trends align show a slanting Green/Red Arrow for Up/Down trend Semafor 3 Check: Few bars bef
          Read detailed description and extra indicators: https://www.mql5.com/en/blogs/post/758622 This Supertrend dashboard is a multi-currency and multi-timeframe dash which gives signals whenever supertrend changes it's trend direction. Please note, that this is not a full trading system. It will help you get initial Supertrend signals and higher timeframe trend alignments. And it’s to be used with your own Supertrend Strategies. Features: 1- Select one of In-Built Supertrend Indicators: xSupertren
          About: Get Free Scanner and example Strategies And understand detailed description here: https://www.mql5.com/en/blogs/post/759237 And also get example wrappers from above post. You can make your own wrappers if your indicators have complex conditions or for In-Built MT4 indicators. Features: - Specify your own Custom Indicator - Specify Buffer values and create Variables - Use those Variables to create your own Buy/Sell Conditions - Get Arrows Up/Down Signals - See Arrows Signals in Scanners
          This is a multi-timeframe multi-currency Fibo (Fibonacci levels) and Pivots scanner which also shows Missed Pivot count and Fibo Golden Ratio Zones. Features Select separate Pivot Timeframes for each Dashboard Timeframe Check when price is near a Pivot point Check for Price Crossing Pivot Point Use Mid Pivots (Optional) Show Missed Pivots (Optional) Show High Volume Bar Use Fibo (Optional) Use Fibo Golden Ratio (Optional) Set your preferred Timeframe for Fibo or Pivots Detailed blog post: https:
          This strategy is best used for Scalping and Binary Options. Strategy: There are 3 EMAs: Faster, Medium and Slower. When Price is Trending, wait for Price to bounce an EMA and scalp at each bounce. Features: - Check if 3 MAs are Stacked - Check Price Bounce Off MAs (Faster, Medium, Slower) - Min Distance Between Faster and Medium MA Filter - Max Distance Between Entry Price and Faster MA Filter - High Volume Check - Heiken Trend Check - Volatility Check - Higher/Lower Timeframes MA Stacked check
          Фильтр:
          Paulina Andrea Madariaga Figueroa
          4192
           

          I don't understand how this indicator is not so popular. All of this author's products are fantastic.

          Abir Pathak
          50744
          Ответ разработчика Abir Pathak 2021.03.01 16:47
          Thank you!
          I really appreciate all your reviews :)
          Ответ на отзыв