

Free Scanner:
Download Extras Attached:
MA_Confluence_Extras.zip
You can get Arrows from:
Arrows:
https://www.mql5.com/en/market/product/51078/
Scanner (free):
About Dashboard: Don’t use too many validating Indicators as it might slow down the Dashboard a lot when using too many pairs (like all 28-pairs) and timeframes.
If using 1 Main Indicator and 3 validating indicator, it can take about 1-2 seconds for an individual pair/timeframe. Depending on Validating indicator used.
SuperTrend is slower than remaining. So, best configuration is to use 1 Main Indicator and 2 Validating indicators.
The video tutorial for Common Profit Percent Settings is available here:
And video tutorial for this MA Confluence Indicator is here:
So let’s begin…
What is Confluence?
From Investopedia:
Confluence is the combination of multiple strategies and ideas into one complete strategy.
Confluence occurs when two separate ideas/strategies are used together to form an investment strategy that is in line with an investor’s risk profile and goals.
This term can also be used when doing technical analysis, by looking at charts and developing levels where different indicators are combined to help identify possible opportunities.
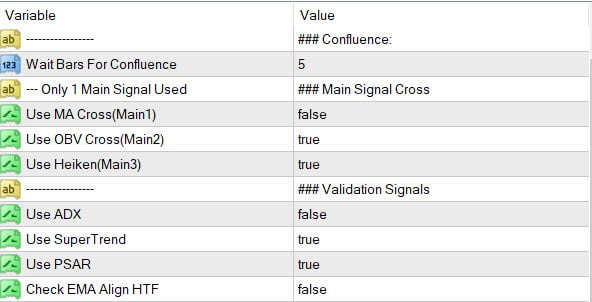
MA Confluence Strategy:
Main Signal Indicators (Any One): MA Cross (In-built) or Hull, OBV Cross, Heiken Ashi Cross
Validation Indicators (Preferably less than 3): OBV (with Min Distance), Heiken Ashi, ADX, SuperTrend, PSAR, Higher TimeFrame EMA Alignment
Main Signal will first generate a BUY/SELL Signal when:
If MA Cross True (Main):
Use In-Built MA or Hull MA and search for Fast MA and Slow MA Cross
If OBV Cross True :
If MA Cross is false, only the OBV Cross will be taken as Main Signal. And it will search for OBV and OBV-MA Cross
If Heiken True:
If MA Cross and OBV Cross both are false, only then Heiken Cross will be taken as Main Signal.
It will search for Heiken Ashi switch.
If MA Cross and OBV Cross and Heiken are all True, it will only use MA Cross as Main Signal. While OBV and Heiken will be used as Validating Signals.
There can be only 1 Main Signal which will generate the BUY/SELL Arrows. All other indicators will be used for validation only.
Once a BUY/SELL Signal is generated, it will check all validating indicators and see if they also indicate a BUY/SELL.
If they don’t validate, then signal is ignored. Or else if everything is in Confluence then you will get a BUY or SELL Arrow and SL and TP lines will be generated.
All Signal Settings:
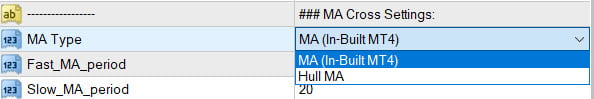
MA Cross Checks (Main Signal)
- MA (In-Built with MT4)
- Hull MA
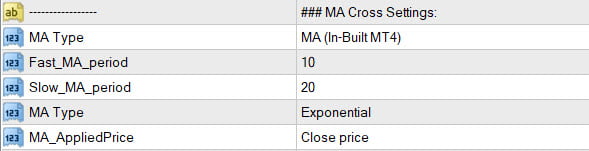
- BUY: Fast MA crosses Slow MA upwards
- SELL: Fast MA Crosses Slow MA Downwards
OBV Cross Check (Main or Validation)
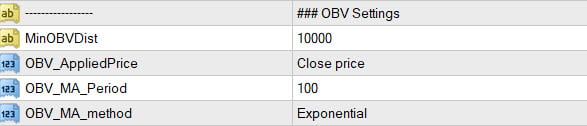
If Main:
- BUY: OBV Crosses OBV-MA upwards
- SELL: OBV Crosses OBV-MA downwards
If Only Validation:
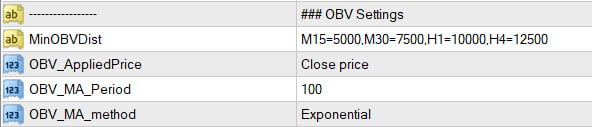
- BUY: OBV should be at least Min Distance above OBV-MA
- SELL: OBV should be at least Min Distance below OBV-MA
In Dashboard, for MinOBVDist (Minimum OBV Distance) you can also set different values for different timeframes. This will also work in Arrows Indicator.
It’s useful in arrows because you might want to save a common template that the dash will open. And would like all values to be preset.
OBV-MA: Is the Moving Average of “OBV_MA_Period” number of last OBV Values. Using “OBV_MA_method” Moving Average Method.
Heiken Cross Check (Main or Validation)
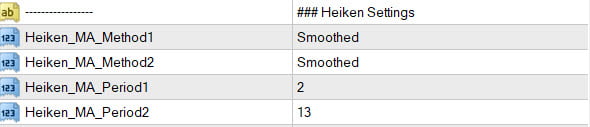
If Main:
- BUY: Heiken Changes from Bearish to Bullish
- SELL: Heiken Changes from Bullish to Bearish
If only Validation:
- BUY: Heiken should be Bullish
- SELL: Heiken should be Bearish
ADX (Validation):
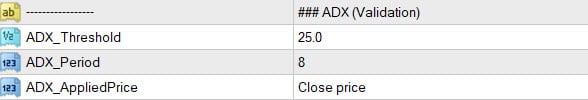
ADX should be above Threshold for both BUY and SELL
BUY: +DI should be above -DI
SELL: -DI should be above +DI
SuperTrend (Validation)
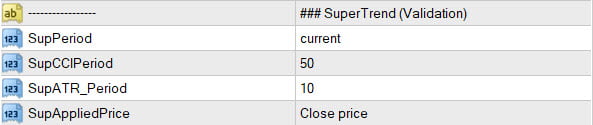
BUY: SuperTrend should indicate Buy (Blue)
SELL: SuperTrend should indicate SELL (Orange)
PSAR (Validation)
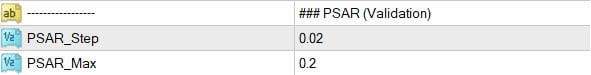
BUY: PSAR dot should be under the price
SELL: PSAR dot should be above the price
EMA Higher Timeframe Align (Validation)
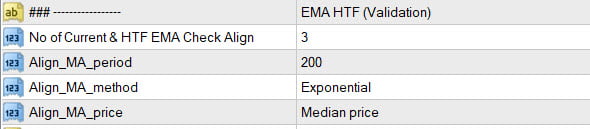
If Number of timeframes is 3, it will check current timeframe alignment with 2 higher timeframe alignment.
If all are aligned with Main Signal, then it will allow the signal.
Dashboard Indicator Settings:
The scanner dashboard will also have the same settings as the Arrows indicator. Along with common dashboard settings described here:
https://www.mql5.com/en/blogs/post/747456
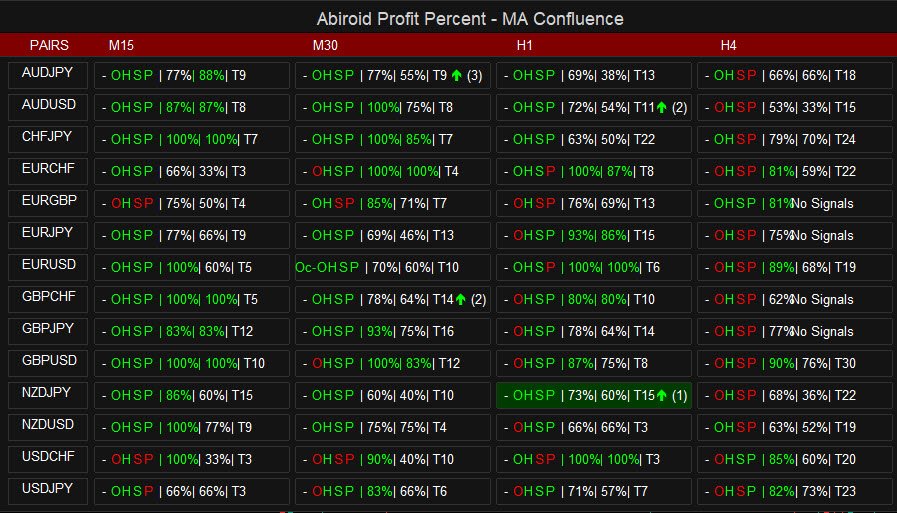
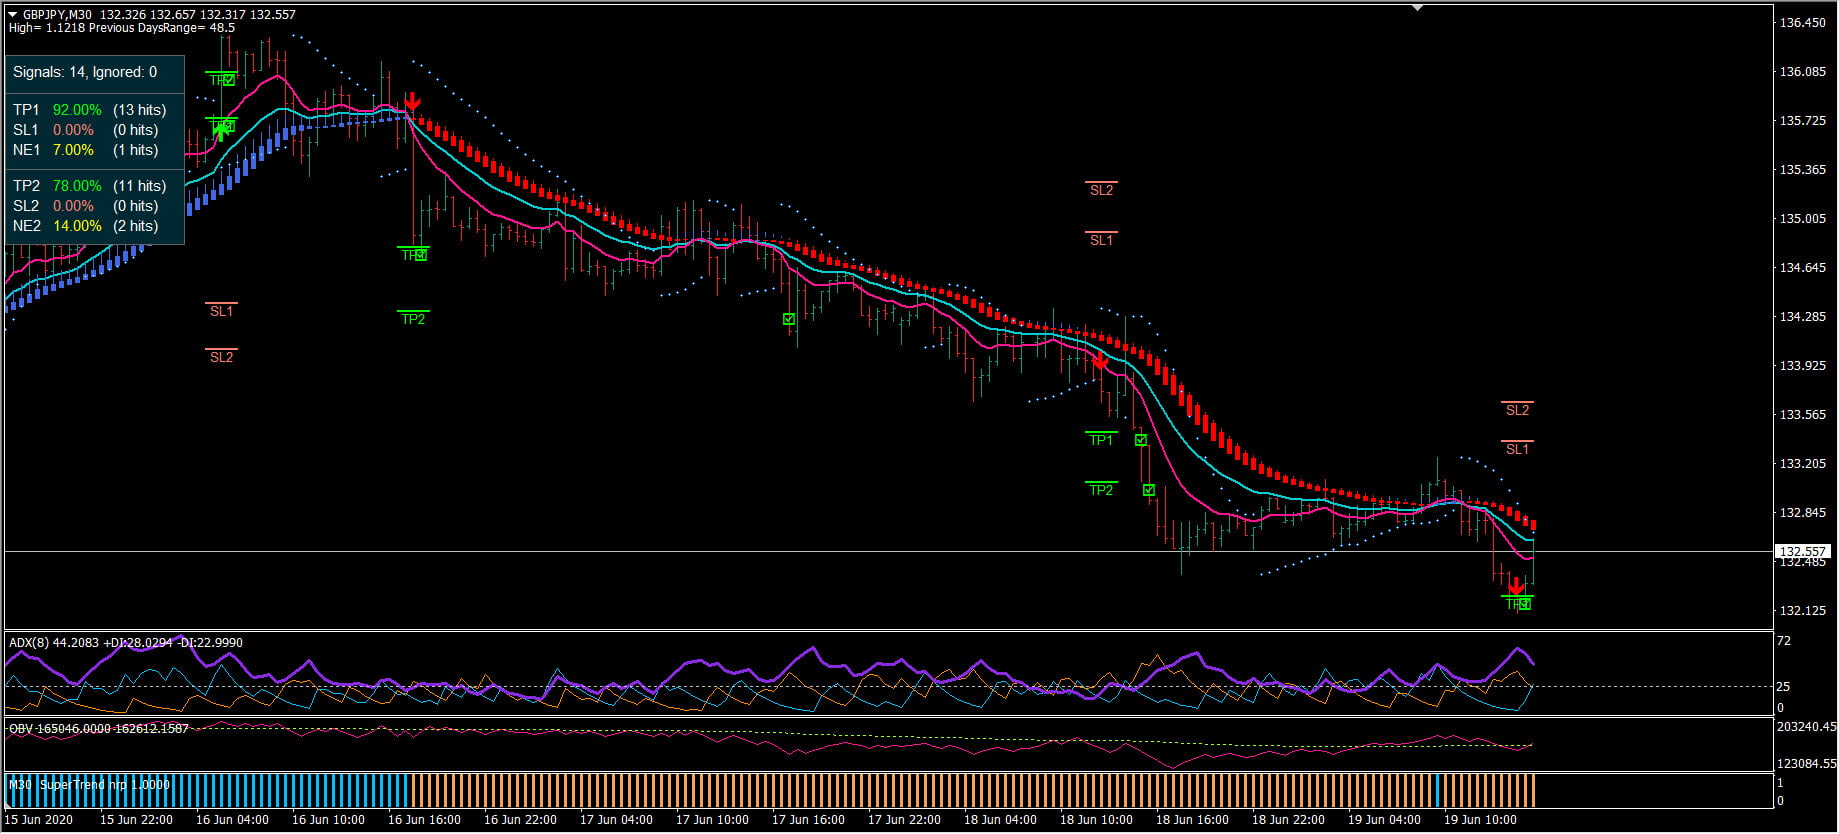
Profitable setup Example:
OBV Cross (Main Signal)
PSAR (Validating)
SuperTrend (Validating)
gives great percentages for Forex M15+ trade pairs.
If you have some great combinations that you have been experimenting with please share your settings and results in the Comments section below.
Thanks for Reading!


")
![[XAUUSD]: Weekly Liquidity Activation Points (timings), June 22-26, 2026](https://c.mql5.com/6/1013/splash-preview-771790.png "[XAUUSD]: Weekly Liquidity Activation Points (timings), June 22-26, 2026")
")