Session Opening Range
- Индикаторы
- Версия: 1.10
- Активации: 5

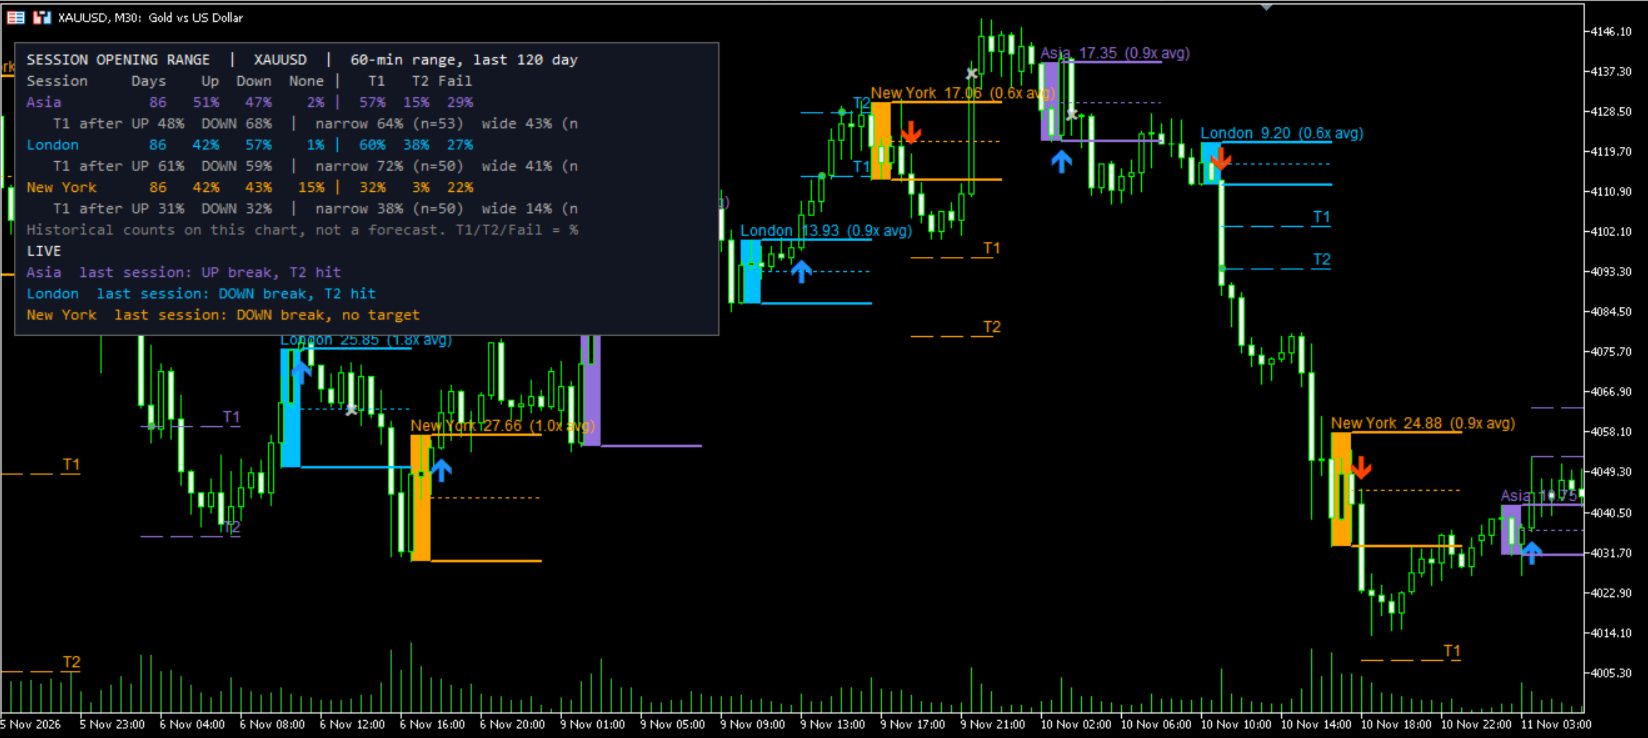
Session Opening Range measures the first part of each session and follows what price does with it for the rest of the session.
What it shows
- A box over the opening range of up to three sessions, with high, low and optional midline extended for the session.
- The first breakout candle: close or wick beyond the range, with an optional buffer.
- T1 and T2 target lines at 1x and 2x the range size (adjustable), and markers when they are reached.
- A failed-breakout marker when price closes back through the midline, or through the opposite side.
- A label with the range size and how it compares with the recent average ("1.4x avg").
- A statistics panel that counts, over the last N days, breakouts up and down, sessions with no breakout, and how many breakouts reached T1, T2 or failed. Narrow and wide ranges are counted separately. These are historical counts on your chart, not a forecast.
- Alerts on breakout, T1 and failure.
Daylight saving
By default, session start times are entered in each market's own local time: Tokyo 09:00, London 08:00, New York 09:30. They are converted to your broker's clock with automatic US and EU daylight-saving handling, so the sessions stay put in March and in October/November. Pick your broker's clock mode: New York +7 (GMT+2/+3), fixed UTC offset, or UTC offset with EU or US summer time. You can also type server times directly.
How it calculates
Calculated once per new candle from closed candles. Breakouts, targets and failures do not change after the candle closes. Use a chart timeframe no larger than the range length (M1 to M15 for a 60-minute range). The panel warns if the timeframe is too large.
Forex and gold
Works on forex majors and XAUUSD. For gold, many traders anchor the New York session to the COMEX open at 08:20 New York time: set Session 3 start to 08:20. Targets are multiples of each day's own range, so they scale automatically.
Inputs
Time reference, broker clock, winter offset.
Three sessions: enable, name, start time, active hours, colour.
Range length (minutes), breakout mode, buffer, failure rule, T1/T2 multiples, time shift.
Display: days drawn, statistics days, average length, box, midline, targets, labels, panel position, font. Alerts.
Notes
- This indicator does not open, modify or close trades. It is an analysis tool and not financial advice. Historical statistics describe the past on your chart and do not predict future results.
Questions and suggestions are welcome in the comments section of this product.