Kaufman Adaptive Trend Defense
- Индикаторы
- Версия: 1.0
- Активации: 5

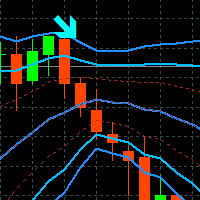
Kaufman Adaptive Trend Defense is a trend-following indicator that combines Kaufman’s Adaptive Moving Average (KAMA), adaptive RMS volatility bands and a Donchian structural channel into one adaptive trend defense line. When price closes through the defense line, the indicator prints a LONG or SHORT signal.
How it works
- KAMA adapts its speed to the market efficiency ratio. It is fast in clean trends and slow in sideways markets, and it is colored by the current trend regime.
- Adaptive RMS bands measure the root-mean-square displacement of price from KAMA. An ATR-based floor keeps them from collapsing in quiet markets.
- Donchian structure (fast and slow channels) is blended into the defense line. The more efficient the trend and the longer price stays on one side of KAMA, the more weight goes to the wider channel, so strong trends can survive deeper pullbacks.
- Trend defense line moves only in the direction of the trend and resets when the trend reverses.
- Signals appear when the close breaks the active defense line. Trend state updates only on closed bars, so confirmed signals do not repaint. The KAMA, bands and defense line of the still-forming bar move with price.
Features
- Trend-colored KAMA, adaptive bands with fill, and Donchian channel
- Bullish and bearish trend defense lines
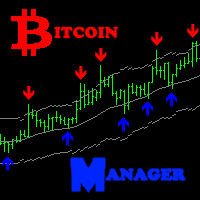
- LONG / SHORT arrows with text labels
- Optional candle coloring by trend
- Popup and push alerts on bar close
- Data Window values: efficiency ratio, RMS, band distance, price residence, structural weight, active defense and trend state
- Works on any symbol and timeframe
Inputs
Source, Efficiency Length, KAMA Fast/Slow Length, RMS Band Length, Band Multiplier, ATR Length, ATR Floor, Fast/Slow Channel Length, Residence Length, Structure Influence, visibility toggles, transparency settings, colors and alert options.
Notes
- To use candle coloring, set the standard chart candle colors to the background color (F8, Colors tab) so the original candles do not show through.
- Transparency is simulated by blending with the chart background color. If you change the background, re-attach the indicator.
- This is an analysis tool and does not guarantee profit. Test it on a demo account and use proper risk management.