Candlewise Pro
- Индикаторы
- Версия: 1.0
- Активации: 5

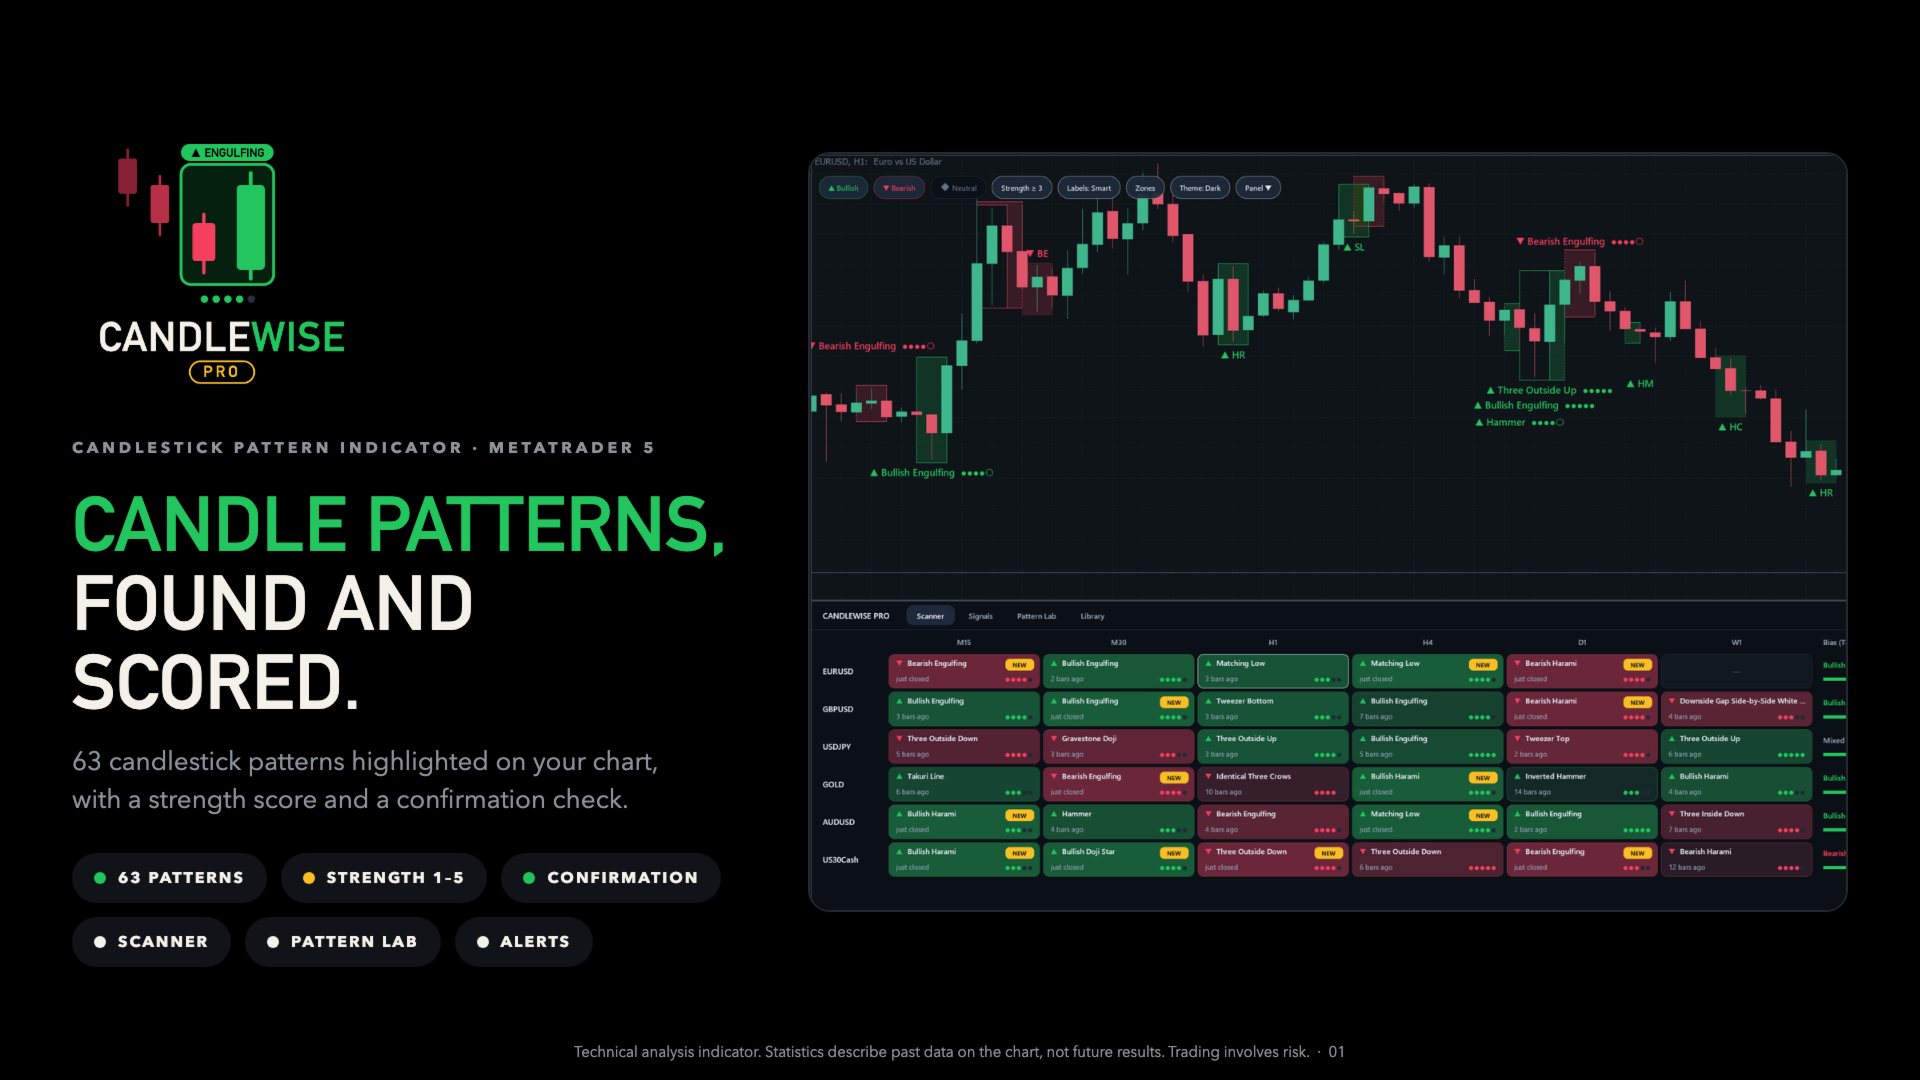
Candlewise Pro marks candlestick patterns on your chart. Each pattern gets a strength score from 1 to 5 and a status that shows whether the next candles confirmed it. A scanner watches your other symbols and timeframes, and the Pattern Lab shows how each pattern behaved on your own chart history.
What it does
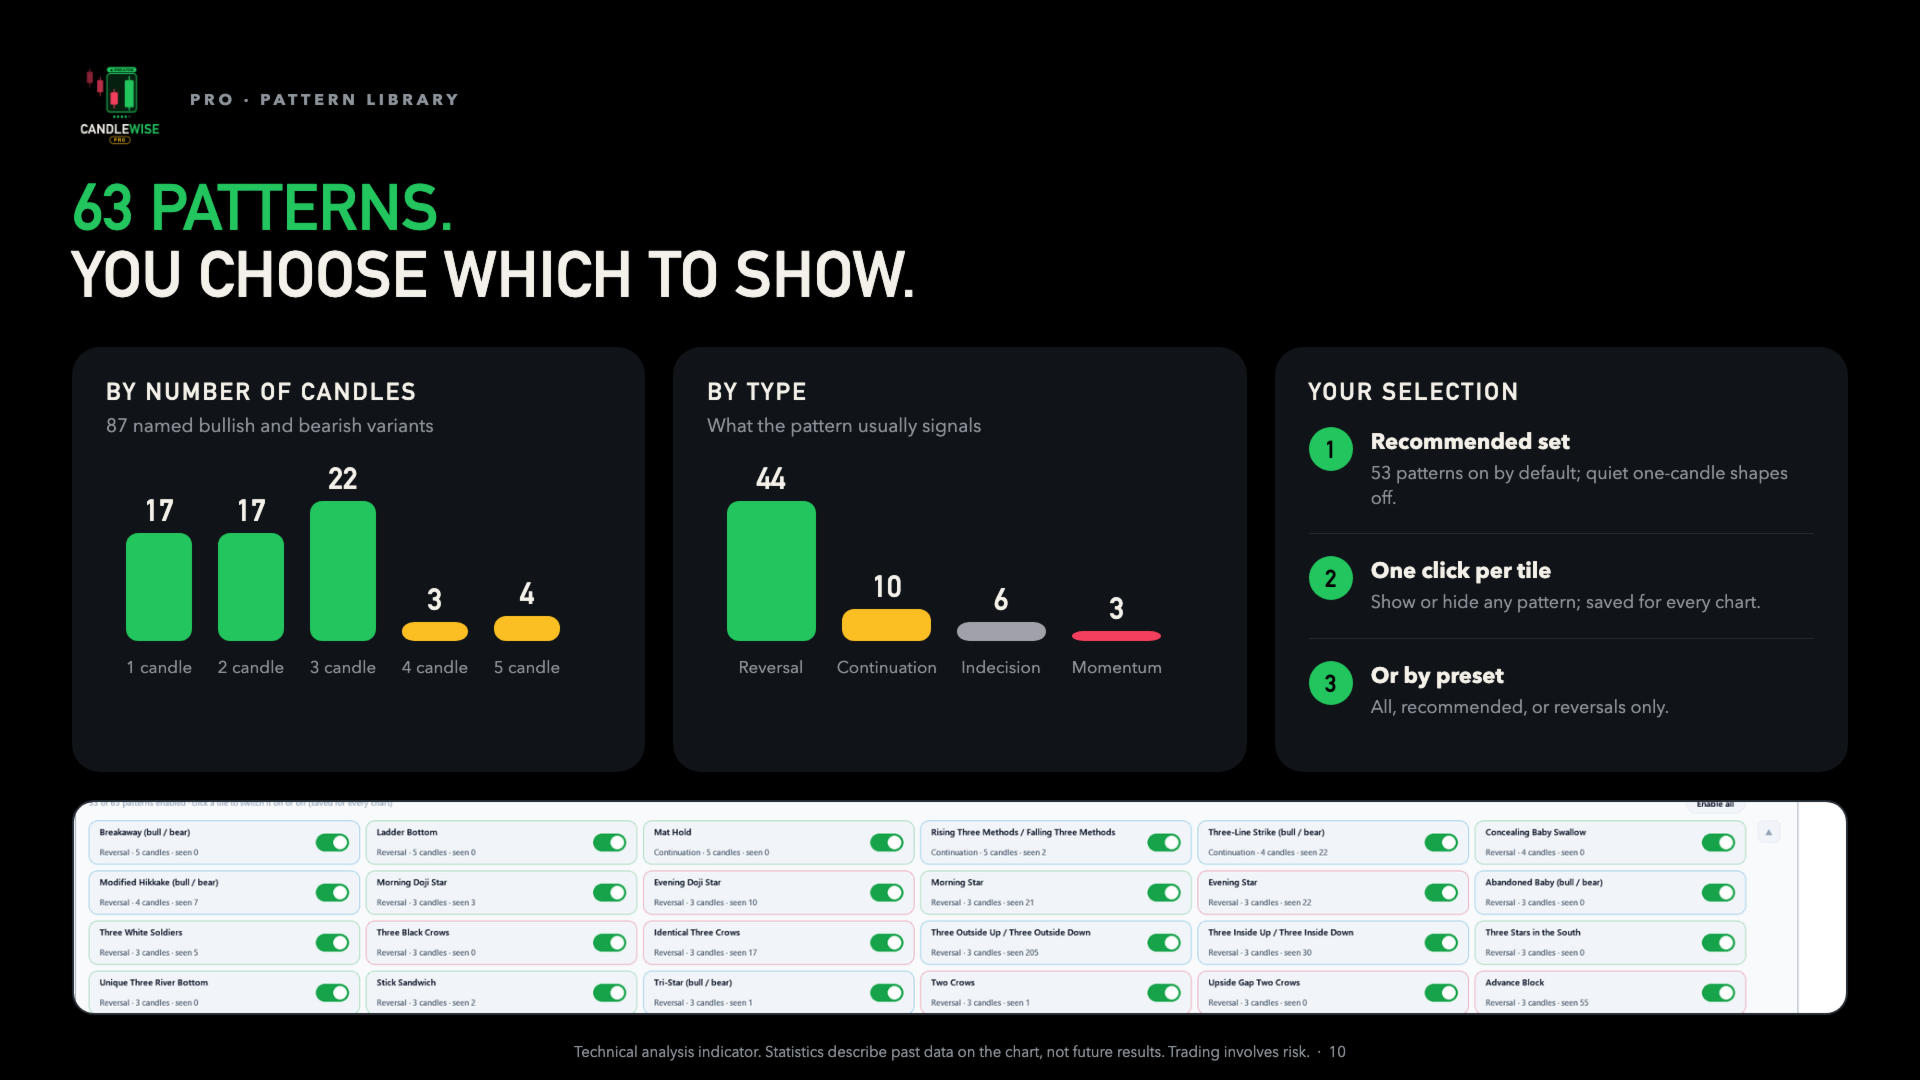
- Detects 63 candlestick patterns (87 named bullish and bearish variants) on closed candles.
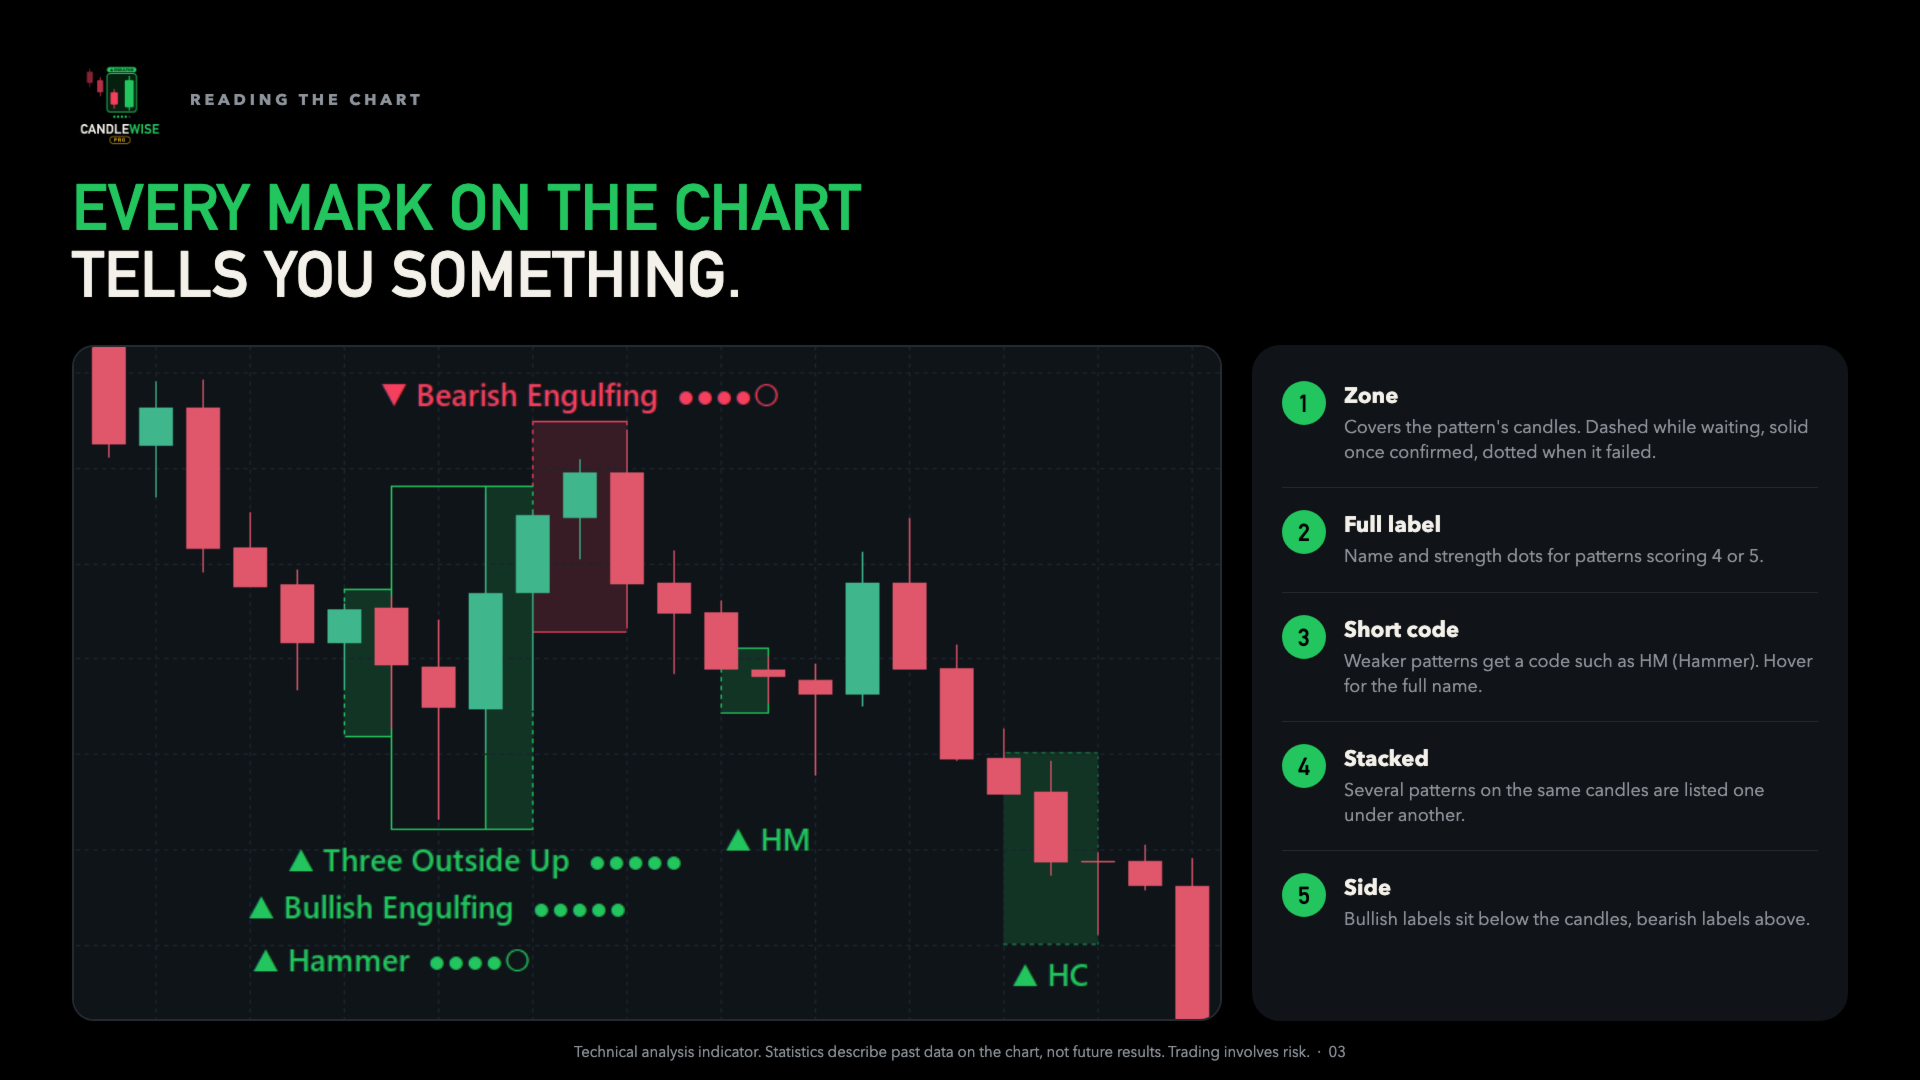
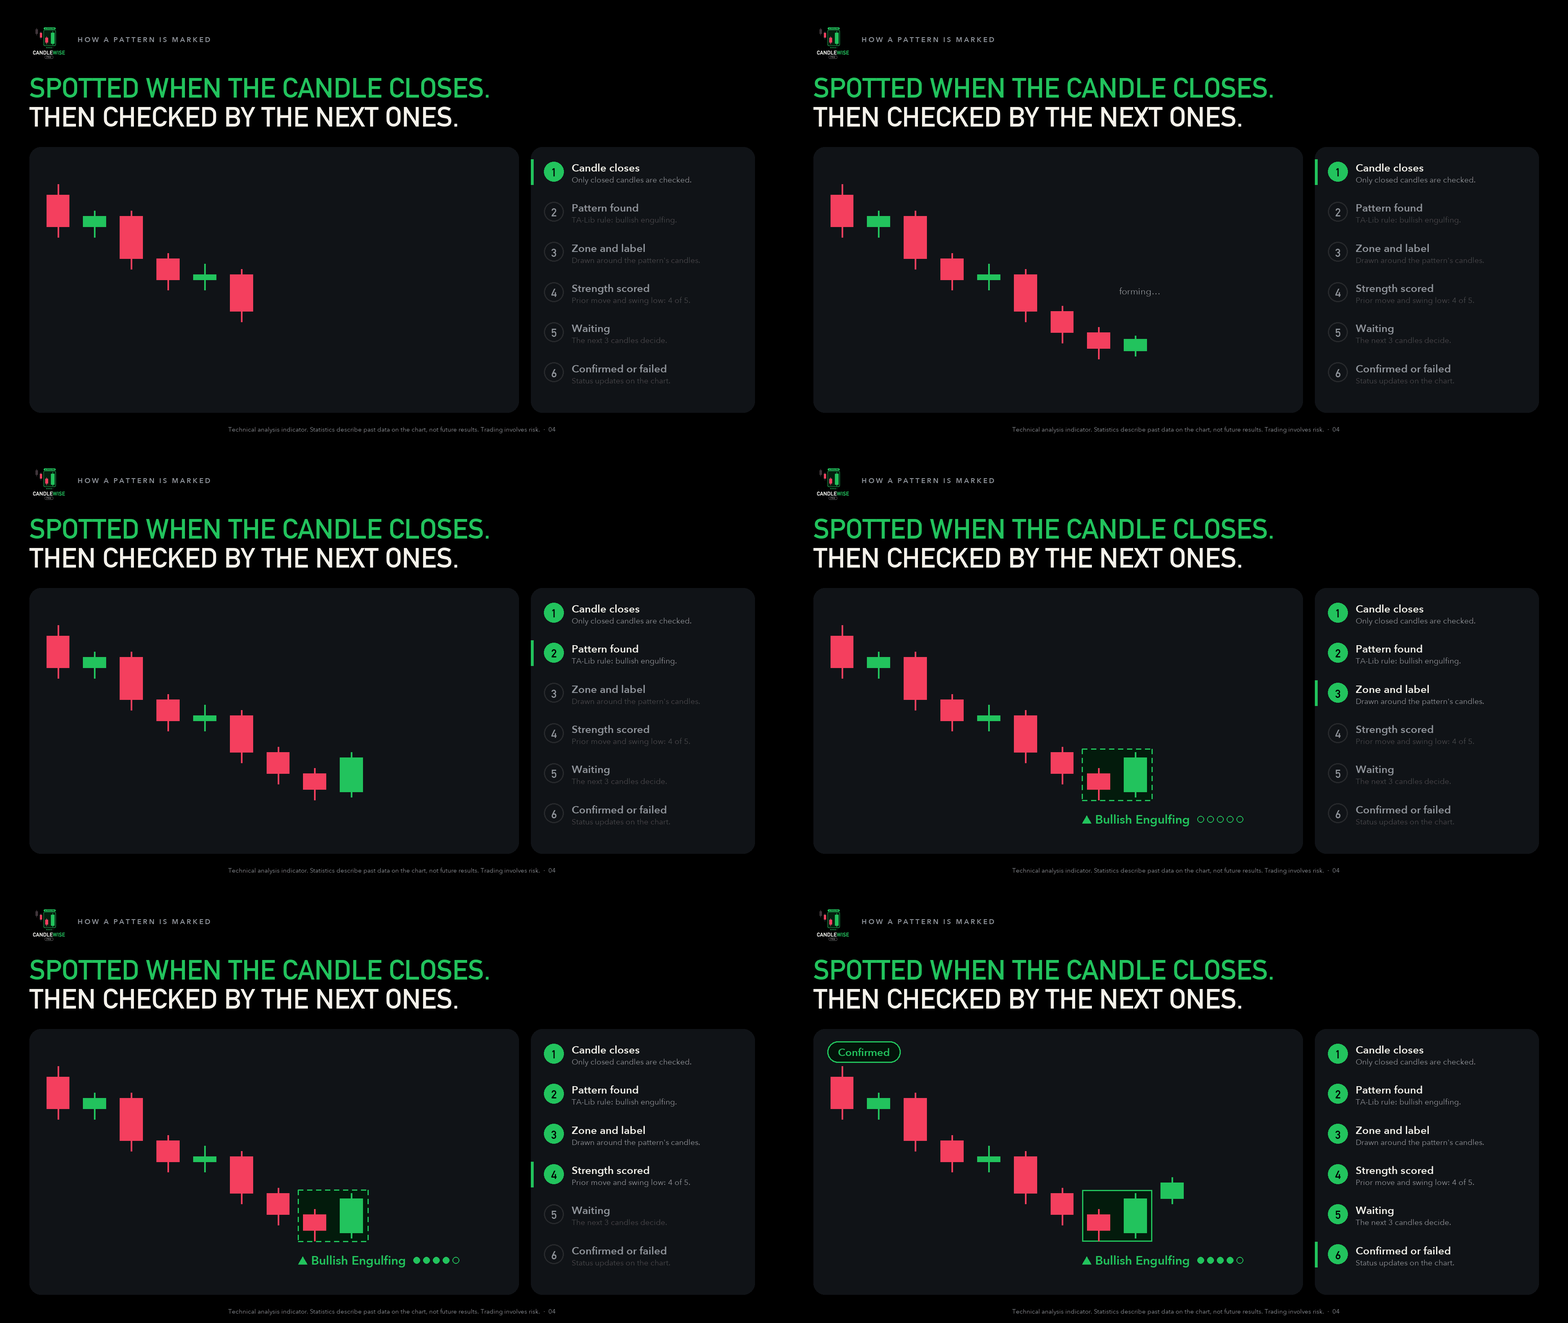
- Draws a zone around the pattern's candles and a short label in free space, so the candles stay visible.
- Scores each pattern 1 to 5 from its context: the move before it and whether it formed at a swing high or low.
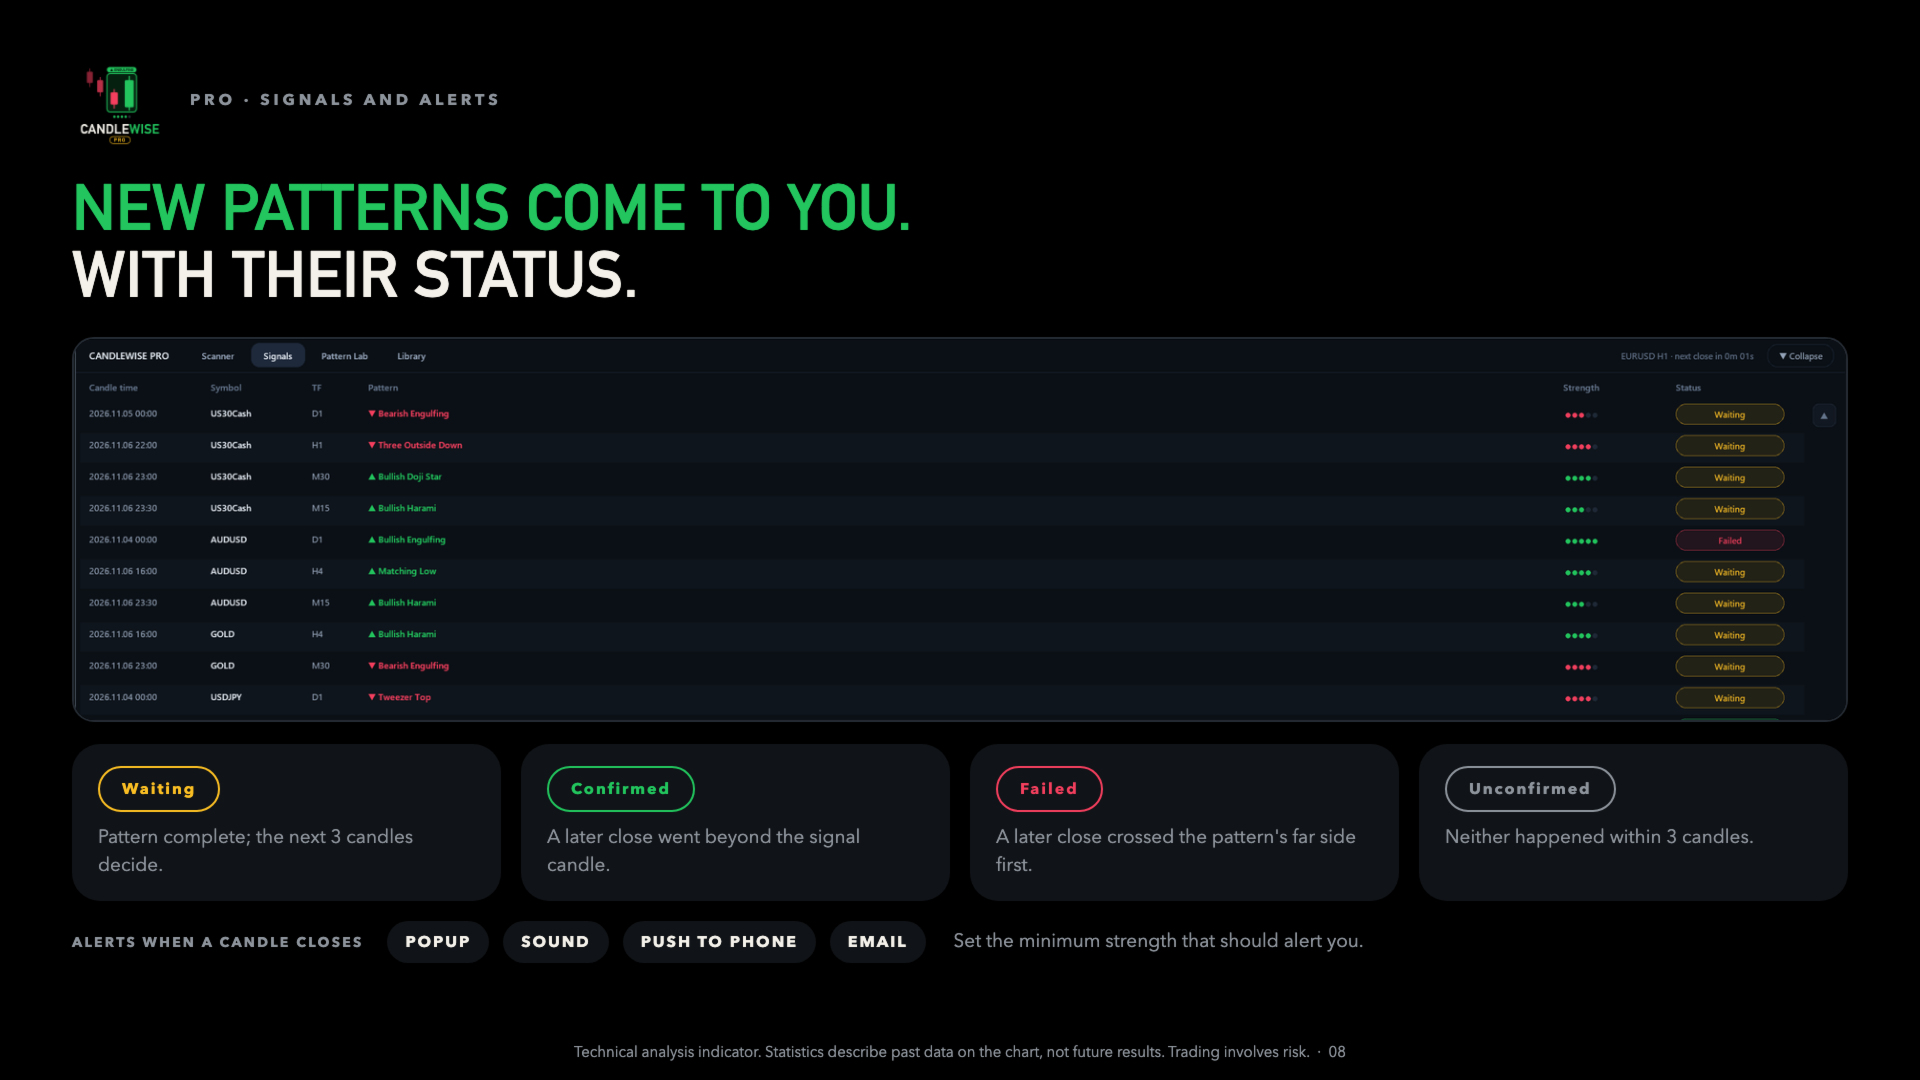
- Tracks every pattern for 3 candles: Waiting, Confirmed, Failed or Unconfirmed.
- Marks are placed on closed candles and do not disappear later. The optional preview on the open candle is labelled "(forming)" and can change until that candle closes.
Pattern rules
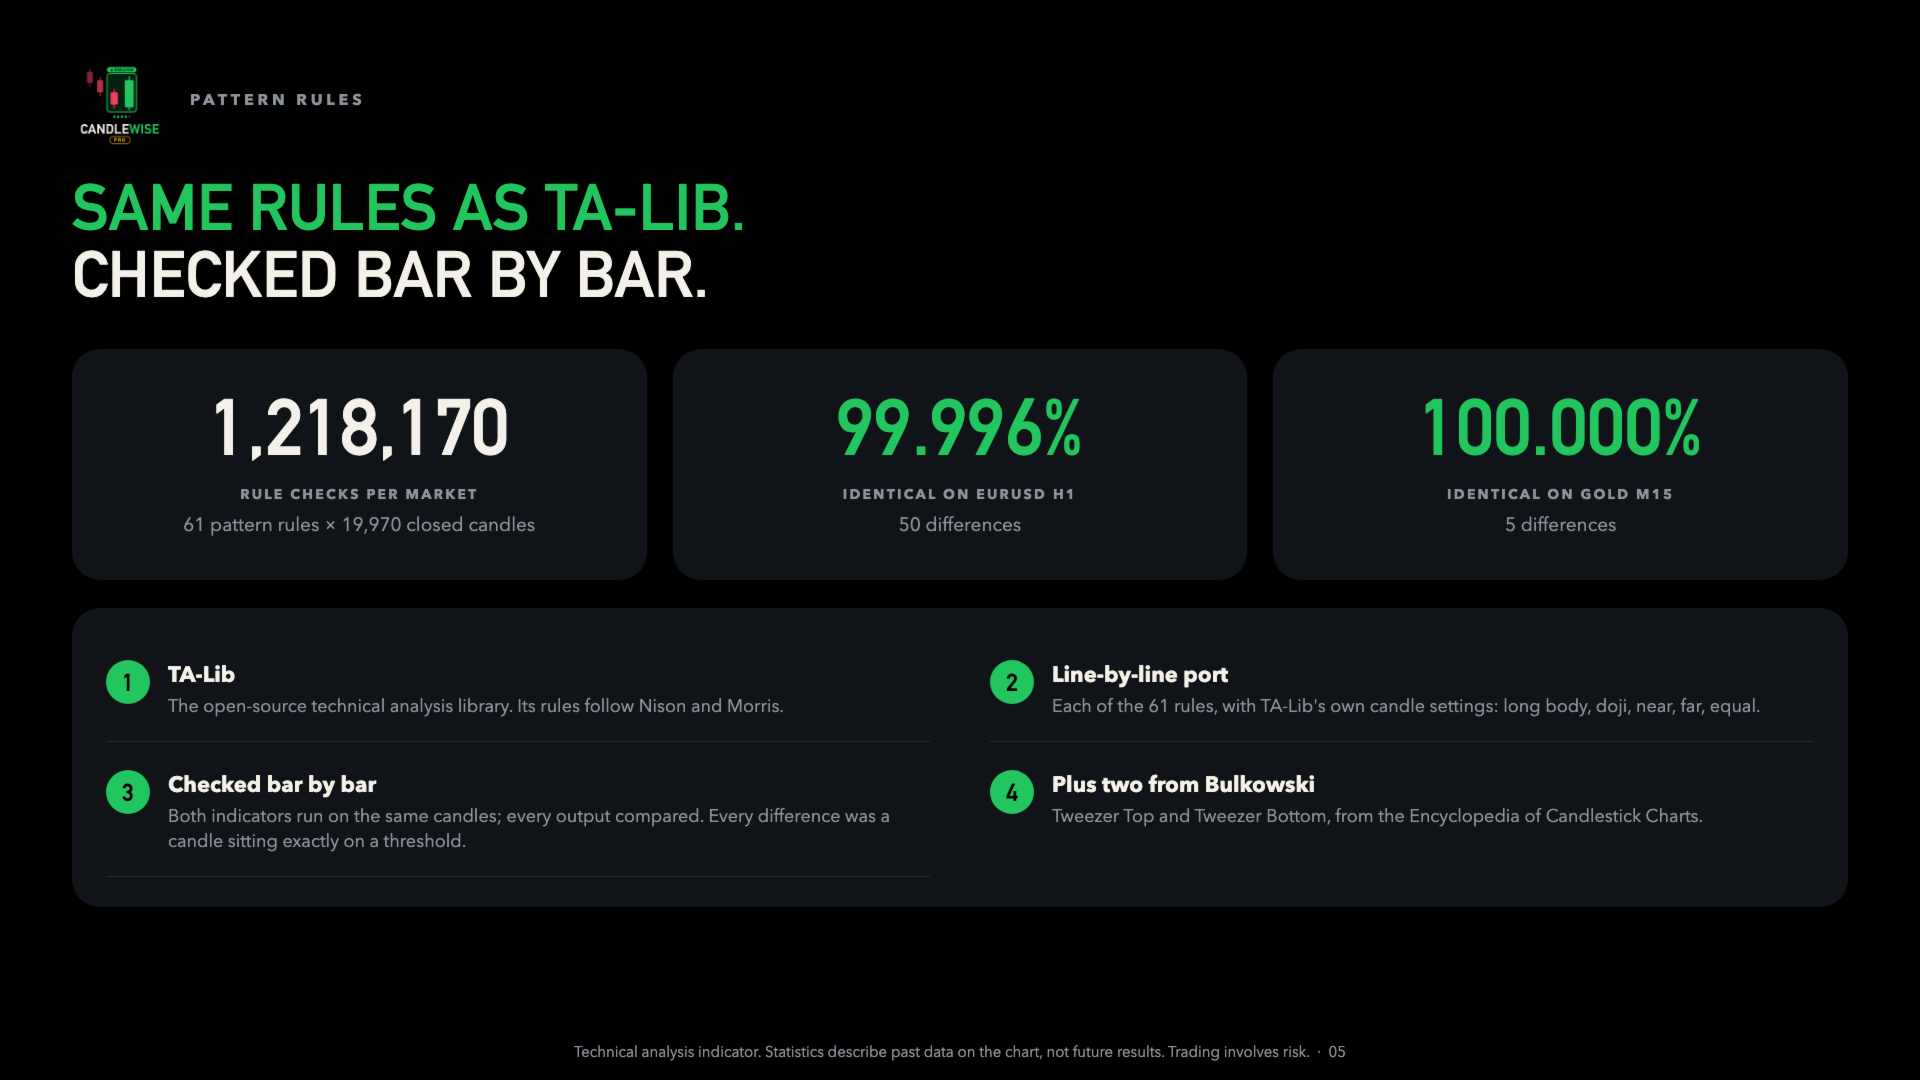
The 61 TA-Lib candlestick functions were ported line by line, using TA-Lib's own candle settings (long body, doji, near, far, equal). Tweezer Top and Tweezer Bottom follow Bulkowski's Encyclopedia of Candlestick Charts. Both indicators were run on the same 19,970 closed candles and every output was compared: 99.996% identical on EURUSD H1 and 100.000% on GOLD M15. Each remaining difference was a candle sitting exactly on a threshold.
Panel (opens below the chart)
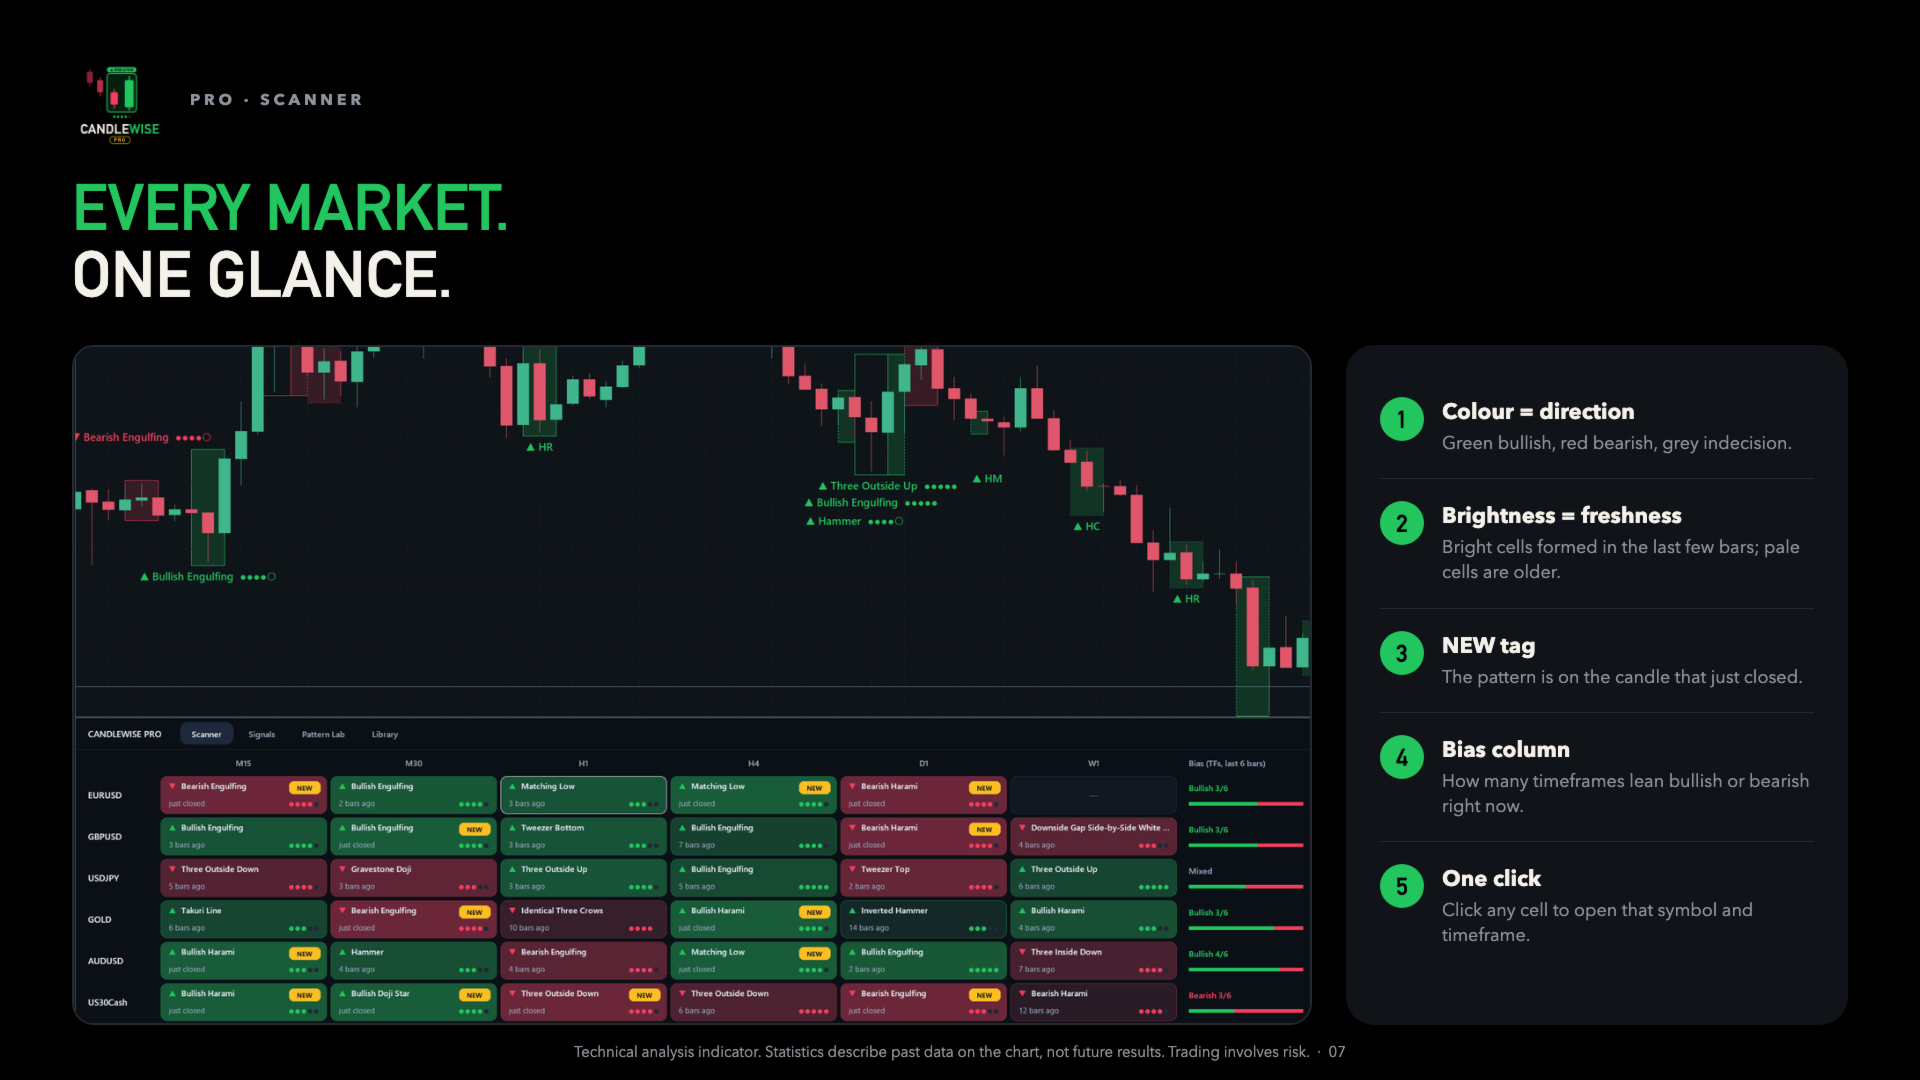
- Scanner: a grid of symbols by timeframes (default M15, M30, H1, H4, D1, W1). Each cell shows the latest pattern, its strength and how many bars ago it formed. A NEW tag marks the candle that just closed. A bias column counts how many timeframes lean bullish or bearish. Click a cell to open that symbol and timeframe.
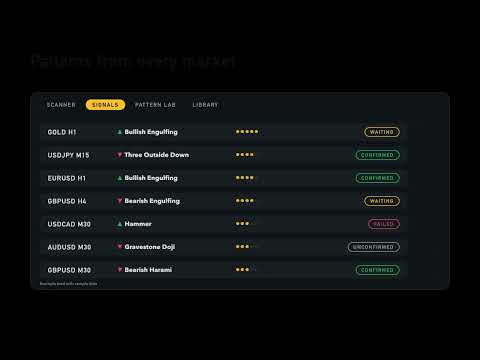
- Signals: a feed of recent patterns from all scanned markets, with strength and status.
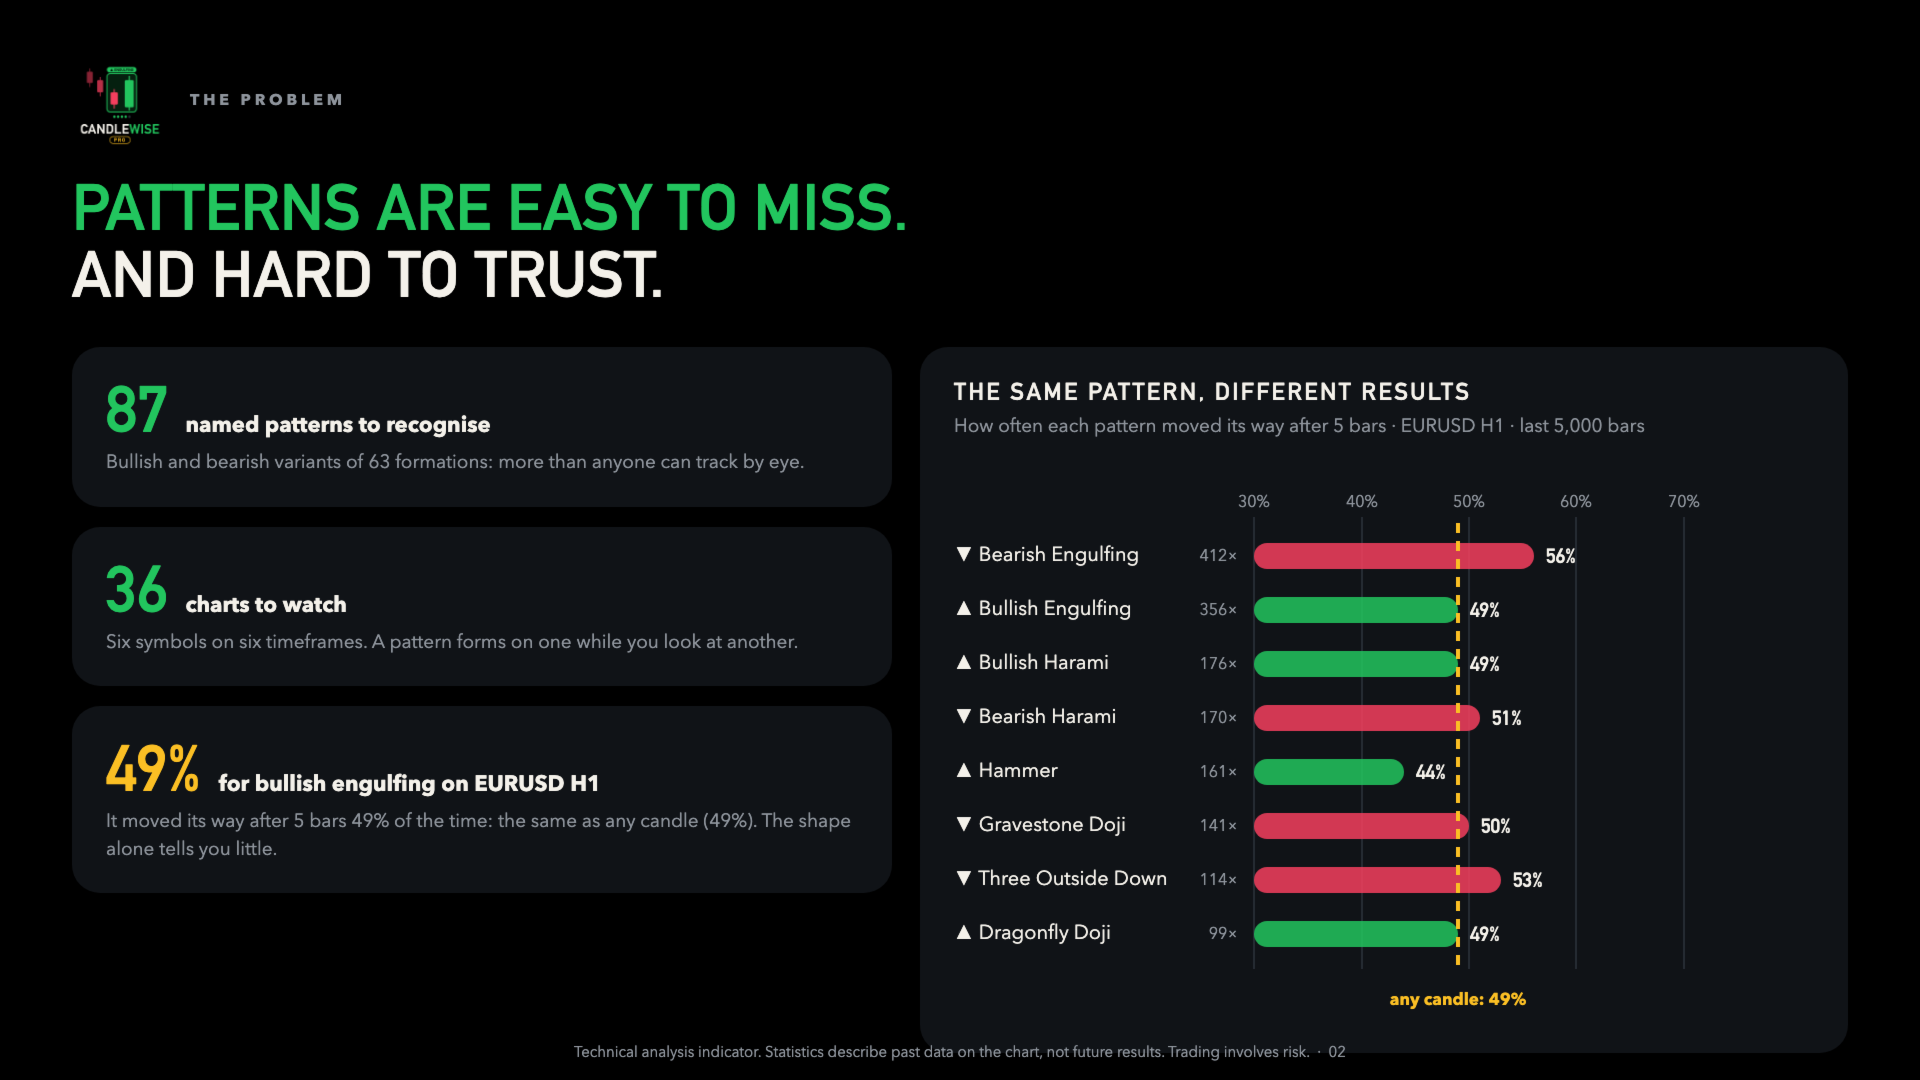
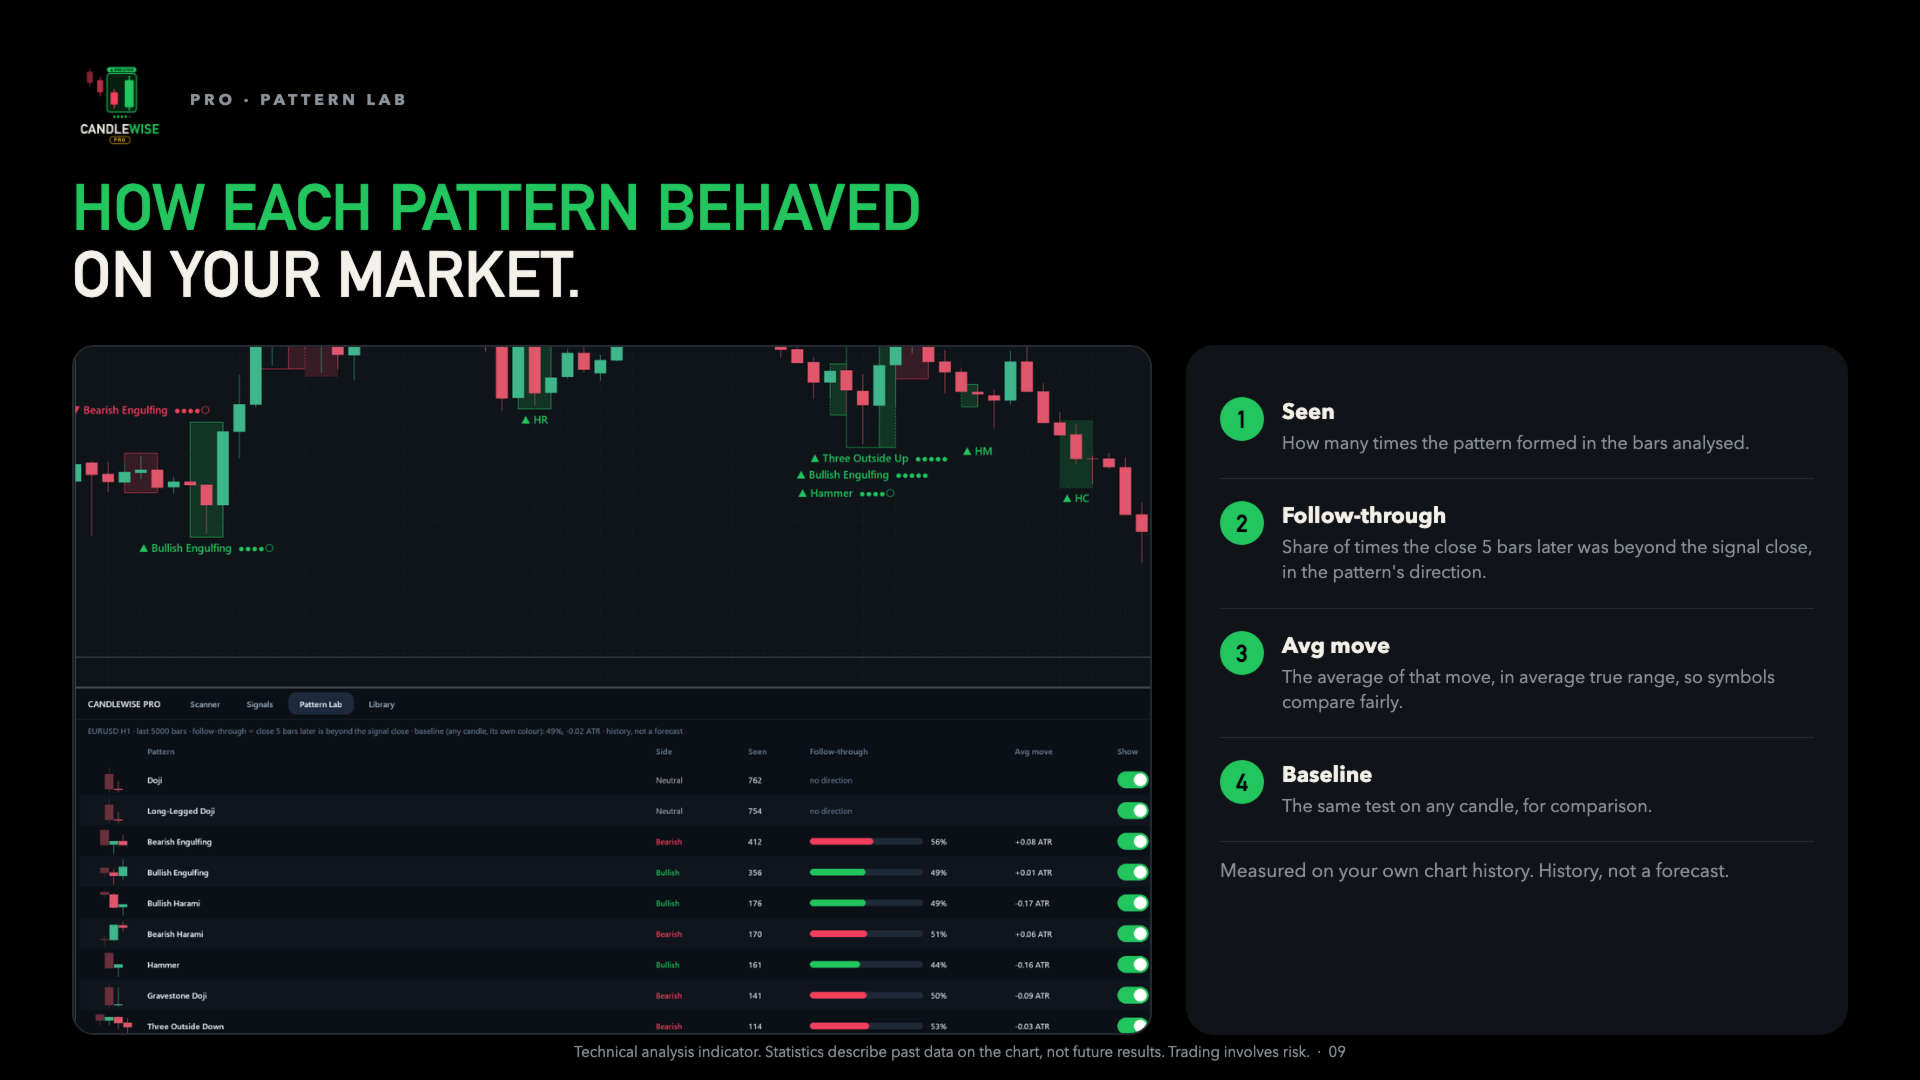
- Pattern Lab: for the chart's symbol and timeframe, how many times each pattern formed, how often the close 5 bars later was beyond the signal close in the pattern's direction, and the average move in ATR. A baseline shows the same test on any candle. These are counts from past bars, not a forecast.
- Library: turn each pattern on or off with one click, or pick a preset (recommended, all, reversals only). The selection is saved for every chart.
Pattern card
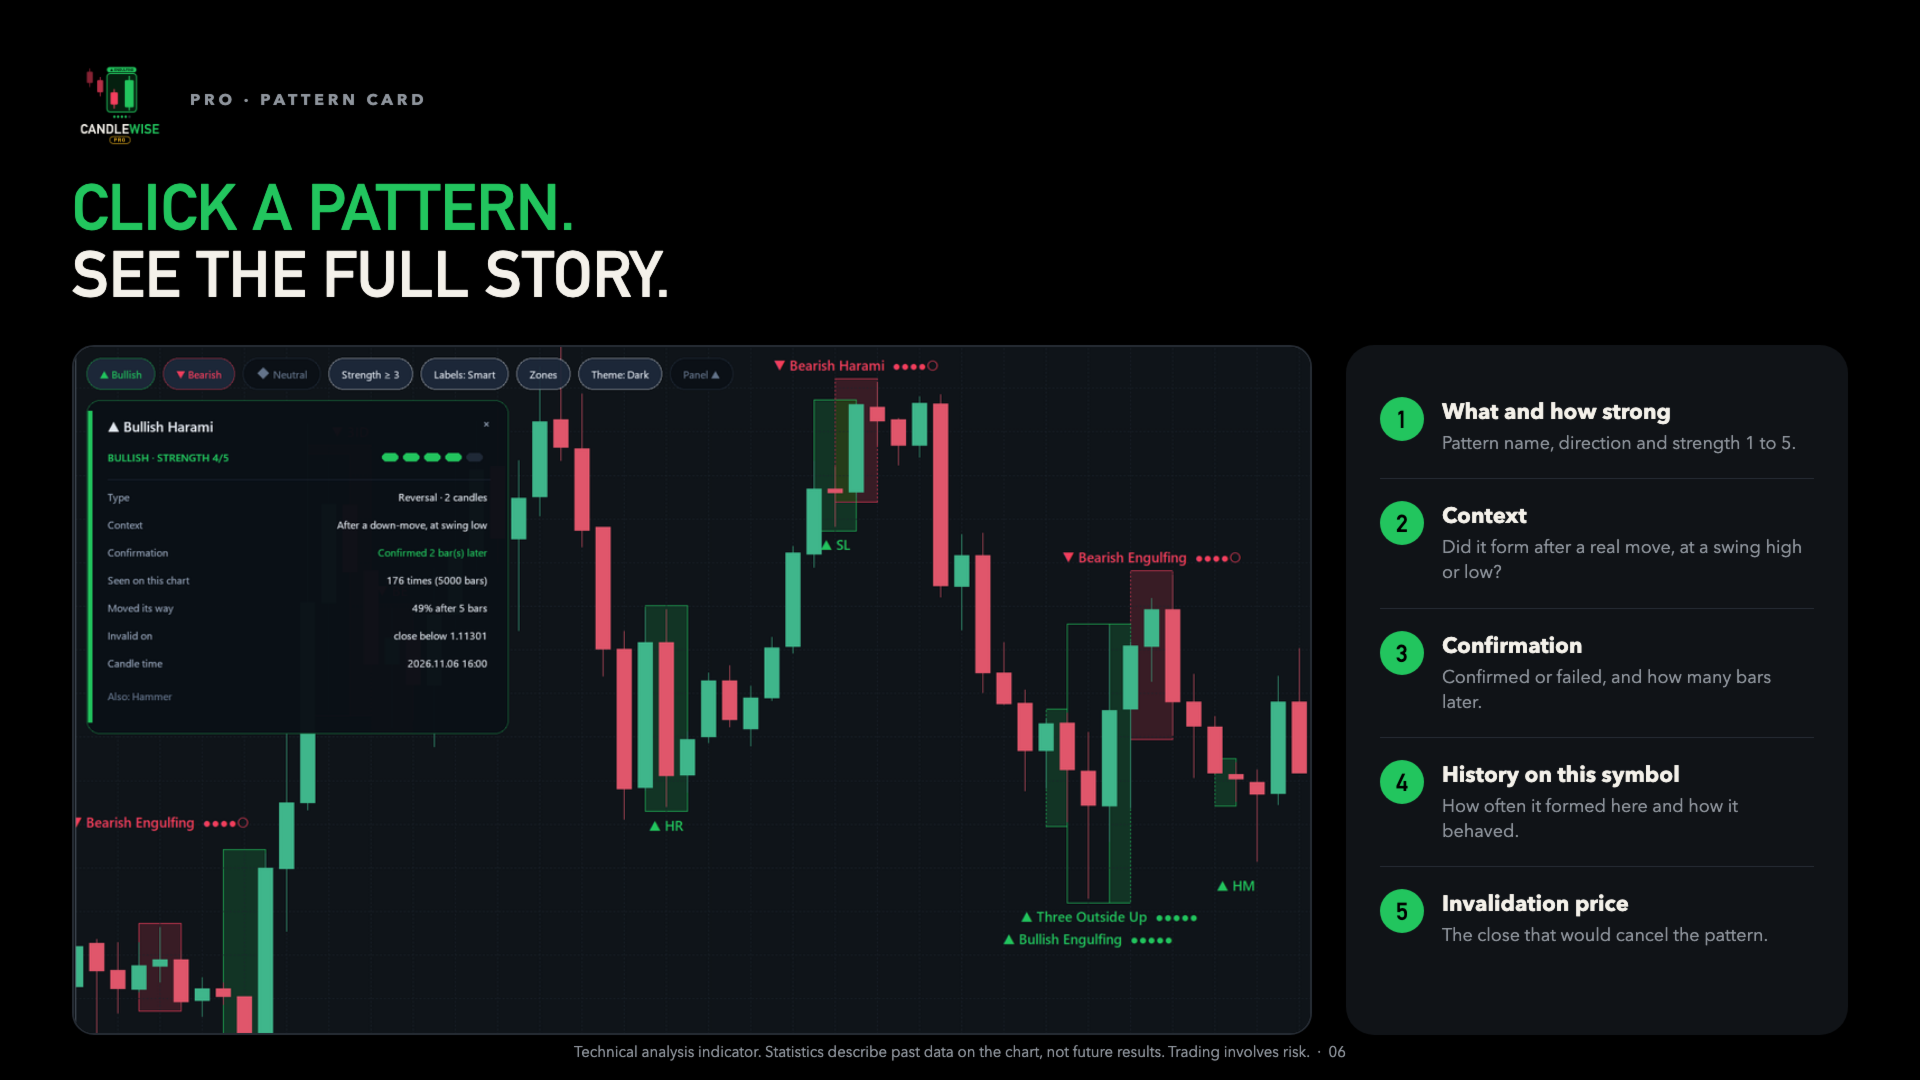
Click a pattern on the chart to see its name, direction, strength, context, confirmation status, history on this symbol, and the close that would invalidate it.
Alerts
When a candle closes with a pattern at or above your chosen strength: popup, sound, push notification to the MT5 mobile app, or email. Alerts can include the scanner markets.
For EA developers
Three buffers are available through iCustom on each closed candle: Signal (+1 bullish, -1 bearish, 0 none), Strength (1–5) and PatternId (0 = none).
Themes
Dark and light themes, or Auto to follow the chart background. The indicator can apply its colours to the chart; your original chart colours are restored when you remove it.
Main inputs
- Pattern set: My Library selection, Recommended, All 63, Reversals only
- Minimum strength shown (default 3); show bullish / bearish / indecision patterns
- Preview patterns on the open candle
- Bars to mark, labels (Smart, Full, Short, Off), zones on/off, label font size
- Theme (Auto, Dark, Light); apply theme colours to the chart
- Prior move look-back, swing look-back, confirmation window (bars)
- Pattern Lab: bars analysed (default 5,000), follow-through horizon (default 5 bars)
- Panel: show, height, first tab; scanner symbols (empty = Market Watch), timeframes, look-back
- Alerts: minimum strength (default 4), popup, sound, push, email, include scanner markets
Setup
- Attach Candlewise Pro to any chart. The panel opens below the chart on the Scanner tab.
- Leave "Symbols" empty to scan your Market Watch, or enter a comma list such as EURUSD,GBPUSD,GOLD.
- For push alerts, enter your MetaQuotes ID in Tools > Options > Notifications. For email, fill in Tools > Options > Email.
Important
This is a technical analysis tool. It shows where candlestick patterns formed and how they behaved in the past on your chart. It does not place trades and does not predict prices. Statistics in the Pattern Lab describe past data, not future results. Trading involves risk.
Support
Questions and feature requests: please use the comments on this page or send me a private message on MQL5.