MultiSymbol Harmonic Pattern Scanner
- Индикаторы
- Версия: 2.1
- Активации: 20

Overview
Multi-Symbol Harmonic Pattern Scanner is a MetaTrader 5 indicator (not an Expert Advisor) that finds XABCD harmonic patterns, draws them on your chart and tracks them across many symbols and timeframes in one dashboard. It never places trades. It only analyses price and shows what it finds.
It does three jobs at once:
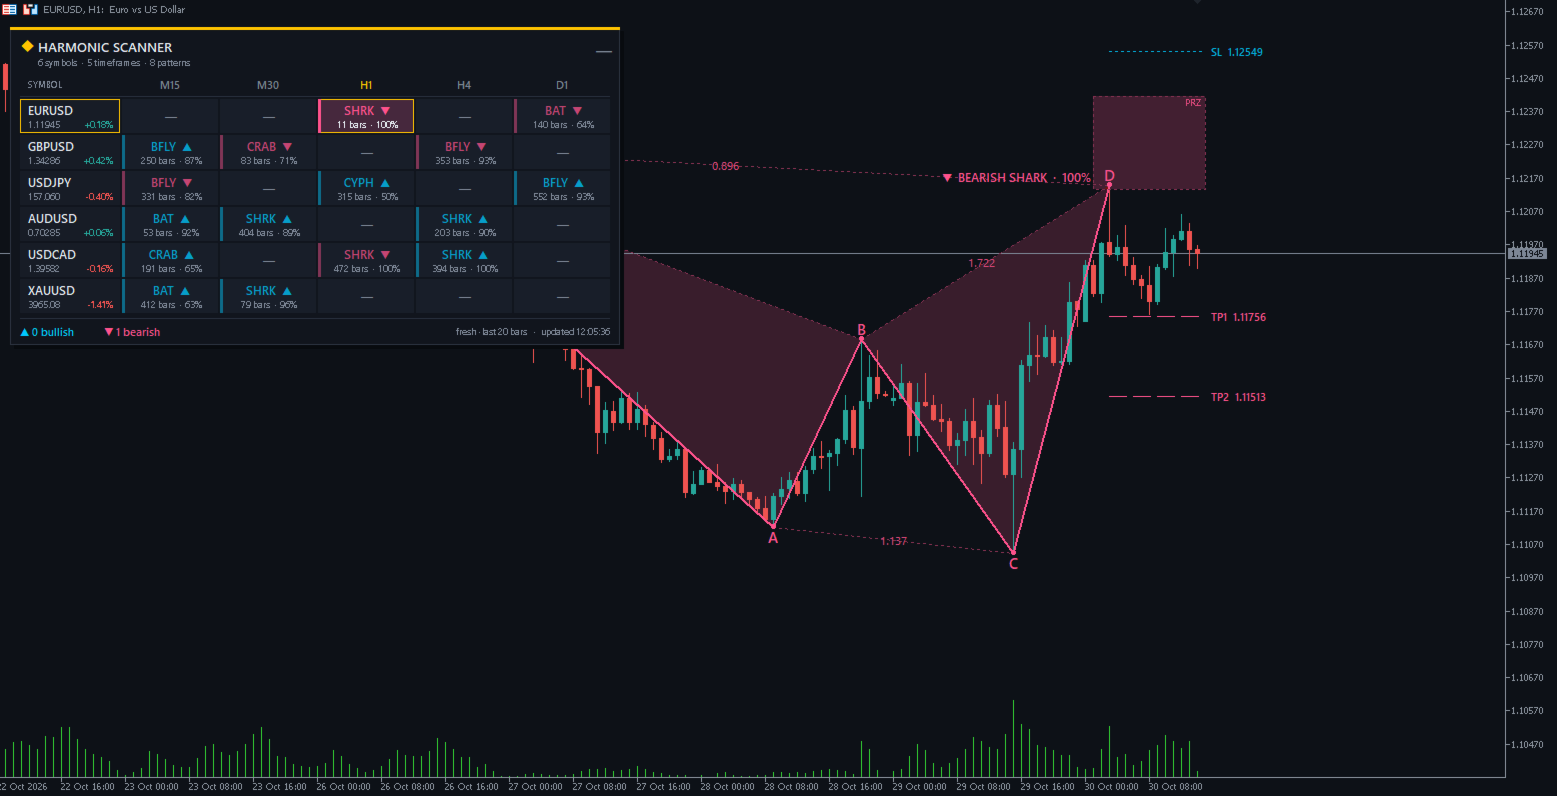
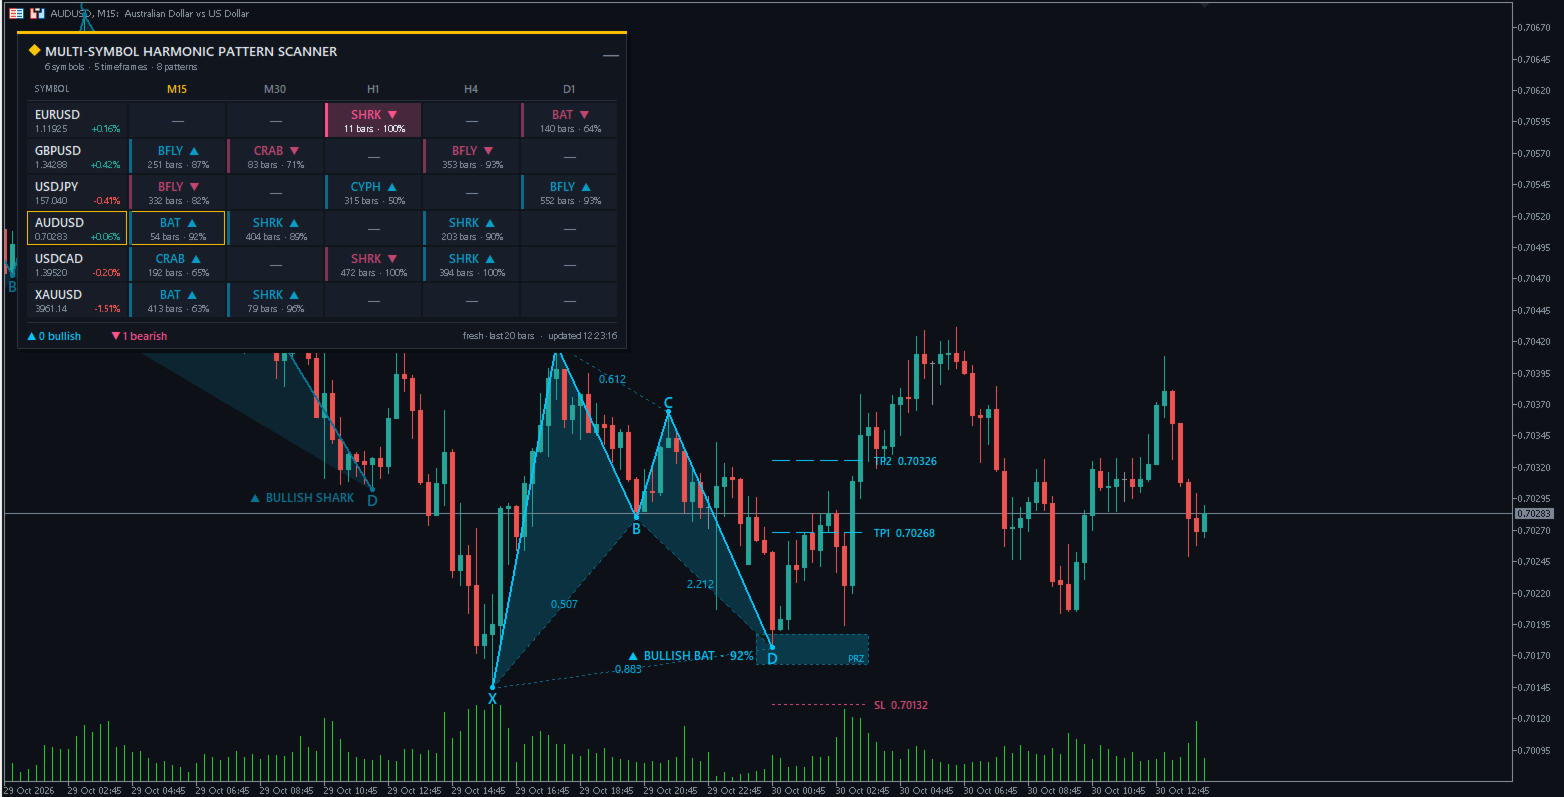
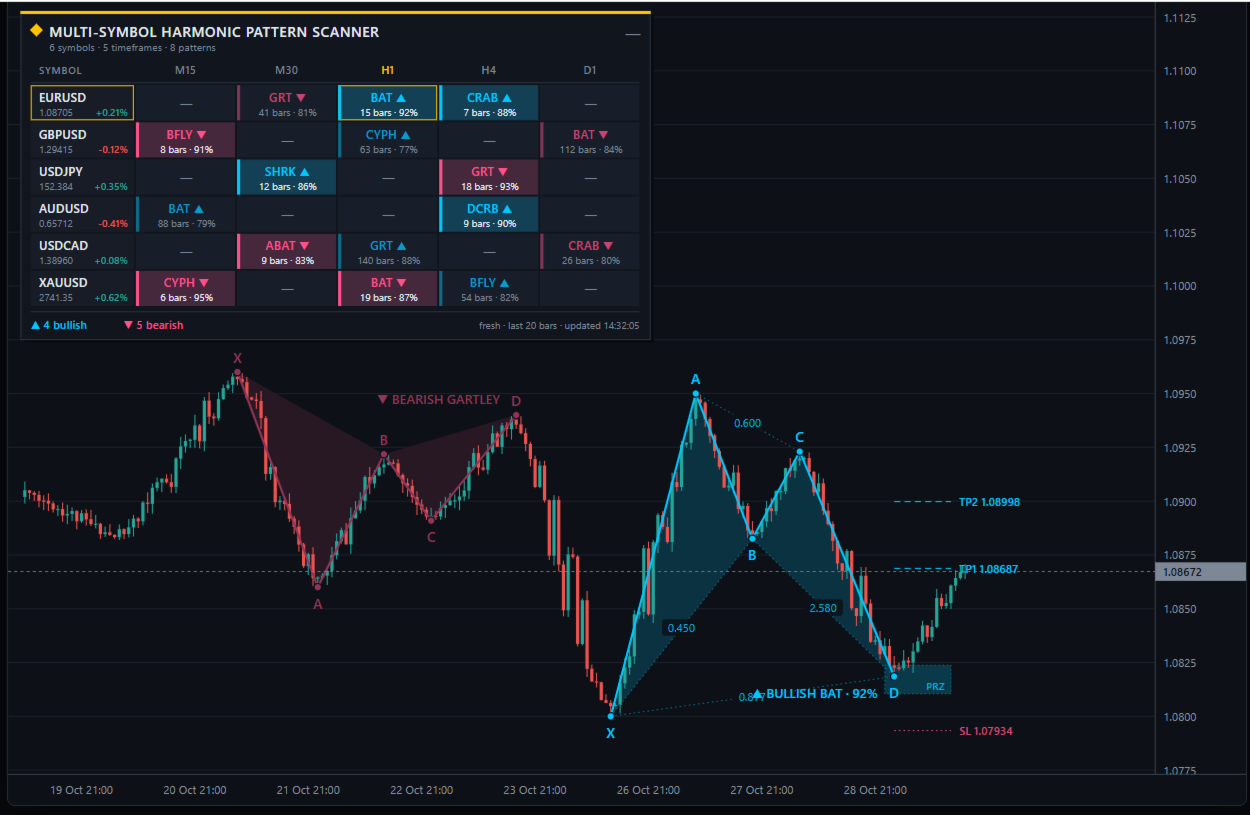
- Draws patterns on the current chart: the five swing points, shaded triangles, Fibonacci ratios, the Potential Reversal Zone (PRZ), a stop level and two targets.
- Scans your watch-list: every symbol and timeframe you choose is checked in the background. The latest pattern on each one is shown in a colour-coded table.
- Alerts you: a popup, push notification or sound when a new pattern completes on any scanned market.
It detects 8 patterns: Gartley, Bat, Alternate Bat, Butterfly, Crab, Deep Crab, Cypher and Shark.
How detection works
By default the scanner only uses swing points that are already confirmed, so a pattern never moves or disappears once it is drawn. Each symbol and timeframe goes through the same five steps:
- Load bars. The last 600 bars ( Bars analysed ) are read for the symbol and timeframe.
- Find swing points. A bar is a swing high if its high is above the 5 bars on each side of it ( Swing depth ). Swing lows work the same way. Highs and lows must alternate, and if two of the same kind come in a row, the more extreme one is kept.
- Test every five-point sequence. Each run of five swings in a row becomes a candidate X, A, B, C, D. If D is a low, the pattern is bullish. If D is a high, it is bearish.
- Check the ratios. The candidate's Fibonacci ratios are compared with every enabled pattern, allowing ±5% either side of each range ( Ratio tolerance ).
- Keep the best fit. If several patterns match, the one with the highest fit score wins. The score is 100% when every ratio sits inside its ideal range. It falls towards 0% as ratios drift to the edge of the tolerance. The D ratio counts twice because it sets the reversal point.
Why patterns appear a few bars late. A swing point is confirmed only once 5 more bars have closed after it, so a new pattern shows up about 6 bars after D actually formed. A smaller Swing depth (such as 3) shows patterns sooner but finds noisier swings.
Live mode. If Allow unconfirmed D is on, the latest unconfirmed high or low is used as D. Patterns appear sooner, but they can repaint: D may move, or the pattern may vanish.
Supported patterns
The 8 patterns differ mainly in how deep B and D retrace. The ratios below follow Scott Carney's standard definitions, before the ±5% tolerance is applied. The code is the short name shown in the dashboard.
| Pattern | Code | B (AB/XA) | C (BC/AB) | CD/BC | D |
|---|---|---|---|---|---|
| Gartley | GRT | 0.618 | 0.382–0.886 | 1.272–1.618 | 0.786 of XA |
| Bat | BAT | 0.382–0.50 | 0.382–0.886 | 1.618–2.618 | 0.886 of XA |
| Alternate Bat | ABAT | 0.25–0.382 | 0.382–0.886 | 2.0–3.618 | 1.13 of XA |
| Butterfly | BFLY | 0.786 | 0.382–0.886 | 1.618–2.24 | 1.27–1.414 of XA |
| Crab | CRAB | 0.382–0.618 | 0.382–0.886 | 2.24–3.618 | 1.618 of XA |
| Deep Crab | DCRB | 0.886 | 0.382–0.886 | 2.0–3.618 | 1.618 of XA |
| Cypher | CYPH | 0.382–0.618 | C = 1.272–1.414 extension of XA | not checked | 0.786 of XC |
| Shark | SHRK | 0.382–0.886 | 1.13–1.618 | 1.618–2.24 | 0.886–1.13 of XA |
Patterns with D beyond 1.0 of XA (Alt Bat, Butterfly, Crab, Deep Crab) complete beyond point X. You can switch each pattern on or off in the Patterns input group.
Reading the chart
Recent patterns are drawn with full detail. Older ones fade into the background so the newest setup stands out. A pattern counts as recent if it is the latest one on the chart, or if D formed within the last 20 bars.
| Element | What it shows |
|---|---|
| Solid legs | The X→A→B→C→D path, in the bullish or bearish colour |
| Shaded triangles | The XAB and BCD halves of the pattern, drawn behind the candles |
| Dots and letters | The five swing points, with their letters above highs and below lows |
| Dotted diagonals | The Fibonacci ratios: XB, AC, BD and XD (on a Cypher, the D ratio of XC sits on the CD leg) |
| Name badge | Direction, pattern name and fit score, e.g. ▲ BULLISH BAT · 94% |
| PRZ box | The Potential Reversal Zone: the price band where the D ratio is valid, extended 12 bars to the right |
| TP1 / TP2 | Targets at 0.382 and 0.618 of the A→D move, measured back from D |
| SL | A stop beyond the far edge of the PRZ, by 13% of the A→D move |
Colours. Each theme has its own bullish and bearish colours: cyan and pink in Midnight, blue and orange in Graphite, and dark blue and red in Ivory. You can replace them with the two colour inputs. The stop line uses the opposite colour so it never blends in with the targets.
The targets and stop are reference levels, not trading advice. Check them against your own risk rules.
The dashboard
The dashboard is a grid with one row per symbol and one column per timeframe. Each cell shows the most recent pattern on that market, so you can see your whole watch-list at a glance.
- Header. Shows the title and how many symbols, timeframes and patterns are being scanned. Click — (or the title) to collapse the panel to one bar, and + to open it again.
- Symbol column. Shows each symbol with its current bid and today's change, in green or red. Click a symbol to show it on this chart at the current timeframe.
- Pattern cells. Each one has two lines, for example BAT ▲ over 15 bars · 94% : the pattern code and direction, then how many bars ago D formed and the fit score. Click a cell to switch the chart to that symbol and timeframe. Hover over it to see the PRZ and all four ratios.
- Footer. Counts the fresh bullish and bearish patterns and shows the time of the last scan.
| Cell look | Meaning |
|---|---|
| Tinted background, bright strip on the left | Fresh pattern: D formed within the last 20 bars ( Fresh if D within ) |
| Plain background, dim strip | Older pattern, still the latest on that timeframe |
| — | No pattern found in the bars analysed |
| ··· loading | History is still downloading; it retries on the next scan |
| N/A | Your broker does not offer this symbol (check Symbol suffix ) |
| Gold outline | The symbol and timeframe currently open on this chart |
The scanner runs every 30 seconds, but it only re-checks a market when that market has a new bar, so it stays light even with large watch-lists.
Inputs reference
The defaults suit forex and gold on M15 to D1. Most traders only need to change the symbols, the timeframes and possibly the theme.
| Group | Input | Default | What it does |
|---|---|---|---|
| Look & feel | Theme | Midnight | Colour scheme: Midnight, Graphite or Ivory (light) |
| Look & feel | Restyle chart | true | Applies the theme to the chart background and candles, and restores your colours on removal |
| Look & feel | Bullish / Bearish color | None | Overrides the theme's pattern colours; None keeps the theme |
| Detection | Swing depth | 5 | Bars on each side that confirm a swing point |
| Detection | Bars analysed | 600 | History scanned per symbol and timeframe |
| Detection | Ratio tolerance (%) | 5 | How far a ratio may sit outside its ideal range |
| Detection | Allow unconfirmed D | false | Uses the live swing as D; faster but repaints |
| Patterns | Gartley … Shark | true | Turns each of the 8 patterns on or off |
| Chart drawing | Draw patterns | true | Draws patterns on the current chart |
| Chart drawing | Max patterns drawn | 8 | Most recent patterns kept on the chart |
| Chart drawing | Shade triangles / Shading strength | true / 18% | Shades the triangles and sets how strong the tint is |
| Chart drawing | Leg line width | 2 | Thickness of the X→D legs |
| Chart drawing | Show ratios / PRZ / targets | true | Turns each overlay on or off |
| Chart drawing | SL distance (% of AD) | 13 | How far the stop sits beyond the PRZ |
| Chart drawing | Projection length | 12 bars | How far the PRZ box and level lines extend to the right |
| Chart drawing | Full detail on older patterns | false | Shows ratios, PRZ and levels on faded patterns too |
| Chart drawing | Chart label font size | 8 | Size of the ratio and level text |
| Dashboard | Show dashboard | true | Turns the panel and background scanning on or off |
| Dashboard | Symbols | EURUSD, GBPUSD, USDJPY, AUDUSD, USDCAD, XAUUSD | Watch-list, separated by commas |
| Dashboard | Symbol suffix | (empty) | Added to every symbol, e.g. .m or -ECN |
| Dashboard | Timeframes | M15, M30, H1, H4, D1 | Any of M1 to MN1, separated by commas |
| Dashboard | Fresh if D within | 20 bars | Age limit for a highlighted cell and for alerts |
| Dashboard | Rescan interval | 30 s | How often the watch-list is checked |
| Dashboard | Panel X / Y, column widths, cell height | 12, 28, 100, 96, 34 | Panel position and size in pixels |
| Alerts | Popup / Push / Sound | true / false / false | How you are told about new patterns |
| Alerts | Sound file | alert.wav | A file from the terminal's Sounds folder |
Alerts
An alert fires once when a new pattern completes on any dashboard market and its D formed within the fresh window. No alerts fire for patterns that already exist when the indicator loads, so restarting MT5 does not flood you.
Each message carries everything needed to judge the setup:
MSHP Scanner: Bullish Bat on EURUSD H1 | D=1.08171 | PRZ 1.08065-1.08377 | fit 94%
- Popup shows MT5's alert window and is on by default.
- Push sends the message to the MT5 mobile app. Enable it under Tools → Options → Notifications with your MetaQuotes ID.
- Sound plays the chosen file from the terminal's Sounds folder.
Every alert is also written to the Experts tab, so you keep a history of them. Alerts only cover the dashboard watch-list. Add the current chart's symbol to the list if you want