Volume Spread Flow MT5
- Индикаторы
- Версия: 4.21
- Активации: 10

Volume alone does not tell the whole story.
A high-volume candle can signal strong participation, absorption, exhaustion or simply increased activity. The real information comes from the relationship between Volume, Price Spread, Candle Structure and Market Context.
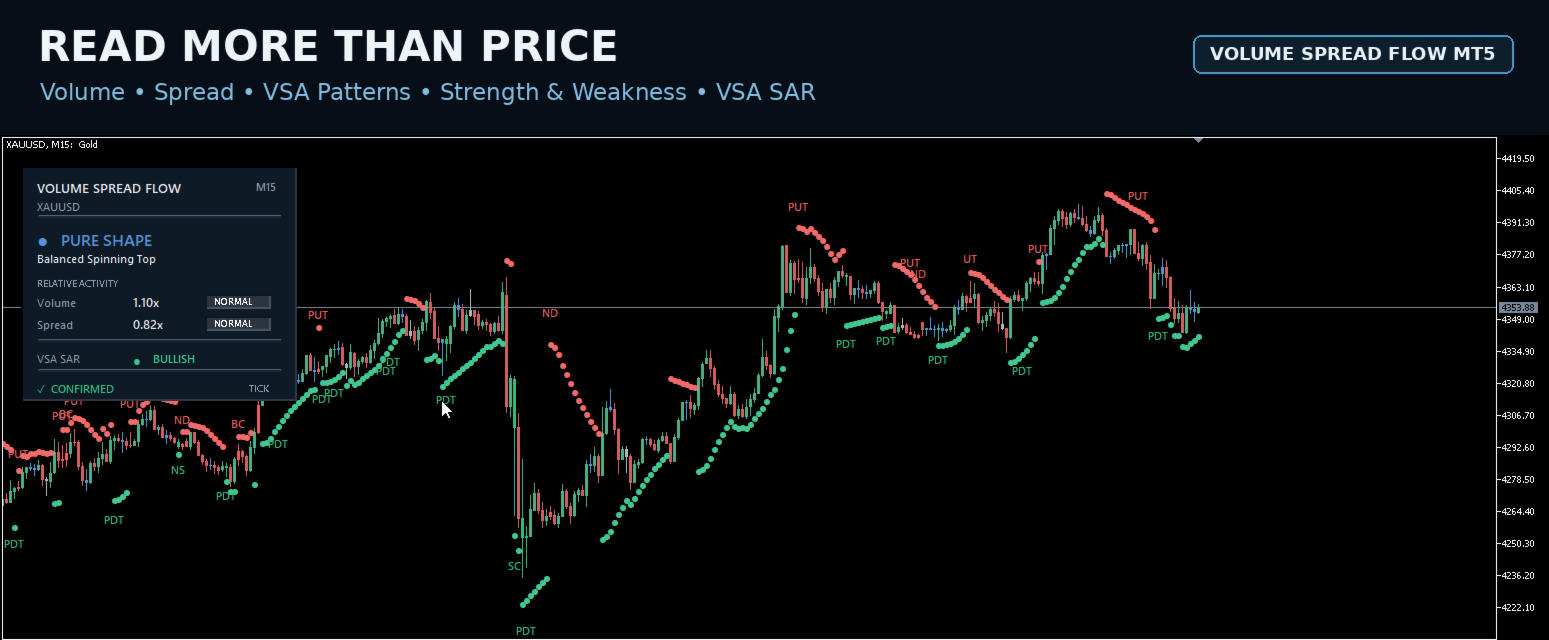
Volume Spread Flow MT5 brings these elements together in one clear visual workspace, automatically analyzing every bar through a structured Volume Spread Analysis (VSA) framework.
Instead of manually comparing candles and volume bars, the indicator identifies relevant VSA conditions, classifies them as Strength or Weakness, measures relative Volume and Spread, and displays the current market condition directly on your MetaTrader 5 chart.
See what is happening behind the candle
Volume Spread Flow analyzes the interaction between:
- Volume — market activity during the bar
- Spread — the full High-to-Low range of the candle
- Candle structure — body, upper/lower wick and close position
- Relative activity — Volume and Spread compared with their recent averages
- VSA patterns — conditions associated with Strength or Weakness
The result is presented directly on the chart without forcing the trader to interpret raw volume data manually.
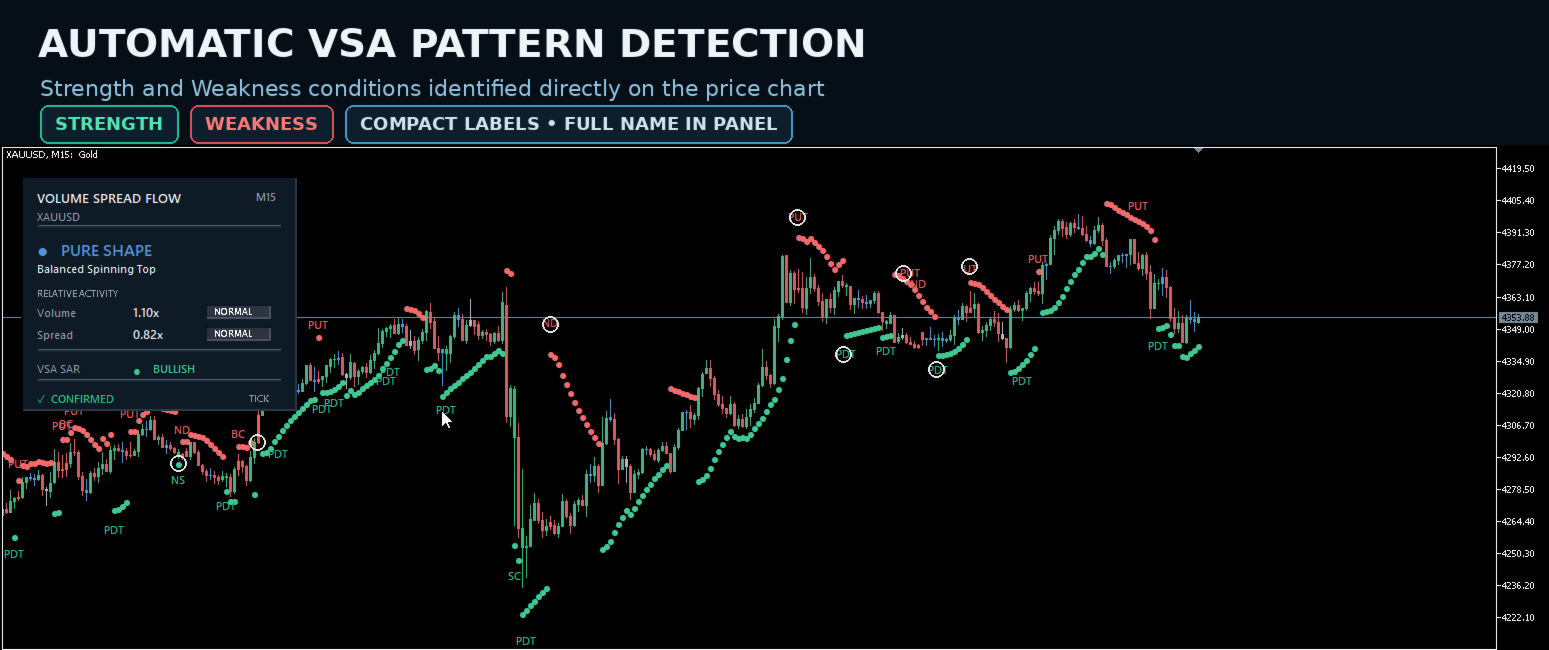
Automatic VSA Pattern Detection
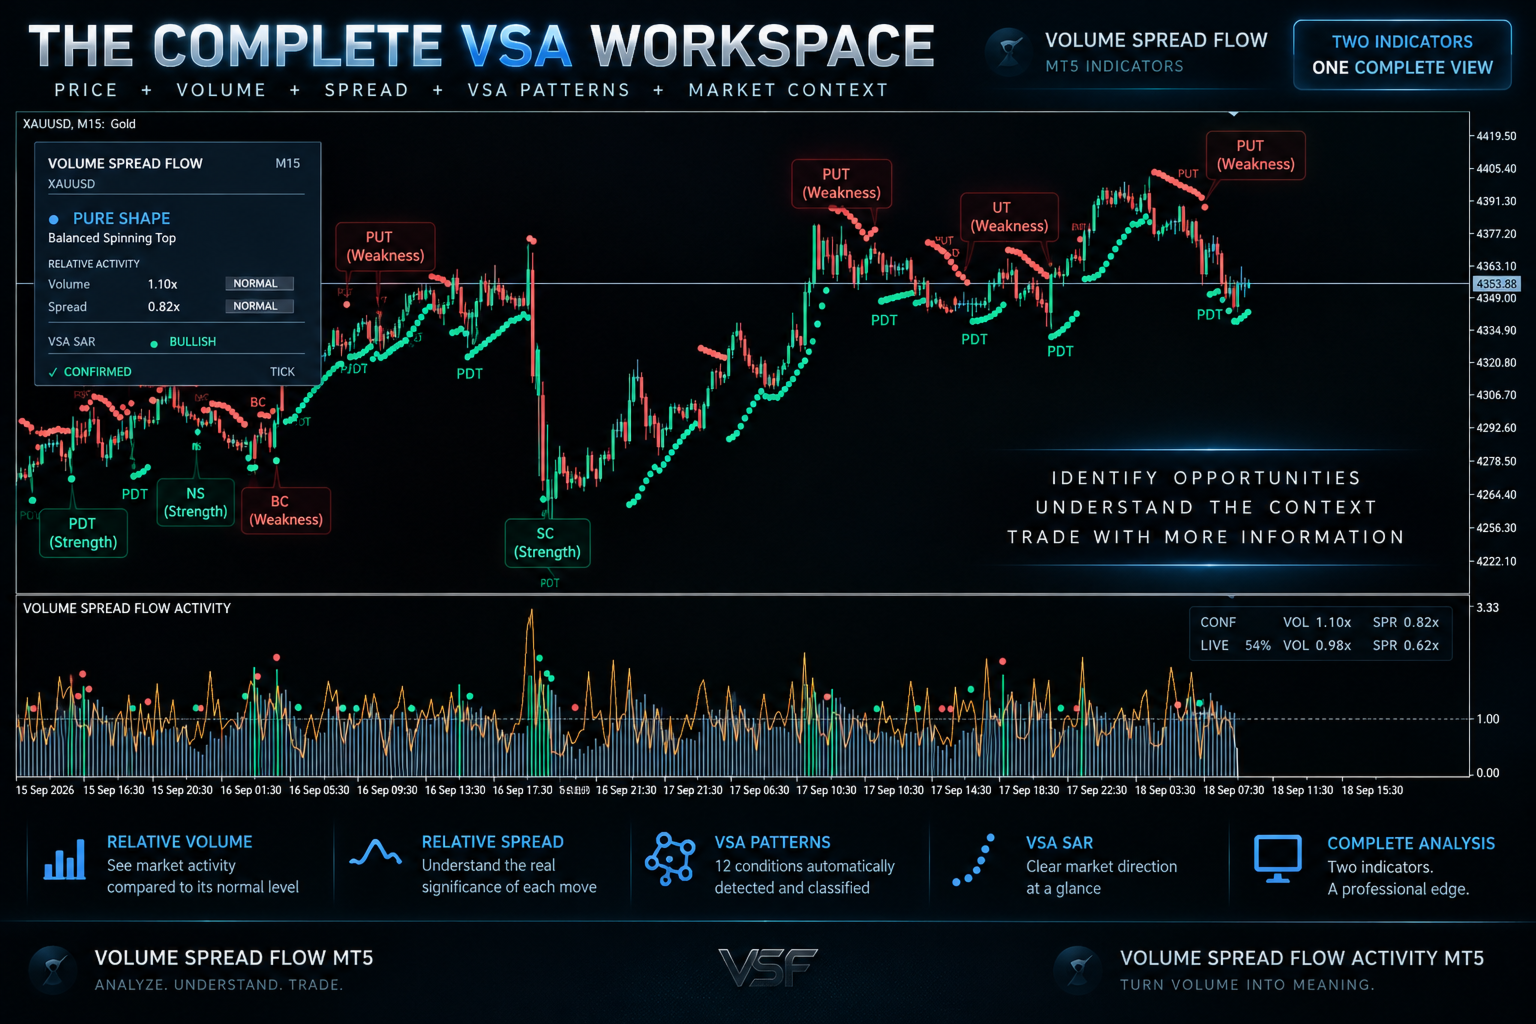
The indicator detects and classifies 12 primary VSA conditions, including:
Strength
- Down Thrust / Spring
- Selling Climax
- No Supply
- Pseudo Down Thrust
- No Effort Bearish Result
- Bearish Effort No Result
Weakness
- Up Thrust
- Buying Climax
- No Demand
- Pseudo Up Thrust
- No Effort Bullish Result
- Bullish Effort No Result
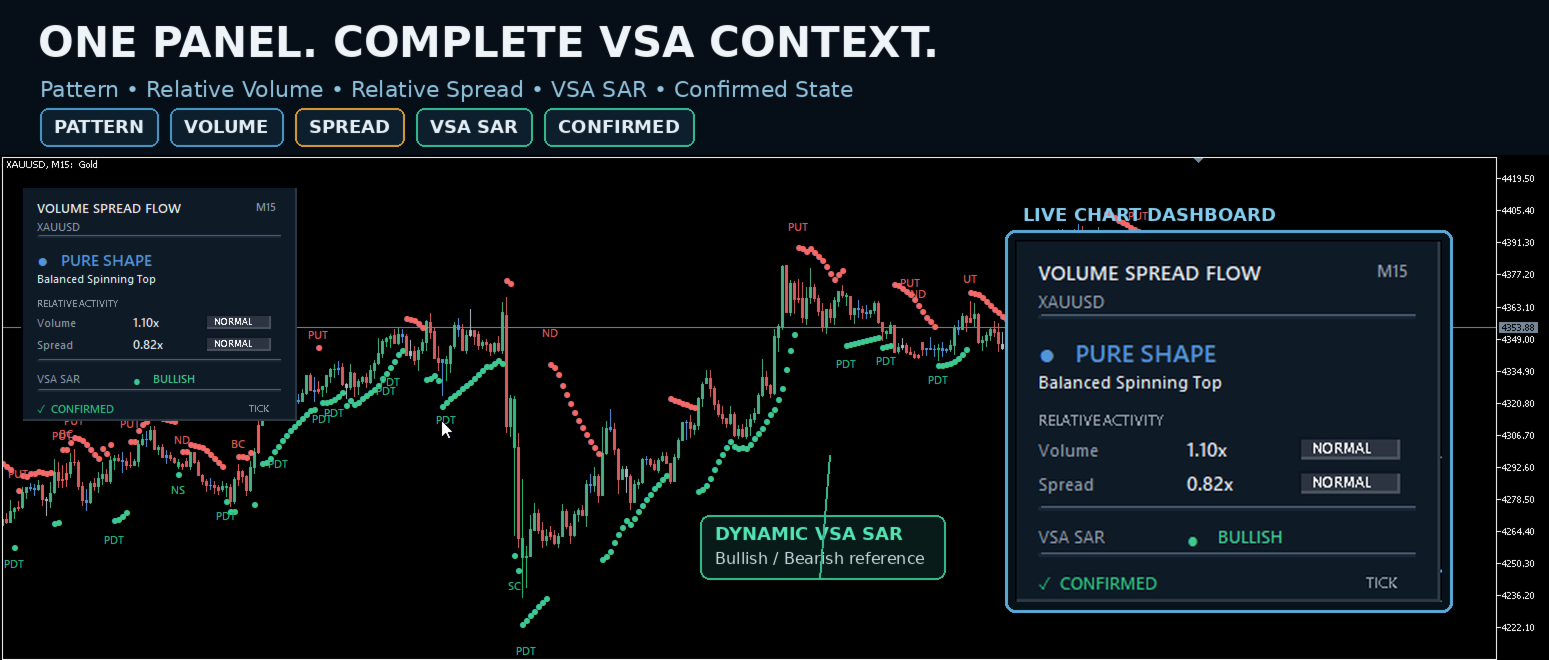
Each detected event is displayed directly on the relevant candle using compact labels, while the dashboard provides the complete pattern name and its VSA classification.
Strength and Weakness at a glance
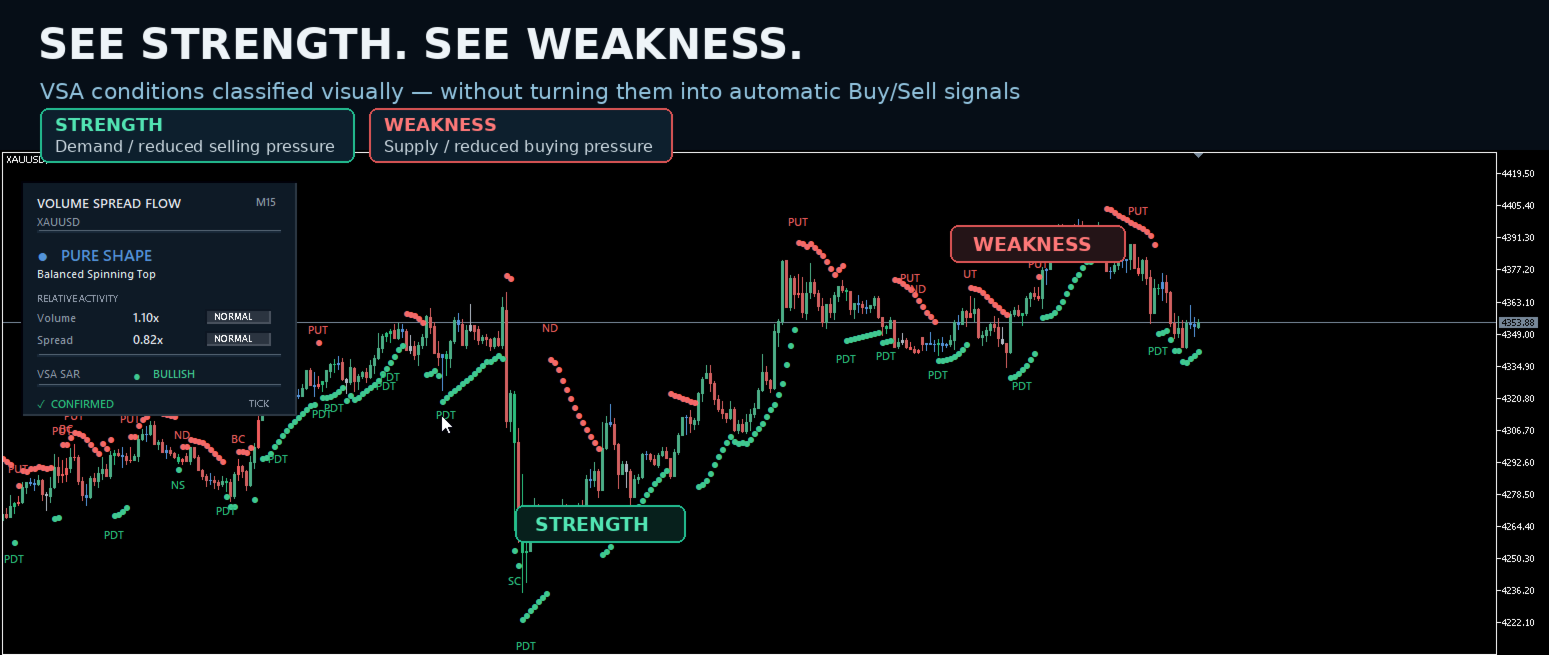
Instead of filling the chart with unnecessary information, Volume Spread Flow separates VSA observations into intuitive market states:
STRENGTH — conditions associated with demand, reduced selling pressure or potential absorption of supply.
WEAKNESS — conditions associated with supply, reduced buying pressure or potential absorption of demand.
Neutral conditions and pure candle structures are also calculated by the engine and can be displayed when required.
Important: Strength and Weakness are VSA market conditions. They are not automatic Buy or Sell signals.
Relative Volume and Spread
Absolute volume alone can be misleading because normal activity changes from one market and timeframe to another.
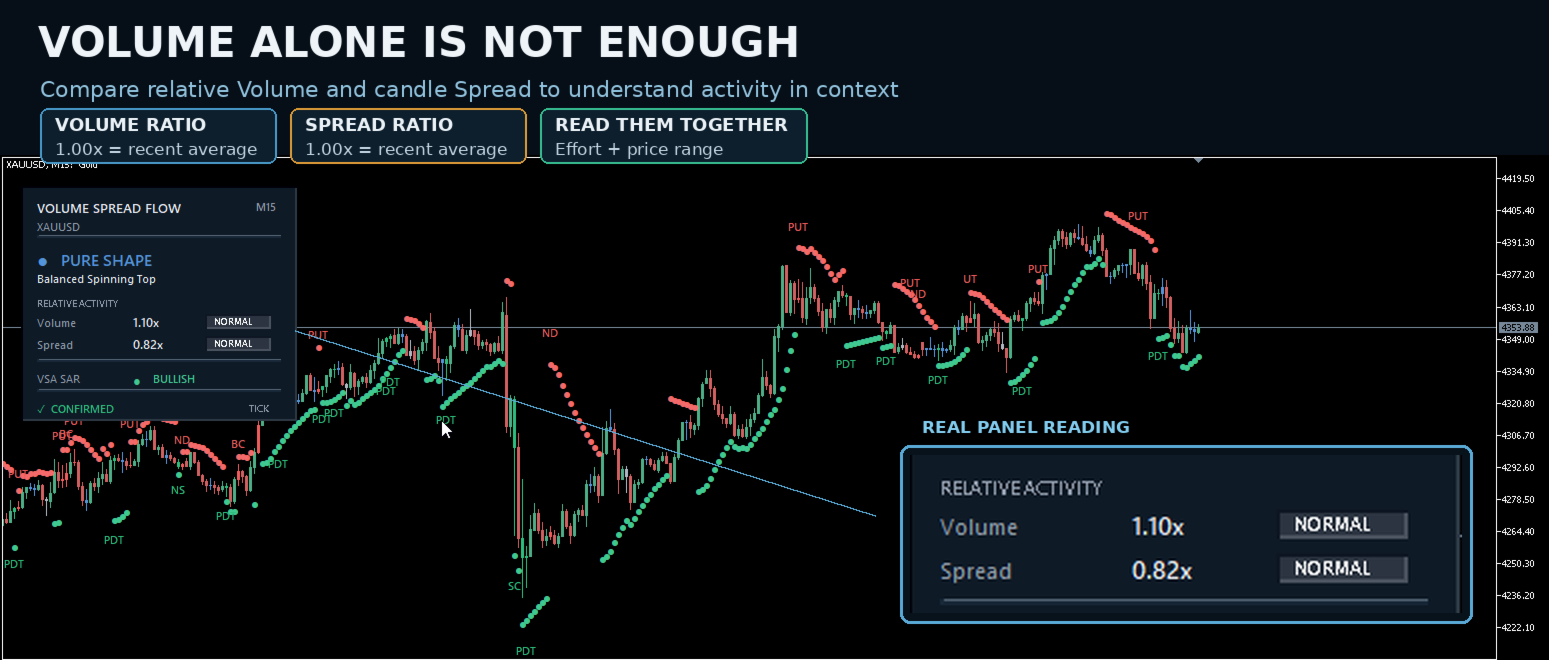
Volume Spread Flow therefore normalizes activity against its recent average.
Volume Ratio = Current Volume / Average Volume
Spread Ratio = Current Spread / Average Spread
This makes the readings immediately understandable:
1.00x = normal recent activity
1.50x = 50% above the recent average
0.70x = 30% below the recent average
The dashboard shows both values together, allowing you to see whether price movement is being accompanied by expanding or contracting market activity.
For example:
Volume 1.80x + Spread 0.65x
describes a very different market condition from:
Volume 1.80x + Spread 1.70x
Even though both bars have exactly the same relative volume.
Dynamic VSA SAR
Volume Spread Flow includes a dedicated VSA SAR component that provides a compact bullish/bearish directional reference directly on the chart.
Colored SAR-style dots make changes easy to recognize without covering price action.
The dashboard simultaneously reports the current VSA SAR state as:
BULLISH or BEARISH
Compact real-time dashboard
The integrated Volume Spread Flow Panel gives you the important information without searching across multiple indicators:
Current VSA State
Detected Pattern
Relative Volume
Relative Spread
Volume/Spread Classification
VSA SAR Direction
Confirmed Bar Status
Volume Source
Everything is designed to remain readable while leaving the price chart visible.
Real or Tick Volume
When reliable real-volume data is available, the engine can use it. Otherwise, the analysis operates with Tick Volume.
The active source is clearly displayed in the dashboard, so you always know which type of volume is being analyzed.
Designed for context, not blind signals
Volume Spread Flow was designed as an analysis tool, not as a signal generator that simply paints BUY and SELL arrows.
A No Demand, Up Thrust, Selling Climax or Down Thrust becomes more meaningful when evaluated together with:
relative volume + relative spread + candle structure + surrounding price action + VSA state.
The indicator organizes this information so the trader can make the final interpretation.
Main features
✓ 12 primary VSA pattern classifications
✓ Automatic Strength and Weakness detection
✓ Relative Volume analysis
✓ Relative Spread analysis
✓ Dynamic VSA SAR
✓ Compact professional dashboard
✓ Short pattern labels directly on candles
✓ Neutral and Pure Shape analysis
✓ Real/Tick Volume source detection
✓ Configurable visual filters
✓ Multi-symbol and multi-timeframe use
✓ No repaint-style interpretation of unfinished bars as confirmed patterns
Complete Volume Spread Flow workspace
Volume Spread Flow MT5 works completely independently.
For traders who also want a dedicated normalized Volume/Spread subwindow with CONFIRMED and LIVE Relative Activity, the separate Volume Spread Flow Activity MT5 indicator can be used alongside it.
The two products are independent and can be used separately or together.
Important
Volume Spread Flow is an analytical tool. It does not guarantee future market direction or trading results. VSA patterns should be interpreted within market context and according to your own trading methodology.