RegimeMatrix
- Индикаторы
-
Farell Edson Mazarin
 We offer high-quality products from leading MQL5 developers with over 10 years of industry experience. Our Expert Advisors are based on quantum approach: we combine classical quantitative analysis, mathematical market models, along with AI and neural networks for certain programs.
 - Версия: 1.10
- Обновлено: 8 июня 2026
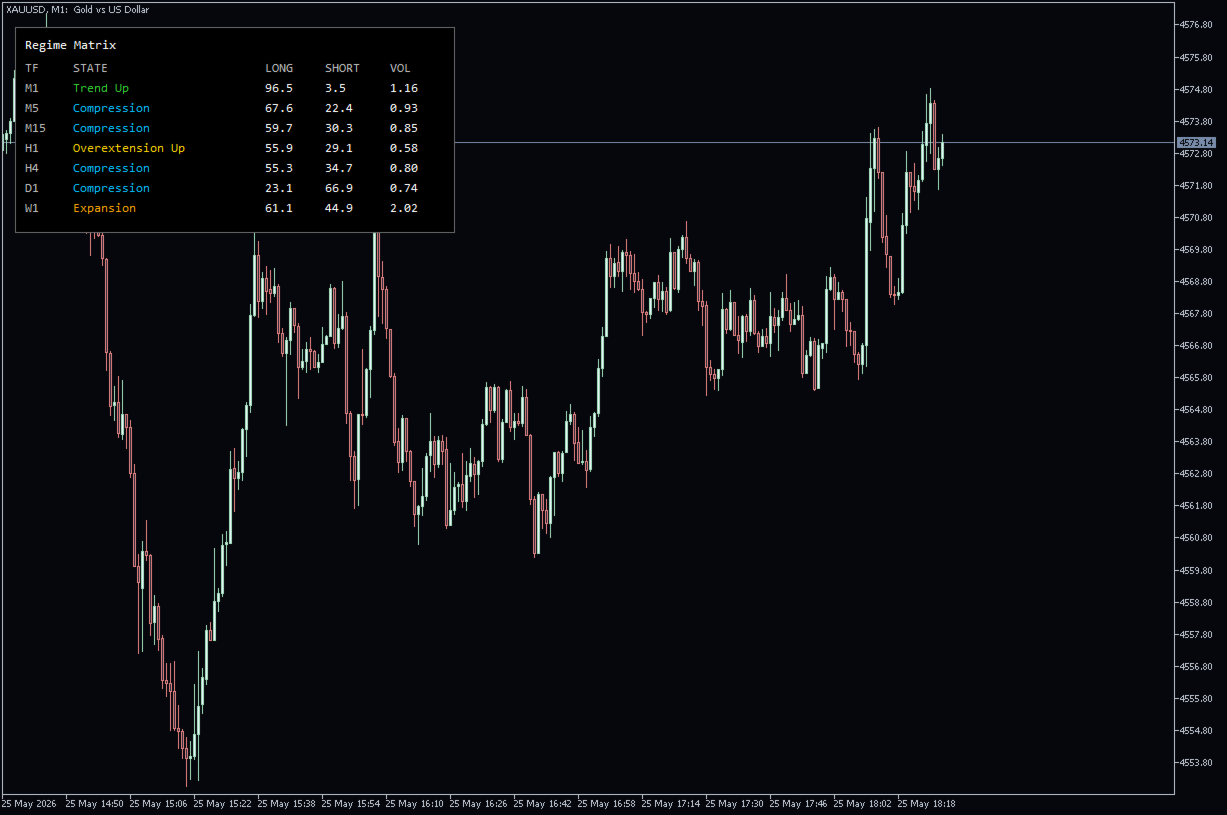
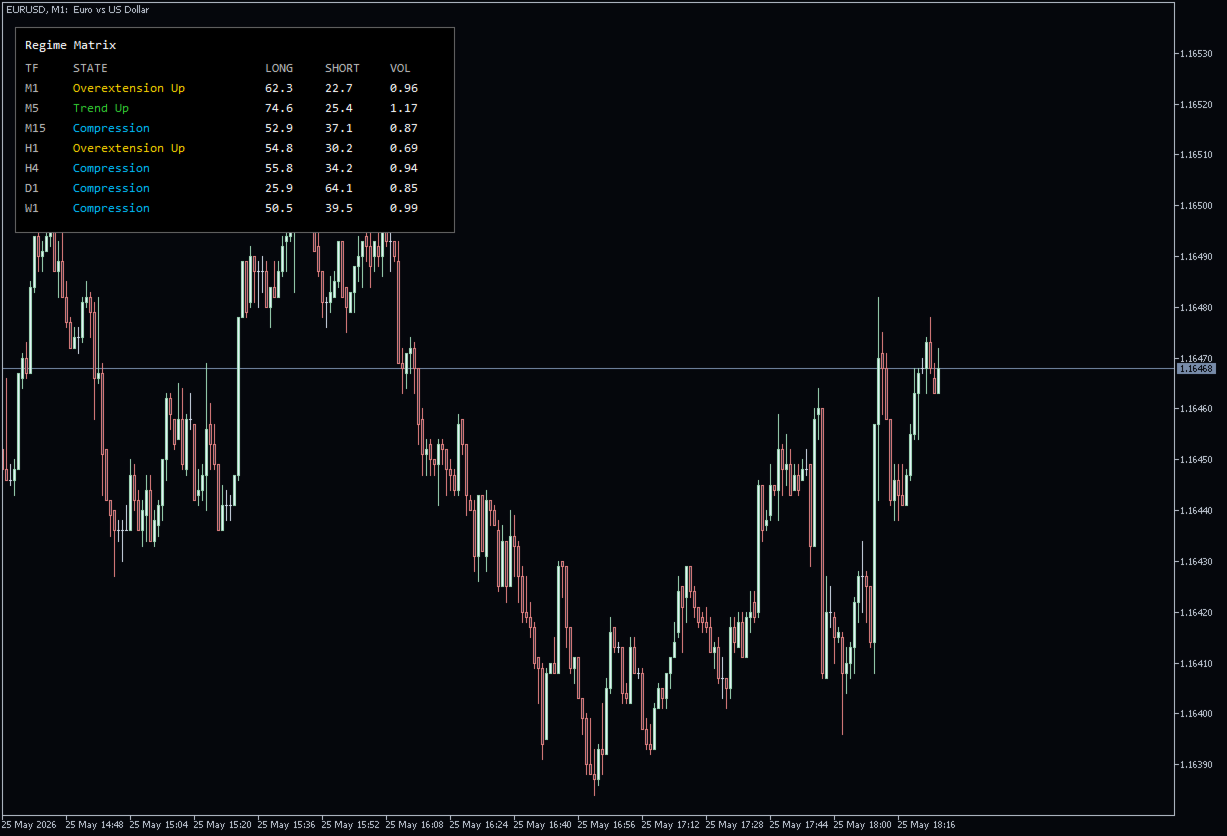
Regime Matrix — это мультитаймфреймовый индикатор состояния рынка, предназначенный для классификации текущих рыночных условий на выбранных таймфреймах. Он отображает компактную аналитическую панель непосредственно на графике и предоставляет буферы для советников через iCustom().
Индикатор помогает трейдерам оценивать, находится ли рынок в тренде, диапазоне, сжатии, расширении или состоянии перекупленного/перепроданного отклонения. Каждый таймфрейм рассчитывается независимо, позволяя сравнивать краткосрочные и старшие рыночные условия в одном представлении.
Столбцы панели
- TF — анализируемый таймфрейм.
- STATE — обнаруженный рыночный режим.
- LONG — оценка направленного смещения от 0 до 100. Более высокие значения указывают на более сильные условия для long-направления.
- SHORT — оценка направленного смещения от 0 до 100. Более высокие значения указывают на более сильные условия для short-направления.
- VOL — нормализованная оценка волатильности. Значения около 1.00 указывают на нормальную волатильность, значения ниже 1.00 — на пониженную волатильность, а значения выше 1.00 — на повышенную волатильность. VOL не относится к торговому объему или тиковому объему.
Состояния рынка
- Нейтрально — доминирующее рыночное состояние не обнаружено.
- Восходящий тренд — текущая структура имеет смещение вверх.
- Нисходящий тренд — текущая структура имеет смещение вниз.
- Диапазон — выраженное направленное доминирование не обнаружено.
- Сжатие — волатильность относительно сжата.
- Расширение — волатильность повышена относительно недавних условий.
- Верхнее переотклонение — цена расширена вверх относительно текущей структуры.
- Нижнее переотклонение — цена расширена вниз относительно текущей структуры.
Как интерпретировать значения
LONG и SHORT являются аналитическими оценками смещения, а не торговыми сигналами. Значения от 0 до 30 обычно указывают на слабые условия, от 30 до 60 — на нейтральные или умеренные условия, от 60 до 80 — на сильные условия, а от 80 до 100 — на очень сильные условия.
LONG и SHORT не обязаны в сумме давать 100. Некоторые режимы могут снижать обе оценки, тогда как нестабильные условия волатильности могут сохранять активность обеих сторон.
Для VOL значения ниже 0.75 обычно указывают на сжатие, значения около 1.00 — на нормальную волатильность, значения выше 1.35 — на расширение, а значения выше 2.00 — на сильно повышенную волатильность.
Входные параметры
- Enable Panel — включает или отключает панель на графике.
- Panel Corner — выбирает угол графика, используемый как якорь панели.
- Panel X — горизонтальное расстояние от выбранного угла.
- Panel Y — вертикальное расстояние от выбранного угла.
- Timeframe 1–7 — задает таймфреймы, отображаемые в матрице.
- Maximum Bars — задает максимальное количество баров, используемых для буферов индикатора.
Буферы индикатора
- Buffer 0 — Режим
- Buffer 1 — Long-смещение
- Buffer 2 — Short-смещение
- Buffer 3 — Оценка тренда
- Buffer 4 — Оценка волатильности
- Buffer 5 — Оценка расширения
Значения режима: 0 — Нейтрально, 1 — Восходящий тренд, 2 — Нисходящий тренд, 3 — Диапазон, 4 — Сжатие, 5 — Расширение, 6 — Верхнее переотклонение, 7 — Нижнее переотклонение.
Важное примечание
Regime Matrix — это аналитический индикатор состояния рынка. Он не рисует стрелки или прямые сигналы buy/sell, не гарантирует будущего движения цены и не должен использоваться как самостоятельная торговая система. Всегда применяйте надлежащее управление рисками.