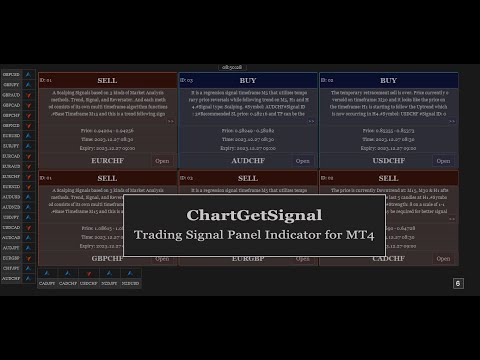
ChartGetSignal

1

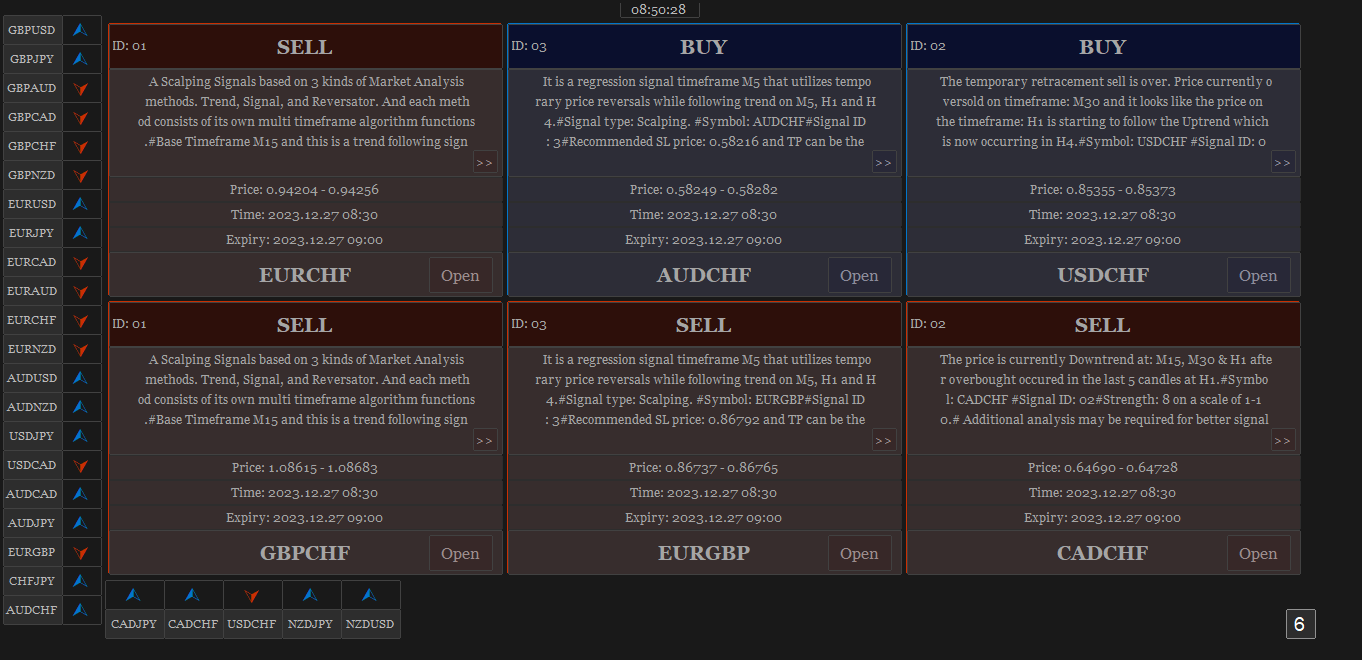
Provides instant signals on the chart in panel form. Equipped with signal description and trading analysis tools such as drawing auto trendlines, support/resistance area, regression channel, Fibonacci levels, Pivot levels and current signal price, signal time, signal expiry and stoploss recommendation. Also sending alert messages to all available mt4 alert tool.

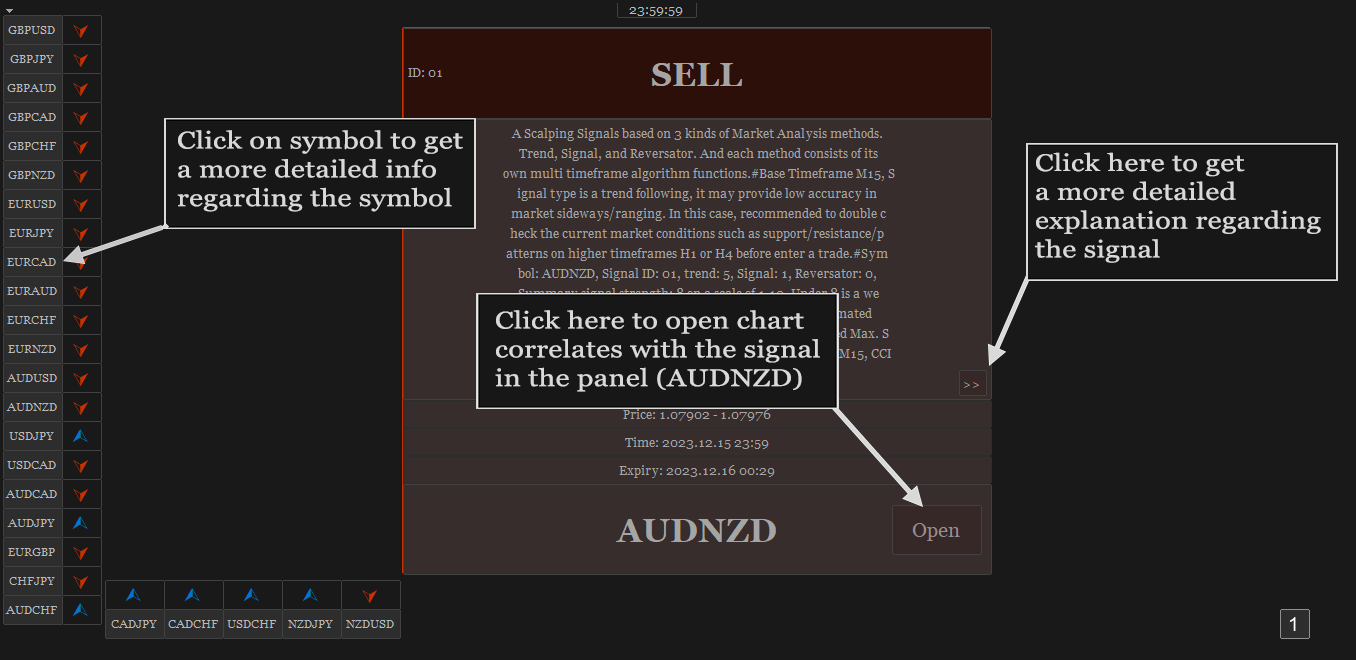
A detailed description panel provides information about where the signal comes from and what indicators are behind the signal. Including the suggestion that need to be considered before carrying out market execution. So that trader can draw conclusions and take necessary actions.

The Open Chart button to switch alternately between chart and panel, making it easier for trader to analyze chart directly based on signals currently available on the panel. The signals can be from various symbols, according to the desired input in the external parameter. Any symbols available in the market watch including forex, metal, indices, crypto, oil and futures.


The strategy behind the signals:

This is an important part of ChartGetSignal Indicator. It will display a signal on the panel when market conditions match the algorithm embedded in the indicator. Followed by an alert if enabled. The algorithms include Fibonacci retracement, regression, price action and custom trends. And several supporting indicators: MA, SAR, MACD, Stochastic, RSI, CCI and RVI. We combine them based on strategies that we consider having the highest potential to provide the next market direction. Including combining signals between timeframes to get confirmation from different period levels. The first step of the indicator is to detect the current trend from several required timeframes and then the second, finding a signal that matches the direction of the trend. Signals can come from price crossovers of several indicators and various timeframes, price action, crossovers at high-low prices or regression areas, the price is in the golden Fibonacci retracement area and is followed by a price that is oversold/overbought at a certain time frame and several other techniques to trigger signals. It is a complementary cross-strategy, cross-timeframe and cross-symbol signal scanner. Whichever signal is found first will be displayed on the panel and ChartGetSIgnal Indicator can display more than a signal at the same time on the chart.


How to trade:

We include a brief explanation of the signal on the panel with the aim of letting you know what is happening behind the signal. So, you make the right decision. You don't have to always follow existing signals because the market is very dynamic and requires improvisation at any time to suit current market conditions.

  1. It is highly recommended to read the explanation on the panel before executing the trade because here we provide some information regarding the signal such as a stoploss recommendation which describes the time range of the signal, the strategy inside the signal, spread and also suggestion that may need to be considered before taking a trading action.
  2. Open the chart to perform additional analysis. Click the 'Open' button on the signal panel and by default, it will open the M15 timeframe with symbols related to the signal. Several analysis tools are available on the chart. Click buttons at the bottom to show/hide. Regression channel, Pivot levels, Fibonacci Retracement level, Support/Resistance areas, Trendlines, and also the Signal itself which contains information about the direction, entry price range and stoploss. Take advantage of them to find out the current price position. Make changes to the parameters of those tools like the Trendline and Support/resistance parameter if necessary. You can also put your own indicators to strengthen the confidence of your decision.
  3. Look at Support and Resistance from different timeframes - especially on higher timeframes - to determine more accurate take profit or stop loss. Because the exit is as important as the entry itself.
  4. You can cancel the execution in case you see the price is in the opposite Support/Resistance area or the price is Oversold/Overbought. Because the indicator does not accommodate all current market conditions. It will produce very few signals in the same time span in case we do it. For that reason, we set a scale to display the signal. If the minimum scale, we specified in the code is met then the signal is triggered. The scale value can be read on the description panel.
  5. Use proper trading and money management. Adjust to your account condition.


Parameters:

  1. Trading Symbols (separated by comma): input the symbol to be scanned. It can be any symbol and should be the symbols available in the market watch.
  2. Symbol Prefix: The symbol prefix if available. Otherwise leave it blank.
  3. Symbol Suffix: The symbol Suffix if available. Example: EURUSD.s, then the suffix is .s
  4. Signal Storage Time in minute (min. 15): The indicator will store and maintain the signal on the panel for the time period specified here. Minimum Value is 15 that means 15 minutes.
  5. Support/Resistance Period: The indicator will look for reversal points at every number of bars specified here until up to 1000 bars back. And it will draw Support/Resistance area based on the data.
  6. Support/Resistance Strength: This value is the minimum number of reversal points - highest high and lowest low - in the past that the indicator must count to display Support/Resistance area. The idea is that the higher the number, the higher the probability of a reversal in the future. If the entered value is not found in the existing history, the indicator will not display Support/Resistance areaSo, the lower the value entered, the more Support/Resistance areas will possibly be displayed and vice versa.
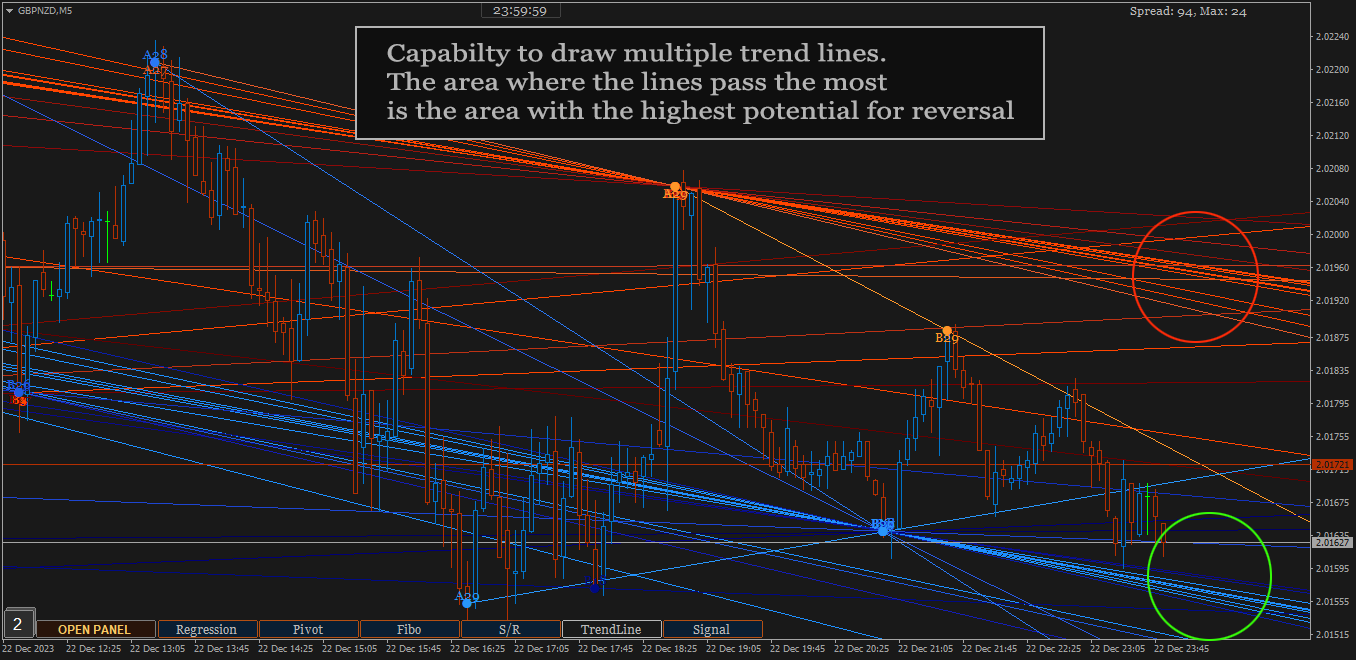
  7. Bars to search TrendLines: This is the maximum number of bars that the indicator must count to display a trendline. Within the range of bar values specified here, the indicator will look for the most relevant points and the most frequent price reversals to draw trend lines.
  8. TrendLines Period: This is similar to point 5 above. But this is to determine the trend line.  The indicator will look for reversal points at every number of bars specified here until up to the number of 'Bars to search TrendLines'  specified in point 7.
  9. Max. Trendlines/Side: The indicator can display more than one line per 'up/down' side based on the values specified in points 7 and 8 above. With the condition that trend line is found based on the input above. Maximum value of this input is 30 for performance reason.
  10. Bars Multiplier: It is the multiplier of the value of ' Bars to search TrendLines' (point 7). This value will be used only if ' Max. Trendlines/Side' specified in point 9 is more than 1. The formula is Bars to search TrendLines x line index x Bars Multiplier. Example:  Bars to search TrendLines= 300, Max. Trendlines/Side= 4 and Bars Multiplier= 2 then the indicator will draw the trend lines with such conditions:
    • The first 2 lines (upper & lower) are drawn from the calculation of the last 600 bars. 300 x 1 x 2
    • The second 2 lines (upper & lower) are drawn from the calculation of the last 1200 bars.  300 x 2 x 2
    • The third 2 lines (upper & lower) are drawn from the calculation of the last 1800 bars.  300 x 3 x 2
    • The fourth 2 lines (upper & lower) are drawn from the calculation of the last 2400 bars.  300 x 4 x 2
    • And so on, if 'Max. Trendlines/Side' is added more in value.
    1. Trendlines width: The width of trend lines. 
    2. Fibo Period: Number of bars to calculate the Fibonacci Retracement Levels.
    3. Shape Fibo Golden Ratio: Option to draw background color in the Golden Ratio area for Fibonacci Retracement Levels.
    4. Pivot Levels Timeframe: Option Timeframe to draw Pivot Levels. The Levels are drawn from the data of the last candle close of the timeframe specified here.
    5. Regression Fast Period: The Fast period of MA to determine the trend in regression signals. 
    6. Regression Slow Period: The Slow period of MA to determine the trend in regression signals and also this is the number of bars to calculate the regression channel. 
    7. Regression Deviation: The deviation of regression channel.

    8. Below are the candle color settings when the chart is opened:
    9. Bar Up Color: The color of bar up.
    10. Bull Candle Color:  The color of bull candle. 
    11. Bear Candle Color:  The color of bear candle.

    12. Indicator alerts:
    13. PopUp Alert
    14. Mobile Notification Alert
    15. Email Alert


    FAQS

    1. How many signals does the indicator generate per day? 
    2. *The average signal generated can be up to 50 signals per day and depends on market conditions. Minimum 10 per day. With the assumption that MT4 is online 24 hours.
    3. The indicator displays error text on the chart, what should I do?
    4. *The indicator will automatically download history data if the existing data is insufficient to generate a signal. It will display an error message when downloading the data. Wait a few moments until the download is complete. Make sure you write the input symbols correctly, including prefixes and suffixes and comma as symbol separator.
    5. Why can't indicators be attached to charts?
    6. *It will be automatically removed from the chart if a mistake in inputting the symbol is found or the symbol is not available on market watch. Try to check again the symbol input.
    7. This indicator makes my MT4 run slowly, what should I do to improve its performance?
    8. *Normally, it should not happen. Because we took that into consideration when building this indicator. However, if that happens, try changing some of the overloading parameters. For example: reducing the number of symbols or the 'Max. Trendlines/Sides'.
    9. What does the ID displayed on the signal panel mean?
    10. *There are several trading strategies behind the signal and the ID is to mark the strategy. Each strategy has its own ID.
    11. What time zone is used in this indicator to determine the time and expiration of the signal?
    12. *It uses Time Server.
    13. How much minimum capital is required to trade with this indicator?
    14. *You can use as much capital as you want according to the rules applied by your broker. There is no minimum limit.
    15. Will you make updates in the future, including adding trading strategies?
    16. *Of course. I will make regular updates, if necessary, as I also do with my other products.
    17. Is it possible to use the signals to apply to EA?
    18. *Yes, possible. ChartGetSignal save the signal to file txt, everytime new signal is triggered. Real time updated. You can use it to apply to the EA.

    If you have any question, please don't hesitate to contact me.


    Рекомендуем также
    The Auto Super Pivot indicator is an indicator designed to calculate support points and resistance points for pivot points. this indicator has the ability to calculate standard pivot, fibonacci, camarilla, woodie and demark pivot points. It also allows you to use all time zones with the time frame feature. Another feature of the indicator is the auto time slice feature. This feature allows automatic calculations without having to set any time zone. Features 6 different pivot calculation modes A
    Pivot Points MT4
    KEENBASE SOFTWARE SOLUTIONS
    KT Pivot Points автоматически отображает уровни дневного, недельного и месячного пивота на графике с точным расчетом на основе последних данных. Пивотные точки — это широко используемый индикатор в техническом анализе, особенно на рынке Форекс. Особенности Отправляет уведомления, когда цена касается уровня пивота.  Полностью настраиваемые параметры для каждого типа уровня пивота.   Показывает дневные, недельные и месячные уровни пивота без лишних сложностей. Минимальная нагрузка на процессор д
    CRT Candle Range Theory HTF MT4.   Ultimate CRT Indicator: Advanced ICT Concepts and Malaysian SnR Trading System Discounted   Price   $50  !!     Secure your lifetime access   now   before it switches to   subscription-only ! Master the Market Maker's Footprints with the Most Advanced Candle Range Theory Indicator Unlock the true power of   Smart Money Concepts (SMC)   and trade precisely like the institutions with the   Ultimate CRT Indicator . Built exclusively for serious traders, this indic
    DoAid
    Samuel Akinbowale
    5 (1)
    DoAid DoAid indicator is a simple channel indicator with an advance timeframe correlation board. DoAid indicator: can be used with any instrument provided by your broker and MetaTrader, be it Currency , Commodity ,Stock, or Cryptocurrencies. DoAid indicator   can be used for swing, scalping and day trading. DoAid indicator   is also a multi time-frame indicator {MTF}. DoAid indicator can be used with any timeframe. It does not repaint.It does not repaint. When To Buy if the market price is
    BoS CHoCH FVG
    Usiola Oluwadamilol Olagundoye
    4.67 (3)
    Next Arrival : Flip or Die Trading Arena. Flip a trading account:  https://flipordie.com/chapter-1-thirteen-doublings-double-a-trading-account/ The Break of Structure (BoS) and Change of Character indicator with Fair Value Gap (FVG) filter is a specialized tool designed to enhance trading strategies by pinpointing high-probability trading opportunities on price charts. By integrating the BoS and Change of Character concepts with the FVG formation, this indicator provides traders with a robust f
    FREE
    Bos CHoCH 4
    Usiola Oluwadamilol Olagundoye
    Next Arrival : Flip or Die Trading Arena. Flip a trading account:  https://flipordie.com/chapter-1-thirteen-doublings-double-a-trading-account/ The Break of Structure (BoS) and Change of Character indicator is a powerful tool designed to identify significant turning points in price movements on financial charts within the MetaTrader 4 platform. By analyzing price action, this indicator highlights instances where the market shifts from a trend to a potential reversal or consolidation phase. Util
    FREE
    Общая информация Это версия DELUX серии индикаторов Pivot Point Plotter Series. Это надежный индикатор, который динамически вычисляет и строит на графике любые четыре основные точки разворота независимо от внутридневного таймфрейма, на котором вы используете индикатор. Индикатор рисует точки разворота STANDARD, CAMARILLA, FIBONNACI и WOODIE. Какой бы из них вы ни использовали в своей торговле, этот индикатор самая выгодная покупка. Пожалуйста, обратите внимание, что это дневной вариант индикатор
    Индикатор FiboZag - перенесите индикатор на график и уровни Фибоначчи будут построены автоматически по последнему развороту ZigZag-а. Основное преимущество заключается в корректном построении уровней Фибоначчи и разметке ценовых уровней. Простое, визуальное и эффективное использование. Индикатор не перерисовывается и не запаздывает. Работает на всех валютных парах и на всех таймфреймах.
    Supply Demand Zone Pro Indicator works with all products and timeframes. It is using a new calculation method, and now you can select the desired zone on any timeframe! Strongest Zones are already enabled by default This is a great advantage in trading.This indicator has a built in backtester enabled by default, just move the chart. Supply and Demand ? Supply is a price zone where sellers outnumbered buyers and drove the price lower. Demand is a price zone where buyers outnumbers sellers and dr
    Reversals typically refer to large price changes, where the trend changes direction. Small counter-moves against the trend are called pullbacks or consolidations.When it starts to occur, a reversal isn't distinguishable from a pullback. A reversal keeps going and forms a new trend, while a pullback ends and then the price starts moving back in the trending direction. Difference Between a Reversal and a Pullback A reversal is a trend change in the price of an asset. A pullback is a counter-move w
    Что такое "точки разворота"? Анализ точек разворота зачастую применяется совместно с расчетом уровней поддержки и сопротивления, как и в случае с анализом трендовых линий. При анализе точек разворота первые уровни поддержки и сопротивления рассчитываются с использованием ширины торгового диапазона между точкой разворота и максимальной или минимальной ценой за предыдущий день. Вторые уровни поддержки и сопротивления рассчитываются с использованием всей ширины между максимальной и минимальной цен
    Raymond Cloudy Day Indicator for MT4 – Pivot-Based Reversal and Trend Levels Raymond Cloudy Day Indicator is a pivot-based level indicator for MetaTrader 4 (MT4). It was developed by Ngo The Hung based on Raymond’s original idea and is designed to give a structured view of potential reversal zones, trend extensions and support/resistance levels directly on the chart. The default settings are optimised for XAUUSD on the H1 timeframe, but the indicator can be tested and adjusted for other symbols
    Multi-Timeframe EMA Momentum Filter — Version 1.0 This indicator is designed to help traders evaluate short-term EMA crossovers in the context of higher timeframe momentum. Its purpose is to reduce noise and highlight setups that align with the broader market trend. How it works: On the main chart, arrows appear when a fast EMA crosses a slow EMA on the current timeframe, provided that higher timeframe momentum confirms the direction. In the subwindow, a histogram displays the difference betwee
    FREE
    Индикатор построения трендовых линий по алгоритму Томаса Демарка. Строит на одном графике линии с разных таймфреймов, старших или равных таймфрейму графика, на который наложен индикатор. Учитывает квалификаторы пробоя (при выполнении условий на месте пробоя появляется дополнительный значок) и строит ориентировочные цели (линии цели выше/ниже текущих цен) согласно алгоритму Томаса Демарка. Рекомендуемые таймфреймы для торговли D1+H1. Построение трендовых линий для остальных таймфреймов может дать
    Alpha Trend sign - это мой давний и очень популярный торговый инструмент, который проверяет нашу торговую систему и четко сигнализирует о транзакциях, которые не дрейфуют.   Основные функции:   • В зависимости от того, показывает ли рынок активную область, показатели могут быть очень интуитивными, чтобы определить, является ли текущая конъюнктура трендовой или шоковой.   И в соответствии с индикатором стрелка врезается на рынок, зеленая стрела подсказывает купить, красная стрела подсказывает
    API BullBearPower mtf Designed for traders who rely on BullBearPower, this tool provides a multi-timeframe (MTF) view of BullBearPower, helping you identify possible dominant trends. Key Features: Multi-Timeframe Analysis – Analyze BullBearPower across different timeframes in real time. Dynamic Color Changes – Identify possible BullBearPower per individual timeframe with color changes. Volume Integration – Get a picture of possible trend strength with BullBearPower volume of each timefra
    ENTRY AND EXIT ARROWS Indicator – Description The Entry and Exit Arrows indicator is a simple yet effective momentum-based tool designed to highlight potential buy and sell opportunities directly on the chart using visual arrows. It works by comparing two internal momentum measurements with different sensitivities. When both measurements align in the same direction, the indicator confirms a stronger directional bias and plots a signal. How It Works Buy Signal (Lime Arrow Below Candle): Appea
    This tool draws all the pivot point lines on chart. It is important to remind/tell you that there are 5 pivot method according to BabyPips website. All these methods have their unique mathematical formula. 1. Floor Method. 2. Woodie Method. 3. Camarilla Method. 4. DeMark Method. 5. Fibonacci Method. What makes this pivot tool unique is that you can click the "Fibonacci" button to select the pivot method you want. You can click the "Monthly" button to select the Period you want to use for the piv
    Optimized Version of the Pivot-Based Adaptive Support, Resistance, and Signal Line Indicator No Parameters, Simple and Easy to Use, Suitable for Daily and Lower Timeframes. Advantages: Applicable to all instruments. Suitable for all timeframes. The indicator automatically adjusts with changing data, providing more accurate signals. Instructions for Use: If the current price breaks above the signal line, the trend is bullish, with the initial target being the upper resistance line. If the price
    Что такое Pivot? Пивот - это заранее известный важный ценовой уровень, который трейдеры считают важным и могут принимать торговые решения вокруг этого уровня. В качестве технического индикатора цена разворота похожа на уровень сопротивления или поддержки. Если уровень разворота будет превышен, ожидается, что цена продолжит движение в этом направлении. Или цена может развернуться на этом уровне или около него. Что вам говорит Pivot? Есть развороты и опорные точки. Эти термины могут означать р
    Introduction It is common practice for professional trades to hide their stop loss / take profit from their brokers. Either from keeping their strategy to the themselves or from the fear that their broker works against them. Using this indicator, the stop loss / take profit points will be drawn on the product chart using the bid price. So, you can see exactly when the price is hit and close it manually.  Usage Once attached to the chart, the indicator scans the open orders to attach lines for t
    Support Resistance Pro Toolkit is a professional support and resistance indicator built on advanced Donchian structure logic, designed to provide a clear and structured view of market behavior. It automatically detects key support and resistance zones, tracks their evolution over time, and highlights how price interacts with these levels through sweeps, breakouts, and retests. Pricing Launch Price : $33 Incremental Price Increase : The price will increase by $10 after every 10 purchases. Final P
    Pivots MT4 - Простой и удобный индикатор уровней pivot , рассчитывает уровни по методам  Classic , Fibonacci , DeMark , Camarilla , WooDie , Central Pivot Range . Индикатор выгодно отличается следующим Рассчитывает уровни pivot по методам  Classic ,  Fibonacci ,  DeMark ,  Camarilla ,  WooDie ,  Central Pivot Range ; Выводит на графике текущие уровни и уровни на предыдущих периодах; Выводит на графике выбранные метод и период, названия уровней и их ценовые значения. Параметры Pivot Method - Выпа
    Поддержка и сопротивление – важные ценовые уровни на внутридневном рынке. Эти уровни обычно тестируются ценой, после чего она продолжает движение, либо приводят к развороту тренда. Для опытных трейдеров точное определение уровней поддержки/сопротивления сложно переоценить. На их основе строятся многие популярные торговые стратегии (например, торговля на пробой/отскок). Precision Support and Resistance предназначен для профессиональных трейдеров. Помимо точного определения уровней поддержки/сопро
    Индикатор строит гибкие уровни поддержки и сопротивления (точками). Для построения используется особая фаза движения. Уровни формируются динамически, то есть, каждая новая свеча может продолжить уровень или завершить. Уровень может оказывать сопротивление или поддержку цене даже там, где его уже нет. Также уровни поддержки и сопротивление могут меняться ролями. На значимость уровней влияют: количество времени формирования уровня и количество касаний. Важность уровней заключается в том, что пр
    PIVOT SCHEMATIC PRO: The Elite Institutional Market Synthesis Module Executive Overview Pivot Schematic Pro is not just a technical indicator; it is a comprehensive Hybrid Decision-Support Engine engineered for the professional trader who operates in today’s volatile global markets. By merging algorithmic precision with structural market theory, it provides a sophisticated "blueprint" of price action, enabling users to execute strategies with institutional-grade clarity. Technical Architecture &
    PLUTO MASTER TURTLE (Binary Option)   The indicator allows you to trade binary options. The recommended timeframe is М5 and the expiration time is 5 minutes. The indicator works on any currency pairs. Trading time is not limited. A possible signal is specified as a arrow above/under a candle. If the arrow remains on the previous candle, you can enter the trade immediately. Arrows are not re-painted! The trading strategy is based on the correlation of the statistical RSI, STO and Candlestick body
    MA bounce LITE arrows is simplified version of main indicator MA bounce . It's for people who don't need to use all features of main indicator. Lite version shows only arrows on chart when there is high probability of price bounce from selected MA. MA bounce LITE arrows input settings: Current MA period  - period of moving average on current TF Current     MA type   - moving average calculation method  on current TF Current     MA applied price   - applied price of moving average  on current TF
    Indicator Support and Resistence plain in your chart seven lines; Red line=Resistence 3. Red line=Resistence 2. Red line=Resistence 1. Yellow line= Pivot. Green line= Support 1. Green line= Support 2. Green line= Support 3. adattable in all timeframe (minute 1, minute   5, minute   15, minute   30, Hour 1, Hour 4,Day 1,Week 1,Mounth 1); Buy under support and sell over the resistence;
    Smart Trendlines – No.1 Trendlines Indicator Smart Trendlines is a precision tool that automatically draws trendlines based on every valid pivot point, helping traders identify key support and resistance zones. It continuously adjusts as new market pivots form, providing a live and accurate reflection of price structure. Whether you’re tracking trends, preparing for reversals, or anticipating breakouts — this indicator keeps you one step ahead. It works seamlessly across all assets including For
    С этим продуктом покупают
    Инновационный индикатор, использующий эксклюзивный алгоритм для быстрого и точного определения тренда. Индикатор автоматически рассчитывает время открытия и закрытия позиций, а также подробную статистику работы индикатора на заданном отрезке истории, что позволяет выбрать наилучший торговый инструмент для торговли. Вы также можете подключить свои пользовательские стрелочные индикаторы к Scalper Inside Pro для проверки и расчета их статистики и прибыльности. Инструкция и настройки: Читать... Осно
    Индикатор построен на не стандартном Zig Zag ,он отрисовывает накопления  после чего если цена выходит с этой зоны и происходит тест этой зоны,то подаётся звуковой сигнал и появляется стрелка- после закрытия тестовой свечи.Индикатор не перерисовывает свои сигналы,очень прост в использовании,всего три настройки 1- это параметр zig zag 2- это  минимальный выход цены из зоны 3- это максимальный выход цены из зоны.Чем ниже параметр для Zig Zag,тем больше ложного сигнала,но и также чаще точек входа(р
    Представляем       Quantum Breakout PRO   , новаторский индикатор MQL5, который меняет ваш способ торговли в зонах прорыва! Разработанная командой опытных трейдеров с опытом торговли более 13 лет,   Quantum Breakout PRO   предназначена для того, чтобы вывести ваше торговое путешествие на новые высоты благодаря своей инновационной и динамичной стратегии зон прорыва. Quantum Breakout Indicator покажет вам сигнальные стрелки на зонах прорыва с 5 целевыми зонами прибыли и предложением стоп-лосса
    Индикатор Apex Edge без перерисовки Профессиональный торговый индикатор без перерисовки для MT4 Apex Edge No Repaint — это премиальный, понятный и надежный торговый инструмент, разработанный для серьезных трейдеров на рынке Форекс и криптовалют, которым нужны четкие сигналы без раздражающих перерисовок стрелок. Основные характеристики: 100% отсутствие перерисовки – сигналы остаются фиксированными после появления на графике Двойная система сигналов: сигналы RAW для ранних возможностей и сигнал
    Индикатор точно показывает точки разворота и зоны возврата цены, где входят крупные игроки . Вы видите, где формируется новый тренд, и принимаете решения с максимальной точностью, держа контроль над каждой сделкой. VERSION MT5     -     Раскрывает свой максимальный потенциал в связке с индикатором  TREND LINES PRO Что показывает индикатор: Разворотные конструкции и разворотные уровни с активацией в начале нового тренда. Отображение уровней  TAKE PROFIT  и  STOP LOSS  с минимальным соотношением
    Этот индикатор разработан для интеграции с теорией Эллиотта и предоставляет два различных способа работы: Автоматический режим: В этом режиме индикатор работает автономно, обнаруживая все пять мотивационных волн на графике в соответствии с теорией Эллиотта. Он предсказывает и идентифицирует потенциальные зоны разворота. Кроме того, он способен генерировать предупреждения и уведомления для оповещения трейдеров о значимых событиях. Эта автоматизированная функциональность упрощает процесс идентифик
    Please send me Direct message on MQL5 CHAT after purchasing the Indicator for Training and Installation Support There are some additional files that is important to use with the Indicator . So be sure to contact me after purchasing the Indicator So that I can add you for training and support . If you find any difficulty with installation then send me Direct message here So that I can connect with you via Anydesk or Teamview for the product installation. " Smart Order Block Indicator " to find m
    Сигнал GoldRush Trend Arrow Индикатор GoldRush Trend Arrow Signal предоставляет точный анализ тренда в режиме реального времени, специально разработанный для высокоскоростных краткосрочных скальперов в XAU/USD. Этот инструмент, созданный специально для 1-минутного таймфрейма, отображает стрелки направления для четких точек входа, позволяя скальперам уверенно ориентироваться в волатильных рыночных условиях. Индикатор состоит из ПЕРВИЧНЫХ и ВТОРИЧНЫХ стрелок оповещения. ПЕРВИЧНЫЕ сигналы — это
    Индикатор " Dynamic Scalper System " разработан для скальпингового метода торговли внутри трендовых волн. Тестировался на основных валютных парах и золоте, возможна совместимость с другими торговыми инструментами. Дает сигналы для кратковременного открытия позиций по тренду с дополнительным сопровождением движения цены. Принцип действия индикатора. Большие стрелки определяют направление тренда. Внутри трендовых волн действует алгоритм генерации сигналов для скальпинга в виде маленьких стрело
    Trend Trading - это индикатор, предназначенный для получения максимальной прибыли от трендов, происходящих на рынке, путем определения времени отката и прорыва. Он находит торговые возможности, анализируя, что делает цена во время установленных тенденций. [ Руководство по установке | Руководство по обновлению | Устранение неполадок | FAQ | Все продукты ] Торгуйте на финансовых рынках с уверенностью и эффективностью Прибыль от устоявшихся тенденций без проволочек Признать прибыльные откаты, пр
    GOLD Impulse with Alert
    Bernhard Schweigert
    4.67 (12)
    Этот индикатор является супер комбинацией двух наших продуктов Advanced Currency IMPULSE with ALERT  +   Currency Strength Exotics . Он работает на всех временных рамках и графически показывает импульс силы или слабости для 8 основных валют плюс один символ! Этот индикатор специализирован для отображения ускорения силы валюты для любых символов, таких как золото, экзотические пары, товары, индексы или фьючерсы. Первый в своем роде, любой символ может быть добавлен в 9-ю строку, чтобы показат
    Super Signal – Skyblade Edition Профессиональная система трендовых сигналов без перерисовки и без задержек с исключительным процентом выигрышей | Для MT4 / MT5 Лучше всего работает на младших таймфреймах, таких как 1 минута, 5 минут и 15 минут. Основные характеристики: Super Signal – Skyblade Edition — это интеллектуальная система сигналов, специально разработанная для трендовой торговли. Она использует многоуровневую фильтрацию, чтобы выявлять только сильные направленные движения, подкреплённ
    They say history repeats itself. What if you could prove it in real-time? The Propfolio Ghost Pattern is an advanced algorithmic pattern-matching engine. It empowers you to select any current price action structure on your chart and instantly scan thousands of historical candles to find the exact moment in the past where the market did the exact same thing. Once it finds the highest probability match, it projects the historical outcome into the future as "Ghost Candles"—giving you a highly calcu
    СЕЙЧАС СКИДКА 26% !!! Этот индикатор является супер комбинацией обоих наших основных индикаторов ( Advanced Currency Strength 28   &  Advanced Currency IMPULSE with ALERT ) . Он показывает значения силы валюты для TICK-единиц и предупреждающие сигналы для 28 пар Форекс. Можно использовать 11 различных тик-единиц. Это 1, 2, 3, 4, 5, 6, 10, 12, 15, 20 и 30 секунд. Полоса Tick-Unit во вложенном окне будет показана и сдвинута влево, когда в таймере секунды будет хотя бы 1 тик.  С помощью всего ли
    Технический индикатор производящий структуризацию графиков и выявляющий циклические движения цены. Может работать на любых графиках. Несколько типов оповещений. Есть дополнительные стрелки на самом графике. Без перерисовки на истории, работает на закрытии свечи. Рекомендуемые TF от M5 и выше. Прост в использовании и настройке параметров. При использовании 2 индикаторов с разными параметрами можно использовать без других индикаторов. Имеет 2 входных параметра Цикличность и Продолжительность сиг
    KURAMA GOLD SIGNAL PRO (MT4) — Полная Торговая Система XAUUSD с 7-Слойным Фильтром, Автоматическим TP/SL и Оценкой Качества БЕЗ ПЕРЕРИСОВКИ. БЕЗ ПЕРЕПРОРИСОВКИ. БЕЗ ЗАДЕРЖКИ. Каждый сигнал постоянен. То, что вы видите, то и получаете. БОНУС: Купите пожизненную лицензию и получите AI Zone Radar (стоимость $59) + полное руководство PDF БЕСПЛАТНО. Напишите мне после покупки. AI Zone Radar: https://www.mql5.com/en/market/product/175834 ДОВЕРИЕ ТРЕЙДЕРОВ: Уже используется активным сообществом тре
    Прежде всего стоит подчеркнуть, что этот Торговый Инструмент является Неперерисовывающимся Нерепейнтинговым Индикатором, что делает его идеальным для профессиональной торговли. Онлайн-курс, руководство пользователя и демонстрация. Индикатор Концепций Умного Действия Цены - очень мощный инструмент как для новичков, так и для опытных трейдеров. Он объединяет более 20 полезных индикаторов в одном, комбинируя передовые торговые идеи, такие как анализ Inner Circle Trader и стратегии торговли концеп
    NAM Divergences
    NAM TECH GROUP, CORP.
    5 (1)
    MT4 Мультитаймфреймовый индикатор дивергенции и обнаружения перекупленности / перепроданности. Функции - Полностью настраиваемая панель управления графиком, обеспечивает полное взаимодействие. - Скрыть и показать панель управления где угодно. - Информация о расхождениях без заглавной буквы в реальном времени. - Информация в реальном времени о ситуациях перекупленности / перепроданности. - Информация о регулярных расхождениях в реальном времени. - Информация о скрытых расхождениях в реа
    Большинство стрелочных индикаторов дают вам сигнал и оставляют разбираться со всем остальным самостоятельно. KT Alpha Hunter Arrows дает вам полноценный торговый план. Каждая сигнальная стрелка появляется вместе с уже готовым планом: линия входа, стоп-лосс, четыре уровня тейк-профита и живой вердикт по преимуществу, который показывает, стоит ли сейчас торговать этот символ и таймфрейм. В комплект входит Trade Manager EA, который берет на себя сопровождение сделки после входа, чтобы дисциплина со
    BTMM State Engine Pro is a MetaTrader 4 indicator for traders who use the Beat The Market Maker approach: Asian session context, kill zone timing, level progression, peak formation detection, and a multi-pair scanner from a single chart. It combines cycle state logic with a built-in scanner dashboard so you do not need the same tool on many charts at once. What it does Draws the Asian session range; session times can follow broker server offset or be set in inputs. Tracks level progression (L
    The elite (V3) multi-indicator suite from JoaquinTrading specifically geared towards Forex & binary options, including regulated exchanges such Nadex, Cantor Exchange, and other binary option brokers. The Probability Tool Suite Elite will provide the given win/loss outcome probabilities of up to 10 strike levels, a specific expiration duration, based on a combination of up to 16 indicators, rules, or conditions and derivative behavior (i.e. expiry, touch, touch & retrace).  Using this indicato
    Route Lines Prices - индикатор разработанный для поиска направлений цены. Простой интерфейс индикатора содержит в себе множество алгоритмов поведения цены и расчет будущих направлений. В алгоритмах содержатся расчеты волатильности и сглаживание цены в соответствии с используемыми тайм-фреймами. Индикатор имеет единственный параметр для изменения значений " Calculating price values ". Значение по умолчанию 1 имеет сбалансированную автоматическую форму расчетов, которой можно пользоваться без с
    Cycle Sniper
    Elmira Memish
    4.39 (36)
    Please contact us after your purchase and we will send you the complimentary indicators to complete the system Cycle Sniper is not a holy grail but when you use it in a system which is explained in the videos, you will feel the difference. If you are not willing to focus on the charts designed with Cycle Sniper and other free tools we provide, we recommend not buying this indicator. We recommend watching the videos about the indiactor and system before purchasing. Videos, settings  and descri
    ECM Elite Channel is a volatility-based indicator, developed with a specific time algorithm, which consists of finding possible corrections in the market. This indicator shows two outer lines, an inner line (retracement line) and an arrow sign, where the channel theory is to help identify overbought and oversold conditions in the market. The market price will generally fall between the boundaries of the channel. If prices touch or move outside the channel, it's a trading opportunity. The ind
    Dynamic Forex28 Navigator — инструмент для торговли на рынке Форекс нового поколения. В НАСТОЯЩЕЕ ВРЕМЯ СКИДКА 49%. Dynamic Forex28 Navigator — это эволюция наших популярных индикаторов, объединяющая мощь трех в одном: Advanced Currency Strength28 Indicator (695 отзывов) + Advanced Currency IMPULSE with ALERT (520 отзывов) + CS28 Combo Signals (бонус). Подробности об индикаторе https://www.mql5.com/en/blogs/post/758844 Что предлагает индикатор Strength нового поколения?  Все, что вам нравило
    Индикатор Miraculous – 100% ненарисовывающийся инструмент для Форекс и бинарных опционов, основанный на Квадрате Девяти Ганна Это видео представляет индикатор Miraculous – высокоточный и мощный торговый инструмент, специально разработанный для трейдеров Форекс и бинарных опционов. Что делает этот индикатор уникальным, так это его основа на легендарном Квадрате Девяти Ганна и Законе вибрации Ганна , что делает его одним из самых точных инструментов прогнозирования, доступных в современном трейдин
    NAM Order Blocks
    NAM TECH GROUP, CORP.
    3.67 (3)
    Индикатор обнаружения блоков ордеров мультитаймфреймов MT4. Функции - Полностью настраиваемая панель управления графиком, обеспечивает полное взаимодействие. - Скрыть и показать панель управления где угодно. - Обнаружение OB на нескольких таймфреймах. - Выберите количество OB для отображения. - Различные пользовательские интерфейсы OB. - Различные фильтры по OB. - Оповещение о близости OB. - Линии ADR High и Low. - Служба уведомлений (Экранные оповещения | Push-уведомления). Резюме
    Volatility Trend System - торговая система дающая сигналы для входов.  Система волатильности дает линейные и точечные сигналы в направлении тренда, а также сигналы выхода из него, без перерисовки и запаздываний. Трендовый индикатор следит за направлением среднесрочной тенденции, показывает направление и ее изменение. Сигнальный индикатор основан на изменении волатильности, показывает входы в рынок. Индикатор снабжен несколькими типами оповещений. Может применяться к различным торговым инструмен
    В НАСТОЯЩЕЕ ВРЕМЯ СКИДКА 20%! Лучшее решение для новичка или трейдера-эксперта! Этот индикатор специализирован для отображения силы валюты для любых символов, таких как экзотические пары, товары, индексы или фьючерсы. Впервые в своем роде, любой символ может быть добавлен в 9-ю строку, чтобы показать истинную силу валюты золота, серебра, нефти, DAX, US30, MXN, TRY, CNH и т.д. Это уникальный, высококачественный и доступный торговый инструмент, потому что мы включили в него ряд собственных функци
    TPA True Price Action indicator reveals the true price action of the market makers through 100% non-repainting signals (except early signals mode) strictly at the close of a candle! TPA shows entries and re-entries, every time the bulls are definitely stronger than the bears and vice versa. Not to confuse with red/green candles. The shift of power gets confirmed at the earliest stage and is ONE exit strategy of several. There are available now two free parts of the TPA User Guide for our custom
    Другие продукты этого автора
    It works based on the Stochastic Indicator algorithm. Very useful for trading with high-low or OverSold/Overbought swing strategies. StochSignal will show a buy arrow if the two lines have crossed in the OverSold area and sell arrows if the two lines have crossed in the Overbought area. You can put the Stochastic Indicator on the chart with the same parameters as this StochSignal Indicator to understand more clearly how it works. This indicator is equipped with the following parameters: Inputs d
    FREE
    It identifies the pivot, support, and resistance price levels of the selected timeframe and then draws lines onto the chart. FEATURES: Option to specify the Timeframe Period in the PivotSR calculation. Option to display the PivotSR of the last candle, of every candle, or of the current candle. Options for displaying labels, line thickness, and line color. PivotSR can be interpreted as reversal levels or past price reactions that can be used as the basis for current price analysis. Some traders b
    FREE
    MACD Scanner provides the multi symbols and multi-timeframes of MACD signals. It is useful for trader to find the trading idea quickly and easily. User-friendly, visually clean, colorful, and readable. Dynamic dashboard display that can be adjusted thru the external input settings. Total Timeframes and Total symbols as well as the desired total rows/panel, so it can maximize the efficiency of using the chart space. The Highlight Stars on the certain matrix boxes line based on the selected Scan M
    It is a custom non-repaint indicator to identify trade opportunities in swing action as prices move within an upper and lower band. Inspired by the Keltner Channel, the most popular channel Indicator introduced by Chester Keltner. It is different with a Bollinger Bands. It represents volatility using the high and low prices, while Bollinger's studies rely on the standard deviation. The algorithm for this indicator is also available in the EntryMaximator EA. Including the option to use it or not.
    FREE
    This is the countdown of the last candle Indicator. How much time remains in the current candle of your chart CTime display exactly how many hours, minutes and seconds remain before the current candle closes, and a new one opens. This allows you to be on the ball as soon as the next candle appears It could be useful for a trader who trades with candles as the main attention Available option to change the text color to suit the chart background. This Indicator is related to the system here .
    FREE
    Индикатор основан на множестве EMA. Идея состоит в легком отображении нескольких экспоненциальных скользящих средних на одном гнрафике, без необходимости добавлять их по отдельности. В индикатор также встроена линия тренда: она синяя при растущем тренде и красная при падающем тренде. Цвета линий можно поменять в настройках индикатора. В индикаторе 2 внешних параметра. Это параметры периода и сдвига. При их изменении (период и/или сдвиг), остальные параметры подстраиваются автоматически. Подходит
    Индикатор Range Multi Alligators отображает информацию о максимуме и минимуме канала диапазона, а также о тренде, который рисуется в центре канала в виде гистограммы красного и синего цвета. Линии канала диапазона позволяют определять уровни стоп-лосс и тейк-профит. Это трендовый индикатор на основе использования нескольких "Аллигаторов". Запустите индикатор на графике и настройте один или все параметры, при этом все линии будут перемещаться синхронно. Описание настраиваемых параметров Period :
    Индикатор стохастических свечей Он преобразует стохастический индикатор из отдельного окна в окно графика, рисуя раскрашенные перекупленные свечи. Красный перекуплен, а синий перепродан по умолчанию. Позже вы можете изменить цвет в настройке внешнего индикатора. Это индикатор мульти таймфрейма, который означает, что он может показывать результат появления с другого таймфрейма. Например: если вы установите таймфрейм H1, он будет отображаться свечи с таймфрейма H1 на любой таймфрейм Это будет по
    Autobot Retracement Code (ARC) A robot trading that works based on retracement strategy while following the market trend.It has  made average profits up to 25% /month that is relatively a High Return of Investment.Real Account proof. Fully automation. Auto Lot sizing, Auto TakeProfit Calculation, Auto StopLoss Calculation. Currently Running on Real account , it has more than 100% growth / 5 months. NEW UPDATE RELEASED, VERSION 3.0  FEATURES on Version 3: FIFO rules Auto LotSize Auto StopLoss 
    Order Management EA (OME). The software will manage your trades based on 2 options: Magic Number or Order Comment. Both the Trades from the other EA or from Manual Trading. Drawing Stop Loss/Take Profit, Close All the positions, manages Multiple Orders, determining grid range and entry signals automatically.  Sending Martingale Orders, if necessary, that can be turn off/on. Including 2 options lot calculation: Multiplication or Addition.  You install OME in your account, you place order, and it
    Strategy – Bollinger Band, Moving Average and Price Actions. Bollinger Bands to identify High-Low Price, Moving Average to identify Trend and Price Action is to synchronize both of them.  SardaFx 4.1 has average holding time 24 hours (1 day) on timeframe H1. It is not a Martingale EA or Averaging EA. The work is simple, BUY and Exit or SELL and Exit. No recurring BUY and or SELL in the same time and the same symbol except you adjust Max BUY/SELL  more than 1,default setting is 1 BUY and 1 SELL.
    Some informations on the chart with the single attachment. RangeBorder Buy Sell (RBBS) Non Repaint Indicator will provide trend line, buy sell arrows,reversal arrows, range channel, order exit area,high average price line and low average price line.All arrows and lines don't repaint and not lagging. Once candle closed it won't  repaint. Reading Indicator: 1. Small Stars , Indicates oversold and overbought with certain logic and price may reverse when this small star triggers. Useful to identify
    Oversold and Overbought Candles, Trendlines, and BUY-SELL arrows in the single Indicator. Built from 8 default MT4 Indicators. Stochastic,RSI,SAR,CCI,RVI,DeMarker,WPR and MA. It is " NON REPAINT " indicator. All buffers do not repaint.  Double Trendline buffers that can also be used to identify sideway market and support resistance area.  Any timeframes and any currency pairs. Parameters: Show Trend . TRUE/FALSE to show trendlines on the chart Follow Trend. If TRUE , Dapitrend will show only
    TrendWavePattern  an another way to trade with a harmonic pattern, a maestro classic pattern . I made some improvements and combinations with my own strategy. Trend direction, buy-sell signal ,hi-low area and pivot line. These will be helpful for trader to read the current market condition. So it is not blindly following the pattern itself but also following other informations from the market. Readable chart appearance . Designed to be user friendly even you are a new trader. BUY-SELL zone, Tak
    This is MT4 version of StochScanner It scans Stochastic from Multi Symbols and Multi Timeframes and displayed on the dashboard on a single chart. . 4 scanning modes: 1. Mode OverBought/OverSold Indicator scans Overbought and OverSold . OverBought : current stochastic is above level 80 and OverSold : current stochastic is below level 20 2. Mode Signal It means if the previous stochastic is on OverBought or OverSold ( either Main Line and Signal Line ) and the current Main Line cross over the curr
    It is an expert advisor that scans the last patterns on defined symbols and timeframes . Multi Symbols /pairs , Multi timeframes .  There are 2 ways to specify symbols : Automatically scan all symbols available on the market watch (true/false) Type any symbols ,separated by comma.   There are also 2 ways to specify timeframes : Automatically scan all timeframes available on mt4 (true/false) Type any timeframes,separated by comma.   Unlimited symbols available in an account and unlimited timefra
    GOLDEN RETRACEMENT POWER indicator draws fibonacci levels automatically. Defines the golden entry buy/sell area, support and resistant lines , signals arrows and strength 'Power Bars Level' based on price action . Some indicators also work behind the chart: Stochastic,RSI,MFI,DeMarker and WPR . Fibonacci retracements are a popular form of technical analysis used by traders in order to predict future potential prices in the financial markets. If used correctly, Fibonacci retracements and ratios c
    Lemurian Trader is a multi symbols  EA/robot. User can input symbols in the external parameter separated by comma. Only need to place on the single chart, no need to open multiple chart,no limited symbols as long the symbol is available on the market watch. Sweeping signals from timeframe M15 to H4 on each symbol to find the best high/low price while it also keeps to follow the trend. Lower TF M15 as a signal and higher(M30,H1,H4) to indentify trend and high low. It means whatever timeframe we p
    RSI Scanner Plus Indicator scans RSI values in multiple symbols and timeframes. Plus trend line buffer on the chart.  Features: -Trend Line :  We add trend line on the chart in the hope it help you to see current trend on the chart while following oversold and overbought  from RSI. This is additional feature in the indicator. We consider that following the trend is very important in trading. -Changeable Panel Display :  Change the value of Max.Symbols/Panel and  the indicator will adjust the da
    TrendScanner XTra scans market trends from Multi Symbols and Multi Timeframes with extra additional Entry Point Signals arrow on the current chart. Features: -Entry Point SIgnals :  This is additional feature in the indicator. No repaint arrows. The Trading system in the single indicator. MTF Trend informations and Entry Signals. In order to make it easier for trader to get trading moments from a single chart and  deciding entry time.  -Changeable Panel Display :  Change the value of Max.Symbol
    PullbackMatrix provides the key information of the trading transactions when it finds the right market moment based on its built-in logic algorithm. The high accuracy signals including Trading Symbol, Entry Price, Entry Time, TakeProfit, Stoploss, and more. And that's all will be available instantly in your chart panel, drawing the position lines and also sending signal notification to email, mobile phone, and screen popup. More important is that also saves signals into a .csv file which is usef
    Non-repaint indicator    to identify trade opportunities in swing action as prices move within an upper and lower band. Inspired by the Keltner Channel, the most popular channel Indicator introduced by Chester Keltner. It is different with a Bollinger Bands. It represents volatility using the high and low prices, while Bollinger's studies rely on the standard deviation. Customized by adding the trends exactly in the middle line, arrows when price cross over the outer lines and Fibonacci Levels L
    Профессиональный торговый индикатор с возможностью двойного входа. Ценные Гладкие Линии Канала в отдельном окне, Линии Тренда как в главном окне, так и отдельное окно и стрелки входа. Подходит для скальпинга на младших таймфреймах. Также он может работать и давать сигналы на старших таймфреймах для более длительных торговых периодов. НАСТРОЙКИ ИНДИКАТОРА: 1. Сигнальный режим. Есть 2 варианта: Стандартный и Компактный. Если выбрано значение по умолчанию, в главном окне будут отображаться 3 раз
    Provides Regression Channel on the current chart. Combined by Trend of Moving Averages and Multi timeframes Oscillator Indicators: CCI, RSI, Stochastic, and MACD with specific working logic . It could make us easier to identify swing high-low as an entry point, the retracement area while following the current trend. Consists of 2 types of signal, main and secondary. The main signal will draw very clearly triangle and lines on the chart with the word " BUY" or 'SELL'. and the secondary is the sta
    It could help to calculate Risk-Reward easily before placing a BUY-SELL position. TradeSizeCalculator is a Multi-Tasking Calculator. It will calculate the others when we define the value in one of the columns. Stoploss, risk percentage, risk-money, lot size, take-profit , reward-money, and reward-ratio. Depending on which value is changed. All values in the columns are editable. Also, we can get those calculation results by drag-drop the stop-loss/take-profit line. Parameter: The inputs below ar
    MACD Scanner provides the multi symbols and multi-timeframes of MACD signals. It is useful for trader to find the trading idea quickly and easily. User-friendly, visually clean, colorful, and readable. Dynamic dashboard display that can be adjusted thru the external input settings. Total Timeframes and Total symbols as well as the desired total rows/panel, so it can maximize the efficiency of using the chart space. The Highlight Stars on the certain matrix boxes line based on the selected Scan M
    It has 3 capabilities at once and can be adjusted according to needs. Full Auto, Semi-Auto, or Warning Signals only. You can choose it by setting the parameters provided. Built to help Traders work much easier than doing it manually. Sharpen the accuracy of market analysis performed by a Trader by only executing in certain price areas and adjustable signal parameters. Features Ability to manage trading management, including automatically determining stop loss/take profit, calculating lot size ba
    GU Spot is a One Shot One Kill EA. A  Scalping EA   for GBPUSD .   No Martingale, No Averaging, No Grid or other high-risk strategies.  Working with up to the best 100 trading signals algorithm from various Trading Systems. The combination of Price Action, High Low, Trend, Range Levels, Pullback /  Retracement and Reversal. This is Fully Automatic Trading Robot . High Accuracy Entry Signals and protected by a proper Money Management. A tight Stop Loss with SL:TP ratio 1:3 by default, Trailing an
    SignalPinner is a trend line Indicator which can detect market trends early by including three types of signal arrows. Non repaint and trend following. Signals on the strong trend, signals in the beginning of trend and signals with multiple market analysis algorithm as the main signals. Supported by alert notification message to keep you getting signals while on the go. Symbols: Any Timeframes: Any Features Histogram buffers as a sign the trend is started. It can help the trader knowing the mar
    Scanning   Multi Symbols Scalping Signals based on 3 kinds of Market Analysis methods. Trend, Signal, and Reversator. And each method consists of its own multi timeframes algorithm functions. Summarized to become clear signals direction BUY/SELL, including the signals strength scoring and sending message to all available alert tools. Displayed on a User Friendly and customizable Dashboard. Size, colors, coordinates, highlight, hidden/show and more. Base Timeframe: M15. And M5 to Daily to confirm
    Фильтр:
    cam028
    6487
    cam028 2024.10.05 09:47 
     

    its been a while with no response to a question about a indicator I bought

    Ответ на отзыв