Ставь лайки и следи за новостями
Поставь на него ссылку - пусть другие тоже оценят
Оцени его работу в терминале MetaTrader 5

- Просмотров:
- 550
- Рейтинг:
- Опубликован:
-
 Вы упускаете торговые возможности:
- Бесплатные приложения для трейдинга
- 8 000+ сигналов для копирования
- Экономические новости для анализа финансовых рынков
Регистрация ВходВы принимаете политику сайта и условия использования
Если у вас нет учетной записи, зарегистрируйтесь -
 Нужен робот или индикатор на основе этого кода? Закажите его на бирже фрилансеров
Перейти на биржу
Нужен робот или индикатор на основе этого кода? Закажите его на бирже фрилансеров
Перейти на биржу
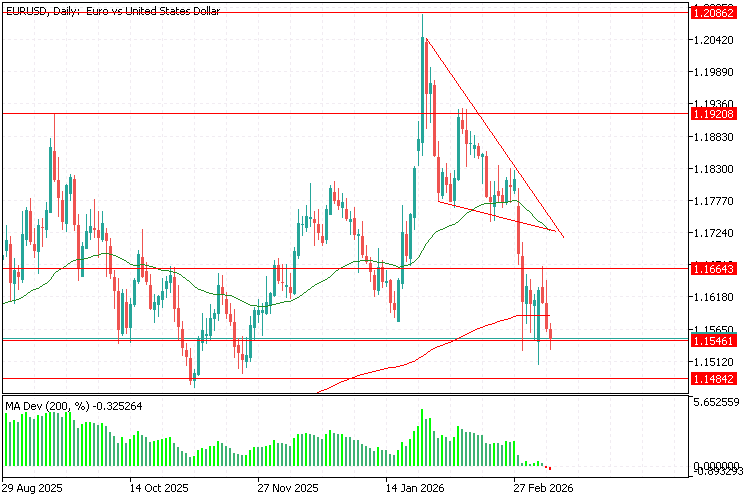
Overview
The MA Deviation Histogram is a highly customizable momentum oscillator that visualizes the exact distance between the current Price and a Moving Average. Instead of cluttering your main chart with multiple moving averages, this indicator displays the deviation in a clean sub-window histogram, allowing you to easily spot overextended price movements, mean-reversion setups, and momentum shifts.
How it Works
The indicator calculates the difference between the close price (or any applied price) and the Moving Average. To make the indicator as flexible as possible, it includes a "Deviation Mode" that allows you to view this distance in three different formats:
-
Points: Displays the distance in raw broker points (e.g., 500 points).
-
Absolute Price: Displays the exact mathematical price difference (e.g., 0.0050).
-
Percentage (%): Displays how far the price has deviated from the MA as a percentage (e.g., 0.45%).
4-State Momentum Colors
The histogram uses a classic 4-color MACD-style system to tell you not just where the price is, but how fast it is moving relative to the MA:
-
Lime (Bright Green): Price is ABOVE the MA, and the distance is increasing (Strong Uptrend).
-
Sea Green (Dark Green): Price is ABOVE the MA, but the distance is decreasing (Uptrend losing steam / reverting to mean).
-
Red: Price is BELOW the MA, and the distance is increasing (Strong Downtrend).
-
Pink: Price is BELOW the MA, but the distance is decreasing (Downtrend losing steam / reverting to mean).
Input Parameters
-
MA Period: The lookback period for the Moving Average (Default: 14).
-
MA Shift: Shift the Moving Average forward or backward.
-
MA Method: Choose between Simple (SMA), Exponential (EMA), Smoothed (SMMA), or Linear Weighted (LWMA).
-
MA Applied Price: Choose which price data to calculate the MA on (Close, Open, High, Low, etc.).
-
Deviation Value Mode: Choose between Difference in Points, Absolute Price Difference, or Difference in Percentage.
Trading Applications
-
Mean Reversion: When the histogram bars get unusually long (compared to historical recent bars), it indicates the price is overextended and may snap back to the Moving Average.
-
Momentum Confirmation: A shift from Dark Green to Lime (or Pink to Red) can confirm trend acceleration after a pullback.
-
Divergence: Can be used to spot classic oscillator divergence (e.g., price makes a higher high, but the histogram makes a lower high, indicating weakening trend strength).
 VR Rsi Robot - Мультитаймфреймовая торговая стратегия
Всего два таймфрейма — H1 и D1 — работают синхронно, чтобы отсеять шум и ловить только сильные развороты RSI из зон перекупленности и перепроданности. Никаких случайных входов, только чёткое подтверждение направления от «старшего брата».
 Support and Resistance(SNR) Sentinel Indicator
Адаптивный индикатор поддержки и сопротивления, который автоматически обнаруживает, отслеживает и обновляет ближайшие действительные уровни S/R с помощью настраиваемых баров подтверждения. Уровни динамически смещаются после подтвержденных прорывов и расширяются вперед в режиме реального времени.
Таймер закрытия свечи - индикатор MT5
Описание индикатора - Candle Close Timer Название: Candle Close Timer Версия: 1.0 Автор: BENTRADE TRADING Ссылка: https://www.mql5.com/en/users/dahmi_benali
Индикатор прорыва ценового действия RSI
Высокоточный индикатор разворота тренда, сочетающий зоны истощения RSI и свечные модели пробоя.