
📊 MACRO SNAPSHOT
Gold's Friday slide was triggered by the August CPI print: headline inflation held at 3.4% y/y with gasoline up 3.9%, pushing CME FedWatch odds of FOMC hike from ~70% to ~85-90%. The 10-year yield jumped to 4.95-4.97%, pressuring non-yielding metal. Today's follow-through reflects pre-FOMC positioning: with a hike nearly fully priced and DXY firm near 99.0, real-rate headwinds persist, while WTI above $98 and Brent near $103 on Middle East supply risk keep energy-led inflation alive. Partial offset: central banks added 23t in July, with a record 45% of reserve managers planning further increases. Key event on the horizon: FOMC decision, September 16.
🔑 KEY LEVELS
Support: 4,300 | 4,285 | 4,250
Resistance: 4,400 | 4,440 | 4,520
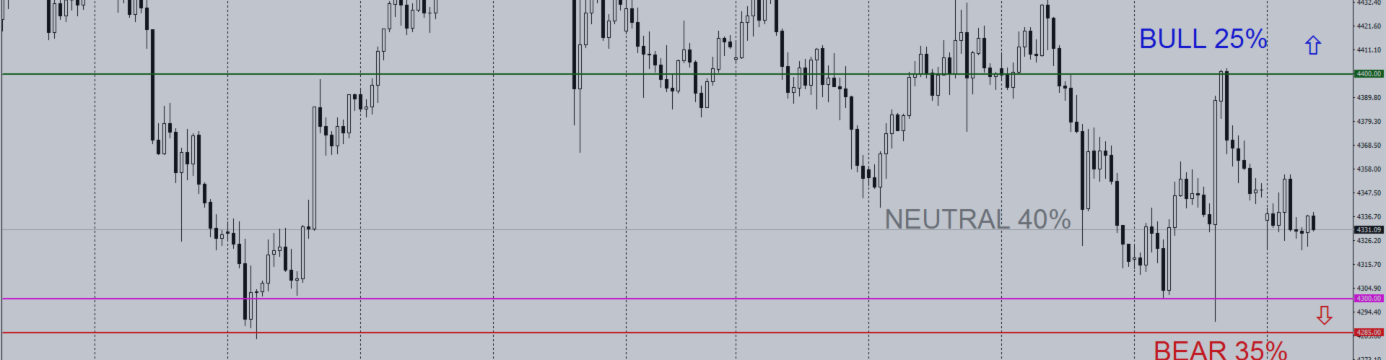
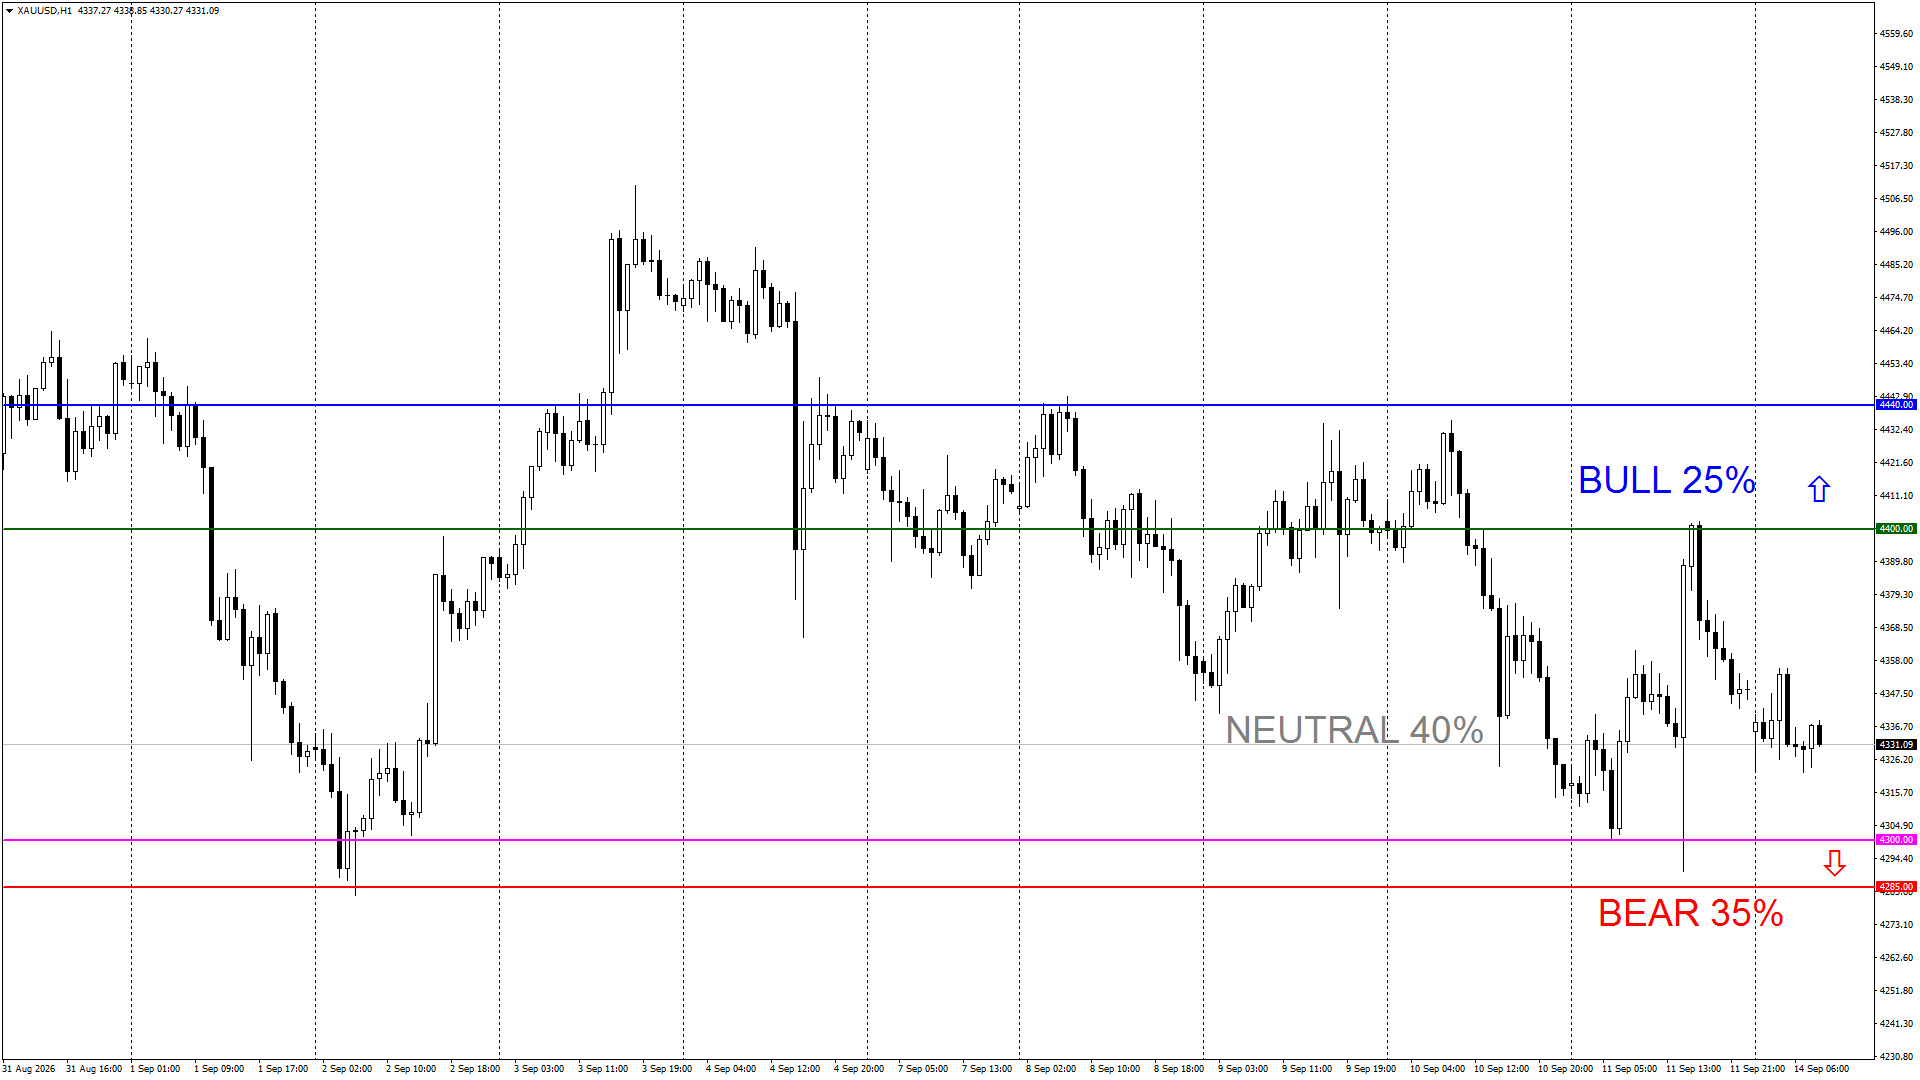
Decision rule: while H1 closes hold above 4,300, downside likely stays corrective within the range; a confirmed close below opens 4,285, whereas reclaiming 4,400 restores a constructive bias.
⚡ PROBABILISTIC SCENARIOS
Probabilities derive from a weighted historical-analog (KNN) scan of H1 states matching current 5/10/20-day returns, realized volatility and the lower-high/lower-low structure, with analog five-day outcomes weighted by similarity across the 2010-2025 sample.
BULL (25%): If price reclaims and holds above 4,400, potentially targeting 4,440, with stretch 4,520 as overhead supply mitigates; confirmation: two consecutive H1 closes above 4,400.
NEUTRAL (40%): If price oscillates between 4,300 and 4,400 into FOMC, characterized by range-bound consolidation and repeated rotations around midpoint 4,350; two-sided liquidity sweeps remain likely given the ~$90 average daily range.
BEAR (35%): If price breaks and sustains below 4,300, likely extending to 4,285 and then the 4,250 psychological floor; confirmation: a confirmed H1 close below 4,300.
📐 PRICE ACTION & MARKET STRUCTURE
From a structural perspective, the H1 chart shows a bearish lower-high, lower-low sequence since the September 3 premium peak at 4,520. Friday's CPI displacement candle swept buy-side liquidity above the rebound high into an H1 supply block at 4,395-4,405, then grabbed sell-side liquidity below 4,300 before mitigating back inside the range—a two-sided liquidity grab. Price now consolidates in discount of the 4,285-4,520 dealing range (equilibrium near 4,400), resting on an H1 demand zone at 4,300-4,310. Repeated wicks at both edges signal active liquidity generation; expect stop-raids rather than trend extension until FOMC forces mitigation of either boundary.
⚠️ DISCLAIMER: This content is strictly for educational and informational purposes only. It does not constitute financial advice, investment advice, trading signals, or a recommendation to buy or sell any instrument. Past performance does not guarantee future results. Always conduct your own research and consult a licensed financial advisor before making any investment decision.
💬 Where are you watching gold into Wednesday's FOMC—breakdown below 4,300 or a reclaim of 4,400? I'd genuinely love to hear your take. Drop it below.