
📊 MACRO SNAPSHOT
Gold is attempting to stabilize in the $4,400–$4,430 zone after a ~6% weekly correction from the August 27 high of $4,608 to September 2 lows near $4,333. The September 2 strike on two tankers in the Strait of Hormuz keeps Brent near $95, creating a two-sided macro effect: firmer crude reinforces inflation expectations and a higher-for-longer rate path (futures imply roughly a 35% probability of a September cut), with the 10Y Treasury yield near 4.31% capping gold; simultaneously, geopolitical risk underpins safe-haven demand. DXY consolidates near 99.20, a persistent headwind. Key event on the horizon: Friday's US nonfarm payrolls.
🔑 KEY LEVELS
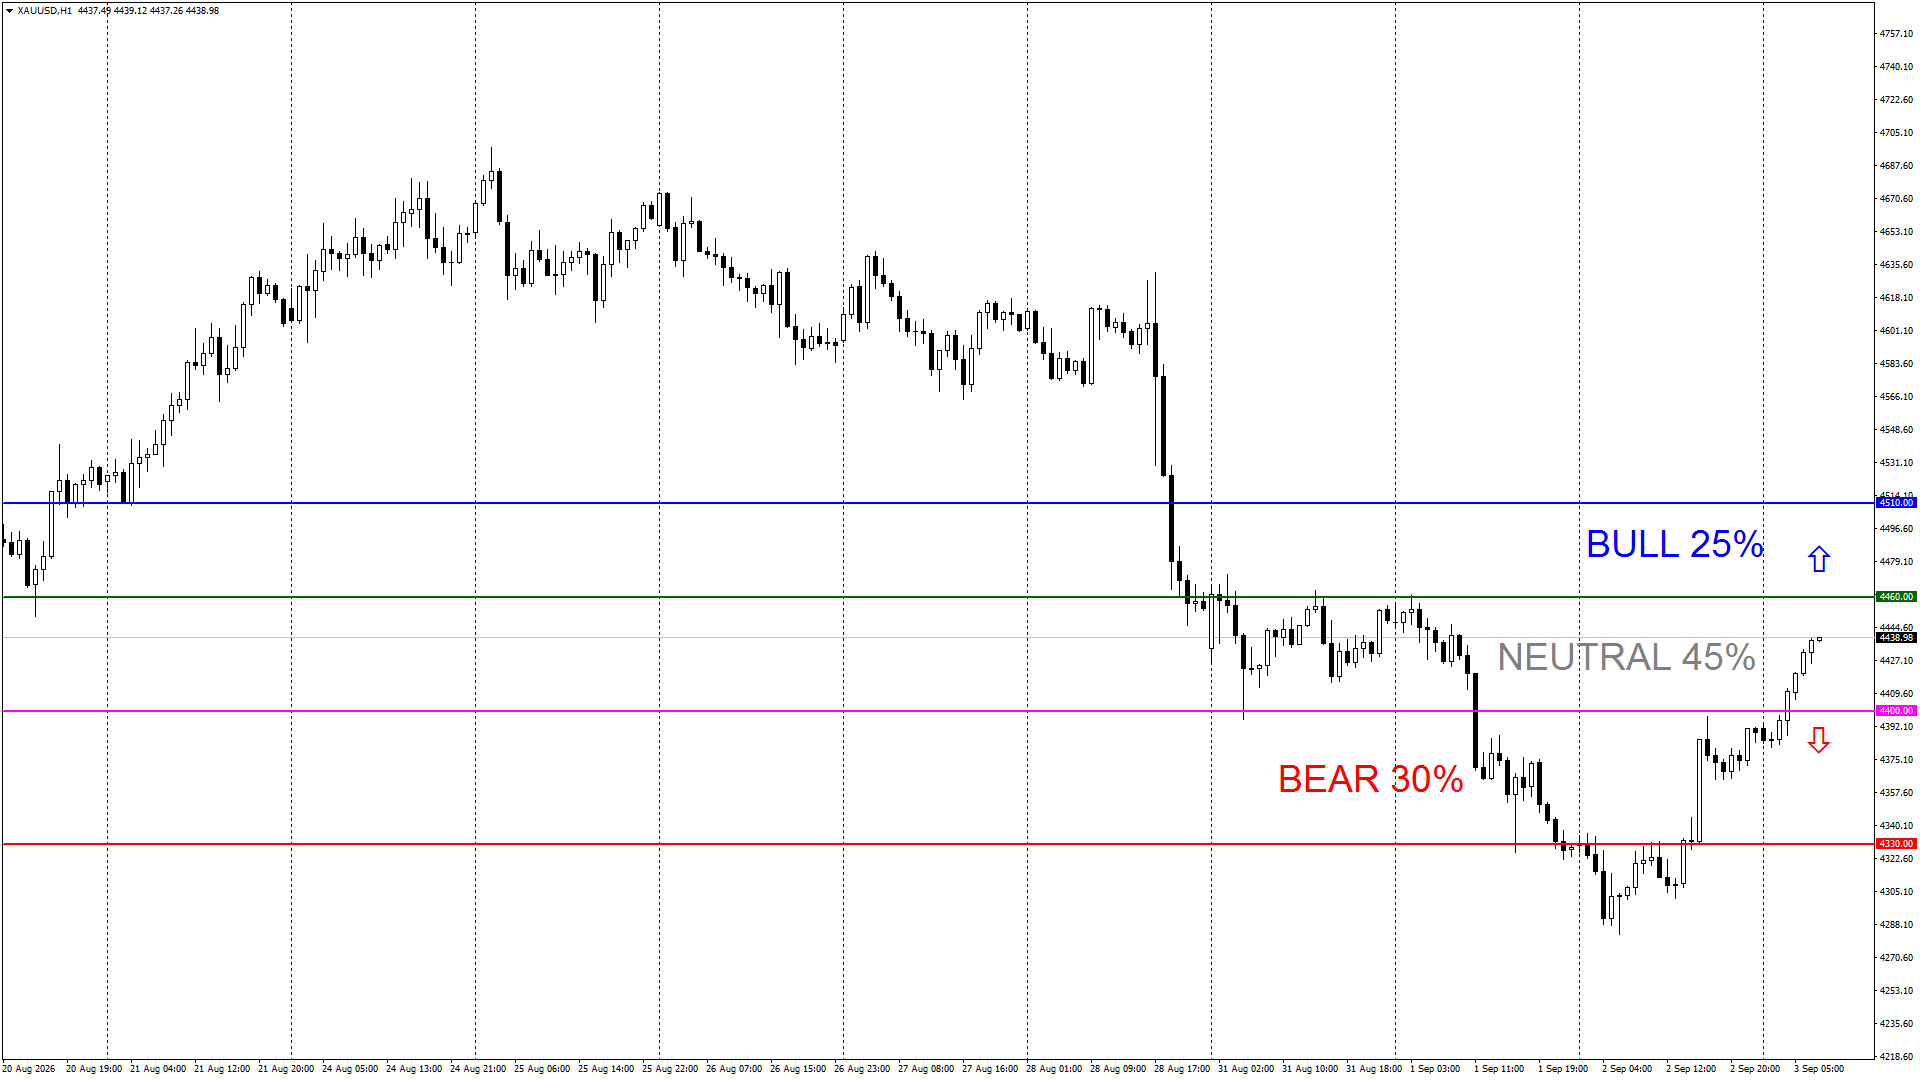
Support: 4,400 | 4,330 | 4,290
Resistance: 4,460 | 4,510 | 4,610
Decision rule: Stabilization remains valid while H1 closes hold above 4,400; a reclaim of 4,460 opens a mitigation leg, while loss of 4,400 revives the bearish bias toward the lows.
⚡ PROBABILISTIC SCENARIOS
Scenario weights are derived from weighted analog matching of prior post-displacement regimes in the H1 dataset (5/10/20-day returns, session range, volatility).
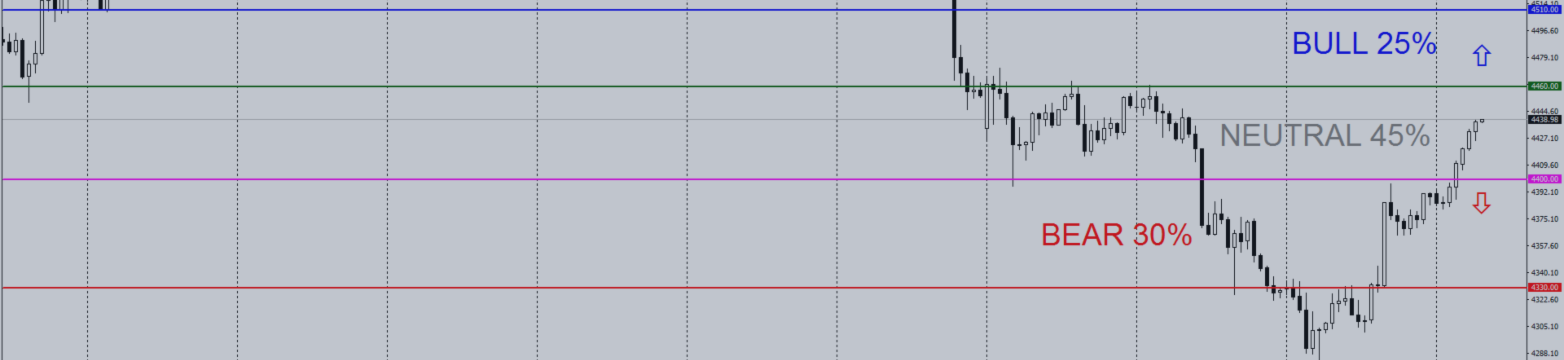
BULL (25%): If price reclaims and holds above 4,460, confirmed by two consecutive H1 closes, potentially targeting 4,510 and, on extension, the 4,610 supply block.
NEUTRAL (45%): If price oscillates between 4,400 and 4,460, a range-bound consolidation around the 4,430 midpoint, consistent with historical analogs following sharp weekly declines.
BEAR (30%): If price breaks and sustains below 4,400, with a confirmed H1 close, likely targeting 4,330 and, on deeper correction, the 4,290 liquidity pocket.
📐 PRICE ACTION & MARKET STRUCTURE
The H1 chart prints a bearish sequence of lower highs and lower lows from the 4,713 peak, with August 28 displacement candles carving a supply block at 4,510–4,610. Price now sits in discount relative to that dealing range (equilibrium near 4,500), working through a demand zone at 4,400–4,430. The September 2 sweep of sell-side liquidity below 4,330 and subsequent rebound suggest potential mitigation of overhead supply. Until buy-side liquidity above 4,460 is claimed, rallies remain corrective.
⚠️ DISCLAIMER: This content is strictly for educational and informational purposes only. It does not constitute financial advice, investment advice, trading signals, or a recommendation to buy or sell any instrument. Past performance does not guarantee future results. Always conduct your own research and consult a licensed financial advisor before making any investment decision.
💬 Where are you watching gold this session — breakout above 4,460 or a fade back to 4,400? I'd genuinely love to hear your take. Drop it below.