📊 MACRO SNAPSHOT Gold trades near $4,428 into a decisive week. August payrolls jumped 162K versus 56K expected, wages up 3.1% year-over-year, hardening bets for a Fed hike at the September 15-16 FOMC under Chair Kevin Warsh. DXY holds near 98.52, the 10-year yield near 4.7%, both pressuring bullion. WTI trades near $91, Brent near $96, with Middle East tensions keeping energy elevated. Central banks stay structural buyers, the World Gold Council projecting roughly 850 tonnes of 2026 official purchases, a persistent floor beneath pullbacks. Key catalyst: Thursday's August CPI. A hot print with yields and DXY rising together signals tightening risk and likely pressures gold, but a hot print with yields staying capped can instead flag fiscal risk that supports gold without Fed relief. A soft print only helps if yields actually fall too.
🔑 KEY LEVELS
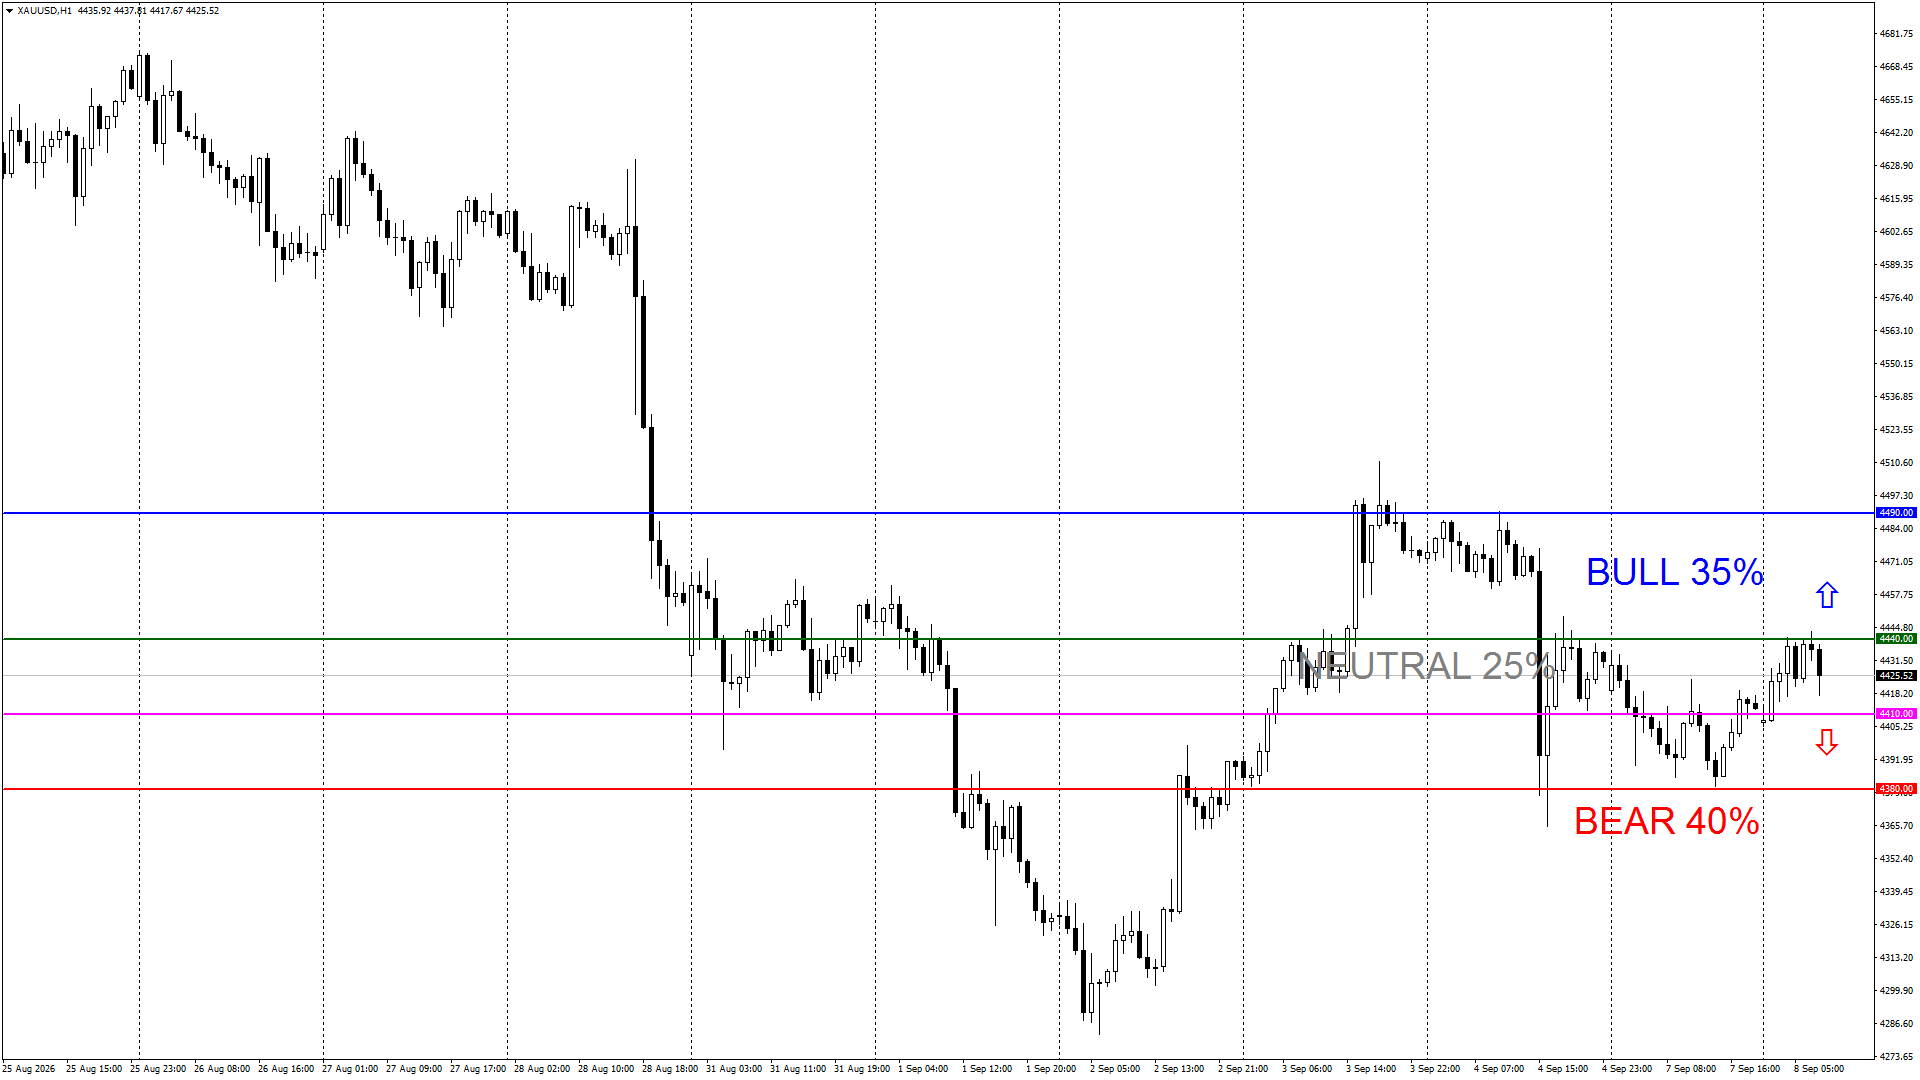
Support: 4,410 | 4,380 | 4,280
Resistance: 4,440 | 4,490 | 4,510
Decision rule: Holding above 4,410 keeps the short-term recovery structure intact; losing it opens the path toward 4,380 and the broader dealing range low.
⚡ PROBABILISTIC SCENARIOS
BULL (35%): If price reclaims and holds above 4,440, confirmed by two consecutive H1 closes above that level, upside potentially extends toward 4,490, with a stretch target near 4,510.
NEUTRAL (25%): If price oscillates between 4,410 and 4,440, range-bound consolidation likely persists around the 4,425 midpoint into Thursday's CPI print.
BEAR (40%): If price breaks and sustains below 4,410, confirmed by an H1 close under that level, downside potentially extends toward 4,380, with a deeper correction risk toward 4,280.
📐 PRICE ACTION & MARKET STRUCTURE From a structural perspective, the H1 chart shows a bullish displacement off the September 2 demand zone near 4,282, following a liquidity sweep of prior sell-side lows. Price has since printed a sequence of higher lows against a lower high from the September 3 supply block near 4,510, compressing into a narrowing dealing range. Current price sits close to equilibrium of that broader range, with buy-side liquidity resting above the 4,440-4,490 supply zone and sell-side liquidity resting below the 4,380-4,410 zone. A displacement candle through either boundary, followed by mitigation of the opposing array, would likely confirm directional continuation.
⚠️ DISCLAIMER: This content is strictly for educational and informational purposes only. It does not constitute financial advice, investment advice, trading signals, or a recommendation to buy or sell any instrument. Past performance does not guarantee future results. Always conduct your own research and consult a licensed financial advisor before making any investment decision.
💬 Where are you leaning this week — a breakout above 4,440 or a fade back toward 4,380 ahead of Thursday's CPI? Drop your read below.