
📊 MACRO SNAPSHOT
Gold has shed roughly 3.1% in 24 hours, sliding from the Sep 1 intraday high of $4,461 to near $4,320. The paradox of the session: the traditional safe haven is under pressure as the geopolitical shock morphs into an inflation risk. With Brent holding the $80–100 zone and July PCE at 3.3% — a full 1.3 points above the Fed's 2% target — markets are pricing a hawkish policy tilt, firming the dollar and Treasury yields and raising the opportunity cost of bullion. DXY strength and the 10-year yield remain the key intraday drivers. Central bank demand stays a structural floor, with ongoing PBoC accumulation reported, but the near-term macro wind is clearly against the metal.
Key event on the horizon: FOMC, September 15–16.
🔑 KEY LEVELS
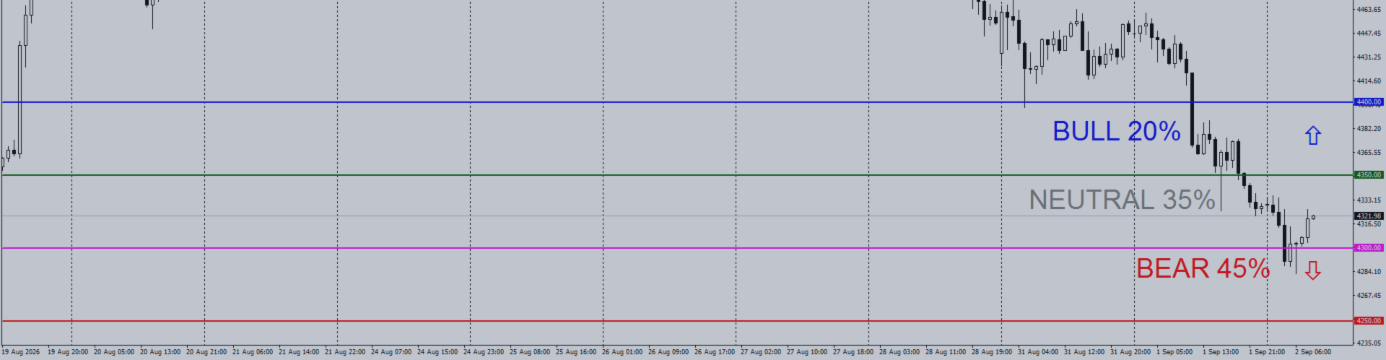
Support: 4,300 | 4,250 | 4,200
Resistance: 4,350 | 4,400 | 4,460
Decision rule: A confirmed H1 close above 4,350 shifts the intraday bias toward mean-reversion; a sustained close below 4,300 activates the continuation framework to the downside.

⚡ PROBABILISTIC SCENARIOS
Probabilities weighted from historical analogues of similar displacement declines within the H1 dataset.
BULL (20%): If price reclaims and holds above 4,350 — two consecutive H1 closes — potentially targeting 4,400, with a stretch zone at 4,460 where the prior supply block sits.
NEUTRAL (35%): If price oscillates between 4,300 and 4,350 and volatility compresses ahead of the FOMC, a range-bound consolidation is likely, with equilibrium near 4,325.
BEAR (45%): If price breaks and sustains below 4,300 — confirmed H1 close — opening 4,250, then the deep correction zone at 4,200, keeping the lower-high structure intact.
📐 PRICE ACTION & MARKET STRUCTURE
The H1 chart exhibits a clear market structure shift: sequential lower highs and lower lows since the Aug 24–25 top near 4,700. The Aug 28 displacement carved a fresh supply block overhead, and price now trades deep in the discount of the prior dealing range. Sell-side liquidity rests below the 4,300 psychological mark, while the Sep 1 rejection at 4,461 confirmed bearish mitigation of overhead supply. Until buy-side liquidity is reclaimed above 4,400, structure favors bears. A mitigation of the 4,400 order block would be the first stabilization hint.
⚠️ DISCLAIMER: This content is strictly for educational and informational purposes only. It does not constitute financial advice, investment advice, trading signals, or a recommendation to buy or sell any instrument. Past performance does not guarantee future results. Always conduct your own research and consult a licensed financial advisor before making any investment decision.
💬 Where are you watching gold this session — a reclaim of 4,350 or a fade back toward 4,300? I'd genuinely love to hear your take. Drop it below.