
📊 MACRO SNAPSHOT
Gold maintains elevated levels as markets digest mixed economic signals. Recent US inflation data shows Core PCE holding at 2.6% YoY, keeping pressure on the Federal Reserve to maintain restrictive policy. The DXY trades around 98.77, showing moderate strength that caps gold's upside momentum. WTI crude stabilizes near $84/barrel, providing some inflationary support for precious metals. Geopolitical tensions in the Middle East persist, with ongoing concerns about Red Sea shipping routes supporting safe-haven demand. US 10Y Treasury yields hover around 4.15%, creating opportunity cost headwinds for non-yielding assets. Central bank gold purchases remain robust, with PBoC and emerging market central banks continuing accumulation. Markets price in 65% probability of a 25bp cut at the next FOMC meeting in September.
🔑 KEY LEVELS
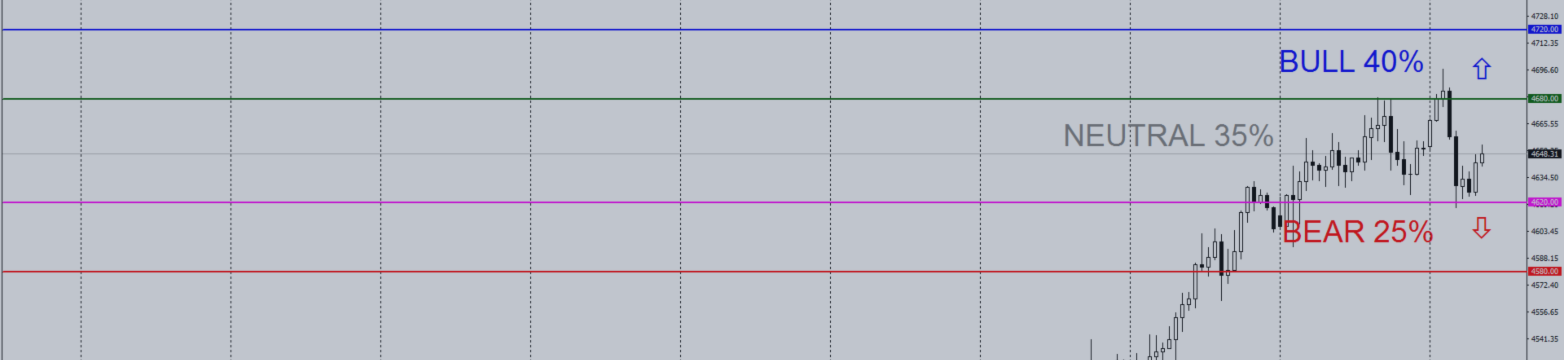
Support: $4,620 | $4,580 | $4,520
Resistance: $4,680 | $4,720 | $4,780
Decision rule: A confirmed H1 close above $4,680 opens path to $4,720, while breakdown below $4,620 targets $4,580 zone.

PROBABILISTIC SCENARIOS
BULL (40%): If price reclaims and holds above $4,680 with two consecutive H1 closes, potential extension toward $4,720, with stretch target at $4,780. Confirmation requires sustained buying pressure through the Asian-London overlap.
NEUTRAL (35%): If price oscillates between $4,620 and $4,680, expect range-bound consolidation with midpoint around $4,650. This scenario favors mean-reversion tactics within the established dealing range.
BEAR (25%): If price breaks and sustains below $4,620 with confirmed H1 close, potential decline toward $4,580, with deeper correction to $4,520 if selling accelerates. This would signal short-term structure breakdown.
📐 PRICE ACTION & MARKET STRUCTURE
From a structural perspective, the H1 chart exhibits a series of higher highs and higher lows from the $4,320 zone, establishing a clear bullish trend. Recent price action shows consolidation within a premium array between $4,640-$4,690. The market has created a supply block around $4,680-$4,690 where previous displacement candles originated. Current price trades in equilibrium, neither in deep discount nor extreme premium relative to the latest dealing range. A liquidity sweep above $4,690 occurred recently but failed to sustain, indicating sell-side liquidity was taken without follow-through. The order flow suggests mitigation of previous bullish order blocks around $4,620-$4,630. Watch for displacement candles to confirm directional bias—absence of such candles suggests continued range development before next impulsive move.
⚠️ DISCLAIMER: This content is strictly for educational and informational purposes only. It does not constitute financial advice, investment advice, trading signals, or a recommendation to buy or sell any instrument. Past performance does not guarantee future results. Always conduct your own research and consult a licensed financial advisor before making any investment decision.
💬 Where's your bias on gold this week — breakout above $4,680 or fade back to $4,620 support? I'd genuinely love to hear your perspective. Drop your take below.