How to Scan 5 Price Action Patterns Across Multiple Symbols in MT4

Candlestick patterns are commonly used in Price Action analysis, but monitoring several instruments and timeframes manually can become time-consuming.
For example, tracking 20 symbols across H1, H4 and D1 means checking 60 different symbol-timeframe combinations. Switching between charts repeatedly makes it easy to overlook a formation.
A multi-symbol scanner provides a more convenient way to organize this process. In this guide, I'll demonstrate how to monitor five candlestick patterns from a single MetaTrader 4 chart using Price Action Scanner PRO.
1. The Five Price Action Patterns
The scanner includes five independently configurable pattern detectors.
Pin Bar
A candlestick with a prominent shadow relative to its body. Pin Bars can indicate price rejection, although their significance depends on market context.
PPR (Pivot Point Reversal)
A three-candle reversal formation based on candle direction, price extremes and closing conditions.
Engulfing
A formation where the signal candle engulfs the previous candle's body and exceeds its high and low.
Fakey
A false breakout pattern. Price moves beyond a selected boundary by a configurable distance and then closes back across that boundary.
Inside Bar
A candle whose high and low remain within the range of the previous mother candle.
Each pattern uses its own detection rules. They should not be treated as interchangeable signals.
2. Setting Up Multi-Symbol Scanning
After attaching Price Action Scanner PRO to an MT4 chart, choose the instruments and timeframes to monitor.
There are two ways to select symbols:
-
Market Watch: Use the symbols available in the terminal's Market Watch window.
-
Custom list: Enter specific broker symbol names manually.
All nine standard MT4 timeframes are supported, from M1 to MN1.
By default, the scanner uses H1, H4 and D1, with a maximum of 20 instruments.
This allows up to 60 symbol-timeframe combinations with the default configuration.
For a simple starting setup, consider monitoring a small group of familiar instruments on H1 and H4 before enabling additional timeframes.
The scanner requires the relevant price history to be available. Initial synchronization may take some time, especially when many symbols and timeframes are selected.
3. Understanding the Dashboard
The indicator provides two main views.
Market Scanner
Market Scanner organizes monitored symbols into rows and timeframes into columns.
Each cell shows the most recent qualifying confirmed pattern within the configured signal age.
Signal information includes the pattern, its BUY or SELL direction and its age in candles.
The display offers two modes:
-
Active Only — shows instruments with recent confirmed signals.
-
All Symbols — shows all monitored instruments, including those without active signals.
The default maximum signal age is three closed candles.
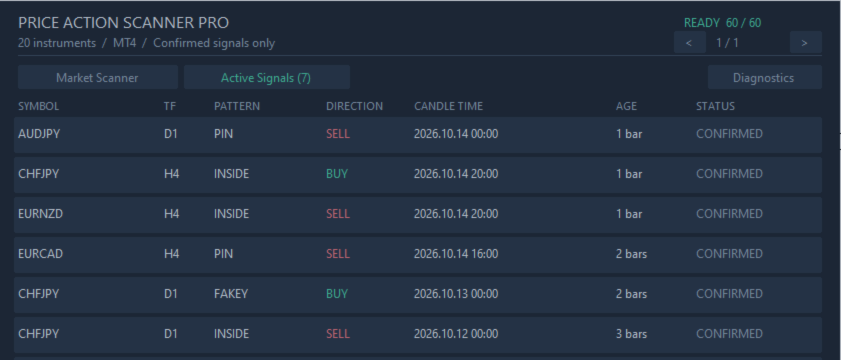
Active Signals
Active Signals provides a more detailed list of detected formations.
It includes the symbol, timeframe, pattern name, direction, candle time and signal age.
Signal age is calculated using the timeframe where the pattern appeared:
-
Age 1: the latest closed candle.
-
Age 2: the second latest closed candle.
-
Age 3: the third latest closed candle.
A signal on H4 is therefore measured in H4 candles, independently of the timeframe of the chart hosting the scanner.
4. Confirmed vs. Forming Patterns
Understanding the difference between confirmed and forming signals is important.
A CONFIRMED pattern has been detected on a closed candle.
However, CONFIRMED does not necessarily mean that the pattern was discovered just now. The scanner can also display qualifying historical formations during initialization.
The optional FORMING mode allows preliminary detection on the currently developing candle.
Forming previews are available for Pin Bar, PPR and Engulfing.
Because the candle has not closed, these formations may change or disappear.
FORMING signals are displayed only in Active Signals and do not generate notifications.
Fakey and Inside Bar are confirmed-only patterns.
5. Opening a Detected Pattern on the Chart
A scanner becomes more useful when detected patterns can be examined in their original chart context.
In Price Action Scanner PRO, clicking a signal attempts to open or reuse the corresponding symbol and timeframe chart.
When the necessary price history is available, the indicator navigates to the signal candle and places a temporary highlight.
BUY formations are marked with a green arrow, while SELL formations are marked with a red arrow.
The pattern name is displayed near the highlighted candle.
This makes it easier to examine nearby support and resistance levels, market structure and the price action preceding the formation.
A detected pattern should always be evaluated within its broader market context rather than used as an isolated trading decision.
6. Configuring Notifications
When monitoring multiple markets, notifications can reduce the need to watch the dashboard continuously.
Three notification methods are available:
-
Popup alerts in MetaTrader 4.
-
Push notifications to a mobile MetaTrader application.
-
Sound alerts.
Patterns and timeframes can be selected independently for notifications.
For example, a trader might scan H1, H4 and D1 but enable notifications only for selected patterns on H4.
Notifications are intended for eligible new confirmed patterns on the latest closed candle.
Initially loaded historical signals and preliminary FORMING patterns do not trigger alerts.
Push notifications require the MetaQuotes ID to be configured in MT4. The terminal also needs an active connection to receive and process new market data.
7. Practical Tips
When using a multi-symbol Price Action scanner, a few habits can make the workflow clearer.
Start with fewer instruments. A smaller watchlist makes it easier to understand how patterns appear across different timeframes.
Use the signal age filter. Recent formations are easier to distinguish from older historical patterns.
Review the chart before making decisions. A Pin Bar near an important price level may have different significance from a similar candle in the middle of a trading range.
Understand the direction labels. BUY and SELL represent directions assigned by the detection rules. For example, the Inside Bar detector determines direction from the inside candle's body; the label does not confirm a breakout.
Separate scanning from trading decisions. Pattern detection provides information, not a complete trading strategy.
Conclusion
Monitoring multiple symbols and timeframes manually can be repetitive. A multi-symbol candlestick scanner organizes recent Price Action formations in one place, making it easier to review charts and focus on patterns of interest.
The examples in this guide use Price Action Scanner PRO for MetaTrader 4, which combines Pin Bar, PPR, Engulfing, Fakey and Inside Bar detection with an interactive dashboard, chart navigation and configurable notifications.
Indicator page: https://www.mql5.com/ru/market/product/200117
Disclaimer: Candlestick patterns do not guarantee future price movement or profitable trades. The indicator is intended for technical analysis and does not automatically execute trades.