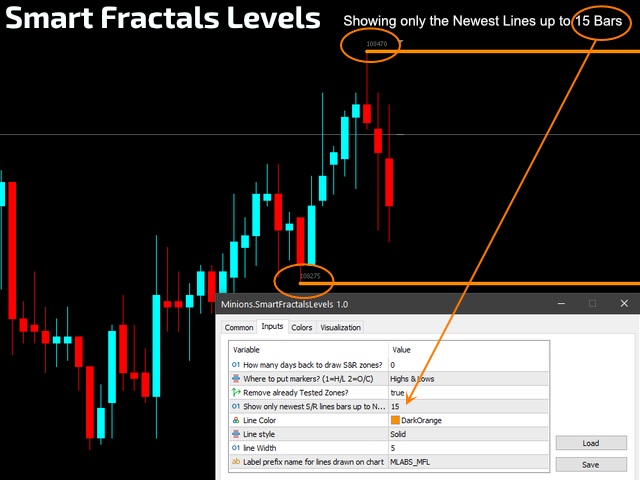
Smart Fractals Levels
- Indicadores
-
Flavio Javier Jarabeck
 We are a closed brotherhood of traders whose ultimate goal is to profit through well-studied, structured, and automated trades. As a result, we publish dozens of MT5 indicators (FREE and paid) to the global MQL5 community. 80% of our published products are high-quality free indicators so beginner
 - Versão: 1.0
- Ativações: 20
COMO "LER" ESTE INDICADOR
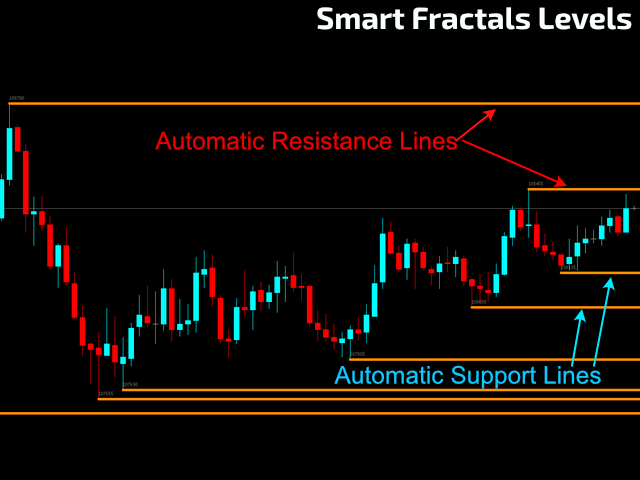
- Se você conhece o conceito de Suporte e Resistências, você está pronto para usar este indicador.
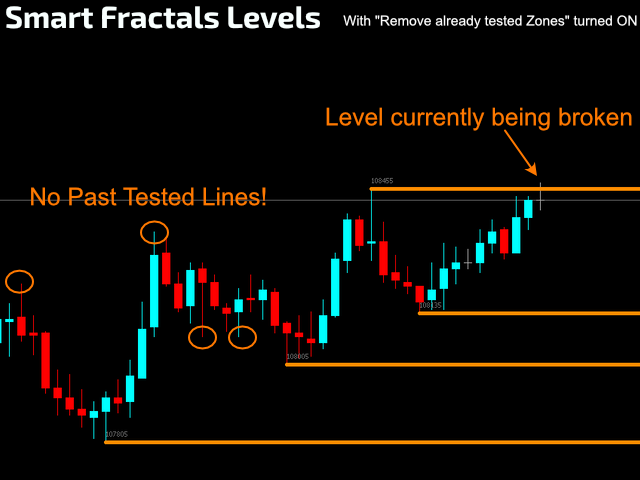
- A única diferença é que o Smart Fractals Levels podem filtrar todos os Suportes e Resistências já visitados pelo Preço, com várias opções como você verá na seção PARÂMETROS abaixo. Dessa forma, você pode ter uma visão mais precisa do comportamento e regiões do Preço.
- Você também pode adicionar 2 ou mais instâncias do indicador no mesmo gráfico para "ver" diferentes padrões de análise.
- Você pode usar este indicador como uma efetiva ferramenta de Stop Loss para encontrar regiões lógicas para posicionar sua estratégia de saída em caso de "as coisas deram errado ..."
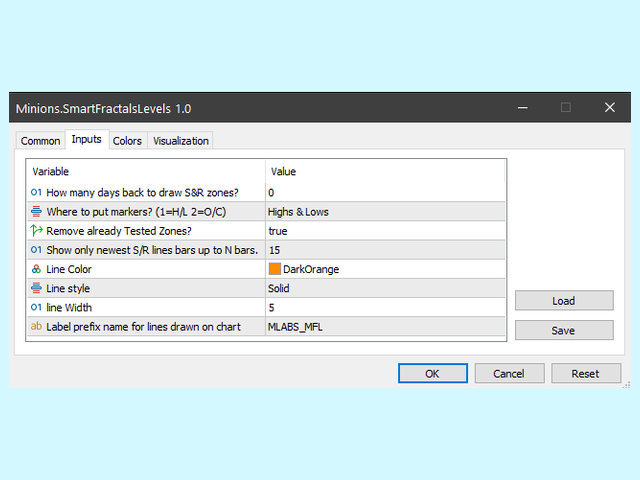
DEFINIÇÕES
- How Many Days Back to Draw S&R Zones? - Você decide quantos dias para trás deseja analisar e desenhar as linhas de S&R.
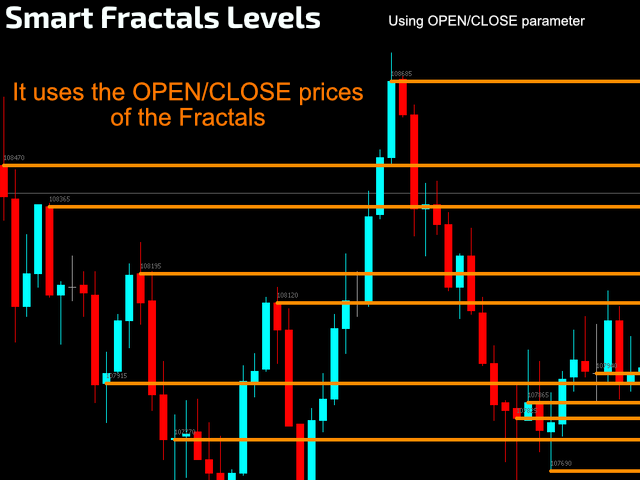
- Where to Put the Markers? - Você escolhe se deseja desenhar as linhas nas Máximas e Mínimas OU, na Abertura e Fechamento dos candles.
- Remove Already Tested Zones? - Uma vez que o preço tenha "visitado" esta linha S&R, ela será removida de seu gráfico no fechamento do candle atual.
- Show Only the Newest S&R Lines up to N Bars - Este modo permite que você capture, por exemplo, movimentos curtos de Breakout e Retrações.
- Line Color / Style / Width - Você decide como suas linhas ficarão.
- Label Prefix for the Lines - Caso você esteja usando 2 ou mais instâncias deste indicador no mesmo gráfico, para evitar conflito, basta nomeá-los de forma diferente e está tudo ficará bem!
BUFFERS PARA SEU EA
Este indicador é compatível com o EA, portanto, veja abaixo todos os buffers disponíveis para você usar em seu próprio EA:
#2 - Linhas de Suporte disponíveis - de acordo com as configurações do indicador que você escolheu. Este buffer conterá os PREÇOS de Suportes ativos, caso contrário, o resto da matriz será preenchido com ZERO.
#3 - Linhas de Resistência disponíveis - de acordo com as configurações do indicador que você escolheu.
#4 - Linhas de Suporte disponíveis como TEMPO - Indicando quando foram criadas. Esta matriz corresponde ao buffer #2, para que você possa combinar facilmente os dados de tempo e preço entre tempo.
#5 - Linhas de Resistência disponíveis como TEMPO - Indicando quando foram criadas. Esta matriz corresponde ao buffer #3, para que você possa combinar facilmente os dados de tempo e preço entre eles.
Observe que os buffers #4 e #5 são do tipo de dados DOUBLE. Use as funções adequadas ou Type Casting para converter de volta para um tipo de dados Datetime.
Se você quiser experimentar gratuitamente este indicador em sua conta REAL ou DEMO, leia estas instruções de nosso Blog: https://www.mql5.com/pt/blogs/post/747042 |
|---|
Não encontrou o recurso de que precisa?
Nenhum produto é perfeito para todos. Se você acha que precisa de um recurso que está faltando em nosso produto, envie-nos uma mensagem. Adoramos feedback!
Sobre nós
Flavio Jarabeck é o proprietário da MinionsLabs.com, um empreendimento focado em alavancar o conhecimento e a experiência de traders profissionais por meio de robôs de negociação automatizados, liberando-os para buscar novas oportunidades e estratégias em novos mercados e ativos. ;)