Pluuto Alert Pro

5

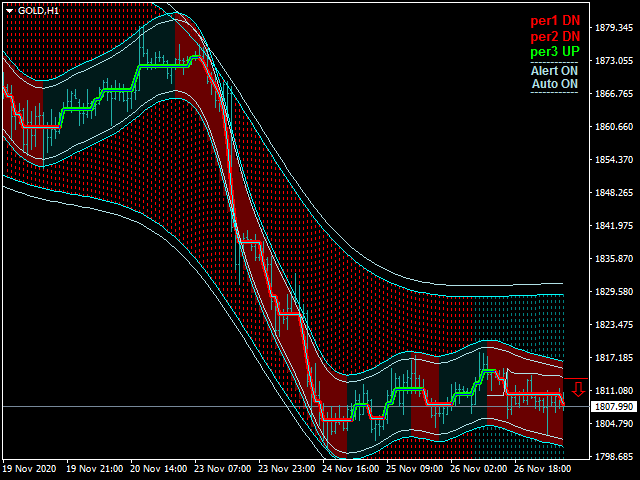
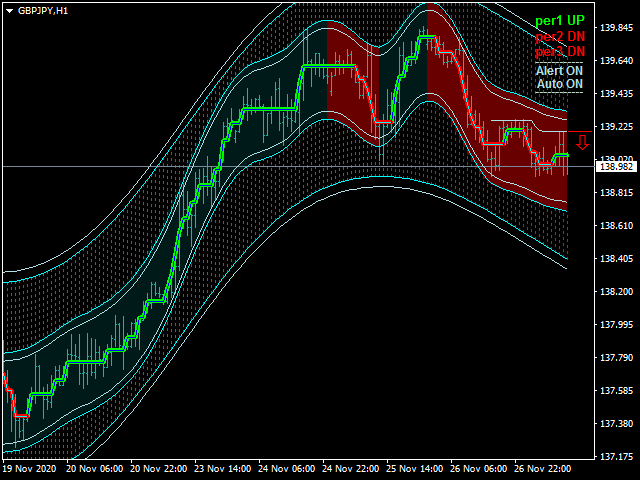
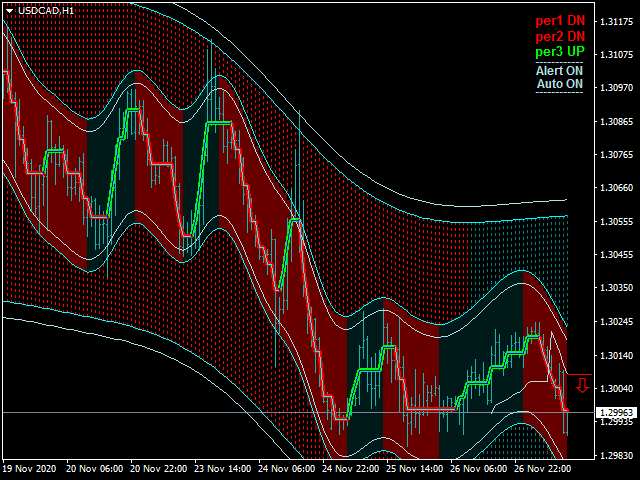
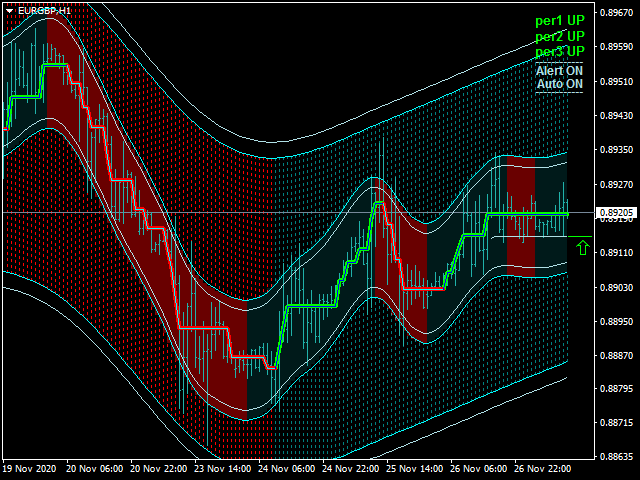
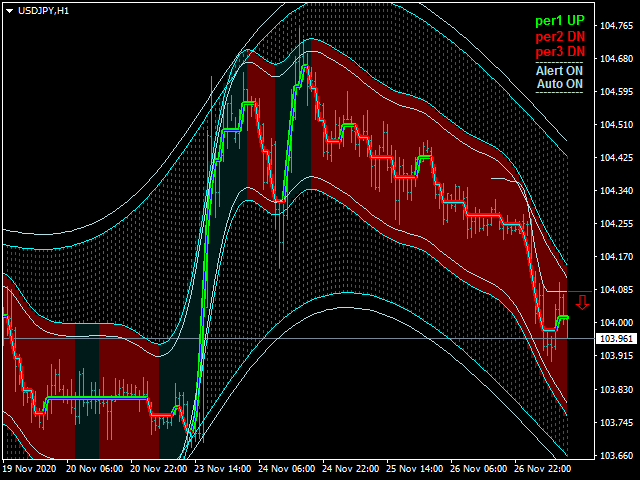
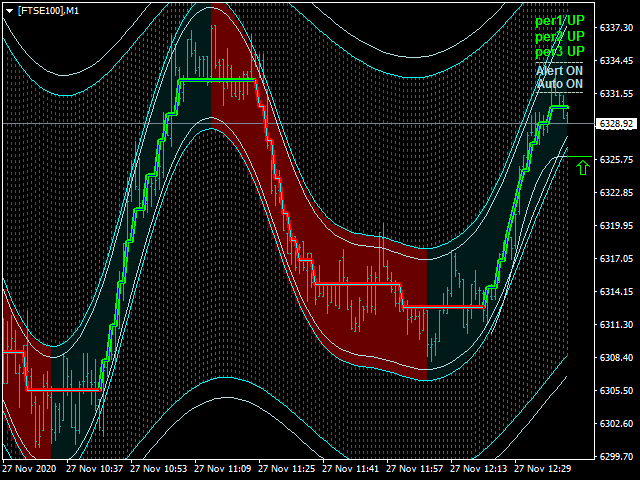
This indicator Pluuto Alert Pro indicator.Indicator displays trend movement.Indicator calculates automatically line.Alert = (FiltPer1,Line1_Arrow).When the alert is up the next alert is down,when the alert is down the next alert is up (new bar).

Features

  • FiltPer1 - displays indicator period.Per1
  • FiltPer2 - displays indicator period.Per2.
  • FiltPer3 - displays indicator period.Per3.
  • Multiplier1_per1 - displays indicator multiplier.(FlitPe1,step)
  • Multiplier2_line1 - displays indicator multiplier.(Line1)
  • Line1_bb - displays indicator Line1 bars back.
  • Deviation1_per3 - displays indicator deviation.(FiltPer3)
  • Deviation2_per3 - displays indicator deviation.(FiltPer3)
  • Deviation3_per2 - displays indicator deviation.(FiltPer2)
  • Deviation4_per2 - displays indicator deviation.(FiltPer2)
  • Trend - displays indicator trend (true/false).
  • Trend Alert - displays indicator trend alert (true/false).
  • Auto_Inpunts - displays Auto Inpunts (true/false).
  • Line1_Arrow - displays indicator Line1_arrow (true/false).
  • X - move the trend left and right.
  • Y - move the trend up and down.  

How to understand the status:

  • If the Trend color is green, trend is up.
  • If the Trend color is red, trend is down.


Auto_Inpunts;

  • (Timeframe M1)- FiltPer1=35;FiltPer2=150;FiltPer3=1000;Multiplier1_per1= 0.3;Multiplier2_line1=0.4;deviation1_per3=3.0;deviation2_per3 = 3.3 ;  deviation3_per2=2.0 ;deviation4_per2=2.4 
  • (Timeframe M5)- FiltPer1=35;FiltPer2=150;FiltPer3=1000;Multiplier1_per1=0.2;Multiplier2_line1=0.3;deviation1_per3=3.0;deviation2_per3=3.3 ;  deviation3_per2=2.0;deviation4_per2=2.4
  • (Timeframe M15)- FiltPer1=35;FiltPer2=150;FiltPer3=1000;Multiplier1_per1=0.2;Multiplier2_line1=0.3;deviation1_per3=3.0;deviation2_per3=3.3 ;  deviation3_per2=2.0;deviation4_per2=2.4
  • (Timeframe M30)- FiltPer1=30;FiltPer2=150;FiltPer3=1000;Multiplier1_per1=0.2;Multiplier2_line1=0.3;deviation1_per3=3.0;deviation2_per3=3.3 ;  deviation3_per2=2.0;deviation4_per2=2.4
  • (Timeframe H1)- FiltPer1=15;FiltPer2=100;FiltPer3=1000;Multiplier1_per1=0.2;Multiplier2_line1=0.3;deviation1_per3=3.0;deviation2_per3=3.3 ;  deviation3_per2=2.0;deviation4_per2=2.4
  • (Timeframe H4)- FiltPer1=15;FiltPer2=50;FiltPer3=1000;Multiplier1_per1=0.1;Multiplier2_line1=0.3;deviation1_per3=3.0;deviation2_per3=3.3 ;  deviation3_per2=2.0;deviation4_per2=2.4
  • (Timeframe D1)- FiltPer1=15;FiltPer2=50;FiltPer3=1000;Multiplier1_per1=0.1;Multiplier2_line1=0.3;deviation1_per3=3.0;deviation2_per3=3.3 ;  deviation3_per2=2.0;deviation4_per2=2.4
  • (Timeframe W1)- FiltPer1=15;FiltPer2=50;FiltPer3=1000;Multiplier1_per1=0.1;Multiplier2_line1=0.3;deviation1_per3=3.0;deviation2_per3=3.3 ;  deviation3_per2=2.0;deviation4_per2=2.4
  • (Timeframe MN1)- FiltPer1=15;FiltPer2=50;FiltPer3=1000;Multiplier1_per1=0.0;Multiplier2_line1=0.3;deviation1_per3=3.0;deviation2_per3=3.3 ;  deviation3_per2=2.0;deviation4_per2=2.4         


    //////////////////////////////////////////////////////////////////////////////////////////////////////////////////////////////////////////////////////

    //////////////////////////////////////////////////////////////////////////////////////////////////////////////////////////////////////////////////////

    //////////////////////////////////////////////////////////////////////////////////////////////////////////////////////////////////////////////////////

    /////////////////////////////////////////////////////////////////////////////////////////////////////////////////////////////////////////////////////


Comentários 1
lorenzo_mella
824
lorenzo_mella 2024.08.30 13:43 
 

ho aquistato questo indicatore e premetto che sono nuovo nel trading ma mi ha risolto tanti problemi è il migliore che ho comprato voto 5 peccato però che non ha gli avvisi sul dispositivo mobile il resto è perfetto.

Produtos recomendados
Power Renko is an indicator which plots Renko bricks underneath the chart using a histogram. You can select the brick size and the timeframe of the Renko bricks as well as whether or not to use the close price or the high/low price of the candles. Renko bricks are based on price alone, not time, therefor the Renko bricks will not be aligned with the chart's time. They are extremely useful for trend trading and many different strategies can be formed from them. Buffers are provided allowing you t
Owl smart levels
Sergey Ermolov
4.24 (37)
Versão MT5  |  FAQ O   Indicador Owl Smart Levels   é um sistema de negociação completo dentro de um indicador que inclui ferramentas populares de análise de mercado, como   fractais avançados de Bill Williams , Valable ZigZag que constrói a   estrutura de onda correta   do mercado e   níveis de Fibonacci que marcam os níveis exatos de entrada no mercado e lugares para obter lucros. Descrição detalhada da estratégia Instruções para trabalhar com o indicador Consultor de negociação Owl Helper Ch
Chart Patterns Detect 15 patterns (Ascending Triangle, Descending Triangle, Rising Wedge, Falling Wedge, Bullish Flag, Bearish Flag, Bullish Rectangle, Bearish Rectangle Symmetrical triangle, Head and Shoulders, Inverted Head and Shoulders, Triple top, Triple Bottom, Double Top, Double Bottom) Use historical data to calculate the probability of each pattern to succeed (possibility to filter notification according to the chance of success) gives graphic indication about the invalidation level and
Introducing the POWER TRADE Indicator Created by a small group of experienced traders with years of profitable experience in the financial markets, the Power Trade Indicator is a plug-and-play trading tool designed to help traders spot high-quality setups with ease and confidence. What It Does: It provides powerful entry signals, profit-taking zones, and rebound areas — giving you a complete view of where price action is most likely to move next. The indicator reacts in real time, al
O indicador Crypto_Forex "Auto FIBO Pro" é uma ótima ferramenta auxiliar na negociação! - O indicador calcula e coloca automaticamente no gráfico os níveis de Fibonacci e as linhas de tendência locais (cor vermelha). - Os níveis de Fibonacci indicam áreas-chave onde o preço pode reverter. - Os níveis mais importantes são 23,6%, 38,2%, 50% e 61,8%. - Pode utilizá-lo para scalping de reversão ou para negociação de grelha de zona. - Existem muitas oportunidades para melhorar o seu sistema atual u
Stepping Trend
Mpendulo Chiliza
The Stepping Trend Indicator     The Steppi ng Trend indicator uses the  average true range  (ATR indicator) in its calculation. This gives you control to set your own average true range period, I set the Default as 10.   Indicator Details. Green Arrow Up: This means you are at the starting point of a new bullish trend, it’s time to buy.   Red  Arrow  Down : This means you are at the starting point of a new  bearish  trend, it’ s time to sell .   What if you miss the Arrow Signal?   No prob
The Th3Eng PipFinite indicator is based on a very excellent analysis of the right trend direction with perfect custom algorithms. It show the true direction and the best point to start trading. With StopLoss point and Three Take Profit points. Also it show the right pivot of the price and small points to order to replace the dynamic support and resistance channel, Which surrounds the price. And Finally it draws a very helpful Box on the left side on the chart includes (take profits and Stop loss
Noize Absorption Index MT4
Ekaterina Saltykova
5 (1)
Noize Absorption Index - is the manual trading system that measures the difference of pressure between bears forces and bulls forces. Green line - is a noize free index that showing curent situation. Zero value of index shows totally choppy/flat market.Values above zero level shows how powerfull bullish wave is and values below zero measures bearish forces.Up arrow appears on bearish market when it's ready to reverse, dn arrow appears on weak bullish market, as a result of reverse expectation. S
Intraday Levels shows intraday levels grid for intraday trading Shows a grid for the day levels, gives you a guide to know the trend and to measure intraday trades (stop-loss and take-profit). Parameters are: Levels Mode: Basic mode: Shows highest, lowest and middle levels. Advanced mode: Shows highest, lowest, middle and intermediate levels. Fibonacci mode: Shows session Fibonacci retracements levels. Momentum mode: Shows delayed Advanced levels to identify momentum. Smooth Period (Momentum m
PipFinite Trend PRO
Karlo Wilson Vendiola
4.88 (2248)
Breakthrough Solution For Trend Trading And Filtering With All Important Features Built Inside One Tool! Trend PRO's smart algorithm detects the trend, filters out market noise and gives entry signals with exit levels. The new features with enhanced rules for statistical calculation improved the overall performance of this indicator. Important Information Revealed Maximize the potential of Trend Pro, please visit www.mql5.com/en/blogs/post/713938 The Powerful Expert Advisor Version Automatin
VR Cub
Vladimir Pastushak
VR Cub é um indicador para obter pontos de entrada de alta qualidade. O indicador foi desenvolvido para facilitar cálculos matemáticos e simplificar a busca por pontos de entrada em uma posição. A estratégia de negociação para a qual o indicador foi escrito tem provado a sua eficácia há muitos anos. A simplicidade da estratégia de negociação é a sua grande vantagem, o que permite que até mesmo os comerciantes novatos negociem com sucesso com ela. VR Cub calcula os pontos de abertura de posição e
Heiken Ashi candle chart is an improved version of The Japanese candle chart, which can effectively filter the market "noise" of the Japanese candle chart. It is favored by many traders for its simplicity and intuition. For trend traders, the HA candle chart is a magic tool. Unlike the traditional Japanese candle chart, Heikenashi does not reflect the opening price, high price, low price and closing price of the market. Instead, Heikenashi calculates the value of a single K line in the dominant
Pluuto Alert
Mati Maello
1 (1)
This indicator Pluuto Alert indicator.Indicator displays trend movement. Indicator calculates automatically line.Alert = arrow.When the alert is up the next alert is down,when the alert is down the next alert is up (new bar). Features FiltPer - displays indicator period.Line1. FiltPer2 - displays indicator period.Line2. Multiplier - displays indicator multiplier.(FlitPer,Line1;step) Deviation1 - displays indicator deviation.(Line2) Deviation2 - displays indicator deviation.(Arrow) Trend - displa
Infinity Trend Pro
Yaroslav Varankin
1 (1)
This is a trend indicator without redrawing Developed instead of the binary options strategy (by the color of the Martingale candlestick) Also works well in forex trading When to open trades (binary options) A signal will appear in the place with a candle signaling the current candle It is recommended to open a deal for one candle of the current timeframe M1 and M5 When a blue dot appears, open a deal up When a red dot appears, open a trade down. How to open trades on Forex. When a signal is rec
Os indicadores [ZhiBiCCI] são adequados para todo o ciclo de uso e também são adequados para todas as variedades do mercado. [ZhiBiCCI] Linha sólida verde é uma inversão da divergência de alta. A linha pontilhada verde é uma divergência de alta clássica. [ZhiBiCCI] A linha sólida para o vermelho é uma divergência de baixa reversa. A linha pontilhada vermelha é uma divergência clássica de baixa. [ZhiBiCCI] pode ser definido nos parâmetros (Alerta, Enviar e-mail, Enviar notificação), definido c
Alpha Trend sign has been a very popular trading tool in our company for a long time. It can verify our trading system and clearly indicate trading signals, and the signals will not drift. Main functions: Based on the market display of active areas, indicators can be used to intuitively determine whether the current market trend belongs to a trend market or a volatile market. And enter the market according to the indicator arrows, with green arrows indicating buy and red arrows indicating se
Trend Oscillator - é um indicador Crypto_Forex personalizado avançado, uma ferramenta de negociação eficiente! - É utilizado um novo método de cálculo avançado - 20 opções para o parâmetro "Preço para cálculo". - O oscilador mais suave alguma vez desenvolvido. - Cor verde para tendências ascendentes, cor vermelha para tendências descendentes. - Valores de sobrevenda: abaixo de 5, Valores de sobrecompra: acima de 95. - Existem muitas oportunidades para atualizar até mesmo as estratégias padrão
This is an arrow indicator without a future function,developed based on the most advanced profit trading algorithms.It has the most innovative and advanced dual trend analysis module, as well as the latest and highly effective market trend prediction algorithm.Trends are your friends, and following larger trends can earn the maximum profit in foreign exchange. This indicator helps traders identify current trends and track them. Someone once made a profit of 10 times in a week by relying on it.No
Super Reversal Pattern
Parfait Mujinga Ndalika
Super Reversal Pattern Indicator Unlock the power of advanced pattern recognition with our Super Reversal Pattern Indicator. Designed for traders seeking precision and reliability, this indicator identifies one of the most effective reversal patterns in technical analysis, offering a significant edge in your trading strategy. Key Features: Non-Repainting Accuracy: Enjoy the confidence of non-repainting technology. Once a Super Reversal Pattern is detected, it remains static, providing consiste
Introduction It is common practice for professional trades to hide their stop loss / take profit from their brokers. Either from keeping their strategy to the themselves or from the fear that their broker works against them. Using this indicator, the stop loss / take profit points will be drawn on the product chart using the bid price. So, you can see exactly when the price is hit and close it manually.  Usage Once attached to the chart, the indicator scans the open orders to attach lines for t
Advanced Trend Regime
Shellard Securities (Pty) Ltd
The indicator has been designed to function on any time-frame and any pair.   This regime filter will help the trader better evaluate whether the current market is trending, and in which direction. It quickly reacts to changes in market dynamics using a series of advanced calculations. The user is able to select whether the calculation remains standard, or if a further filter constraint is added to the calculation.   A Yellow moving average of the signal has been included for the trader to smoot
Trend Ray
Andriy Sydoruk
The indicator shows the potential trend direction by cyclical-wave dependence. Thus, all the rays of the intersection will be optimal rays, in the direction of which the price is expected to move, taking into account the indicator period. Rays can be used as a direction for potential market movement. But we must not forget that the approach must be comprehensive, the indicator signals require additional information to enter the market.
Trendiness Index
Libertas LLC
5 (3)
"The trend is your friend" is one of the best known sayings in investing, because capturing large trendy price movements can be extremely profitable. However, trading with the trend is often easier said than done, because many indicators are based on price reversals not trends. These aren't very effective at identifying trendy periods, or predicting whether trends will continue. We developed the Trendiness Index to help address this problem by indicating the strength and direction of price trend
Binary Options Support Resistance Indicator This indicator is designed for binary options trading and effectively shows retracements from support and resistance levels. Signals appear on the current candle. A red arrow pointing downwards indicates a potential selling opportunity, while a blue arrow pointing upwards suggests buying opportunities. All that needs adjustment is the color of the signal arrows. It is recommended to use it on the M1-M5 timeframes as signals are frequent on these timef
Renko, Heiken Ashi, Ticks Bar, Range Bar.    Easy switching, easy setup, all in one window.        Place the Custom Chart indicator and view Renko, Heiken Ashi, Tick bar, Range bar charts in real time at real chart.    Position the offline chart window so that the indicator control panel is visible.    Switch the chart mode by click of a button.    Connect to the output chart any indicator, expert advisor without any restrictions.    No, it doesn't work in the tester.    Yes, you can use an
Antes de tudo, vale ressaltar que esta Ferramenta de Negociação é um Indicador Não Repintante, Não Redesenhante e Não Atrasado, o que a torna ideal para negociação profissional. Curso online, manual do utilizador e demonstração. O Indicador de Conceitos de Ação de Preço Inteligente é uma ferramenta muito poderosa tanto para traders novos quanto experientes. Ele combina mais de 20 indicadores úteis em um único, combinando ideias avançadas de negociação como Análise do Trader do Círculo Interno e
Heiken Ashi Smoothed Strategy is a very simple but powerful system to get forex market trend direction. This indicator is actually 2 indicators in 1 pack, Heiken Ashi and Heiken Ashi Smoothed Moving Average both included. Because HA (Heiken Ashi) and HAS (Heiken Ashi Smoothed) are calculated in the same one system event with necessary buffers and loop only, so it is the FAST, OPTIMIZED and EFFICIENT HA having the combined indicator of MetaTrader 4. You can choose to display HA and HAS in the sam
Wave Wolf MT4
Andrei Salanevich
O indicador Forex Wave Wold MT4 é projetado para procurar as ondas de Wolfe e exibi-las na janela atual do terminal de negociação. Um excelente indicador para os traders que usam as ondas de Wolf. Sua aplicação em estratégias de negociação aumentará significativamente sua eficiência e lucratividade. INFORMAÇÃO DO INDICADOR Ao contrário de outros indicadores de ondas de Wolfe, o indicador forex Wave Wold MT4 tem uma série de características que aumentam significativamente a sua eficiência: O p
Delta Fusion Pro
Francesco Secchi
5 (2)
Delta Fusion Pro – Análise Avançada de Order Flow para Trading Intradiário Delta Fusion Pro é um indicador profissional para MetaTrader 4 que revela o fluxo de ordens agressivas, mostrando a intensidade e a direção da pressão institucional em tempo real. Diferente dos indicadores volumétricos tradicionais, ele analisa a delta entre volumes Ask e Bid para antecipar reversões, confirmar tendências e identificar zonas de interesse profissional. Características Principais Sistema Inteligente de Au
What are Heiken Ashi Candles? Heiken Ashi, derived from the Japanese term 'Heikin Ashi,' translates to average price bars. It's an indicator depicting price bars on a chart. Formula for Heiken Ashi candles: - Heiken Ashi opening price: (previous candle's opening + closing price) / 2 - Closing price Heiken Ashi: (opening + high + low + closing) / 4 - Heiken Ashi peak: Max of high, opening, or closing price - Heiken Ashi bottom price: Min of low, opening, or closing price How to Read Heiken A
Os compradores deste produto também adquirem
Pulse Scalping Line - an indicator for identifying potential pivot points. Based on this indicator, you can build an effective Martingale system. According to our statistics, the indicator gives a maximum of 4 erroneous pivot points in a series. On average, these are 2 pivot points. That is, the indicator shows a reversal, it is erroneous. This means that the second signal of the indicator will be highly accurate. Based on this information, you can build a trading system based on the Martingale
Actualmente 20% OFF ! A melhor solução para qualquer novato ou comerciante especializado! Este software de painel de instrumentos está a funcionar em 28 pares de moedas. É baseado em 2 dos nossos principais indicadores (Advanced Currency Strength 28 e Advanced Currency Impulse). Dá uma grande visão geral de todo o mercado Forex. Mostra valores avançados de força da moeda, velocidade de movimento da moeda e sinais para 28 pares de divisas em todos os (9) períodos de tempo. Imagine como a sua n
Scalper Inside PRO
Alexey Minkov
4.74 (69)
An exclusive indicator that utilizes an innovative algorithm to swiftly and accurately determine the market trend. The indicator automatically calculates opening, closing, and profit levels, providing detailed trading statistics. With these features, you can choose the most appropriate trading instrument for the current market conditions. Additionally, you can easily integrate your own arrow indicators into Scalper Inside Pro to quickly evaluate their statistics and profitability. Scalper Inside
Volatility Trend System - um sistema de negociação que dá sinais para entradas. O sistema de volatilidade fornece sinais lineares e pontuais na direção da tendência, bem como sinais para sair dela, sem redesenho e atrasos. O indicador de tendência monitora a direção da tendência de médio prazo, mostra a direção e sua mudança. O indicador de sinal é baseado em mudanças na volatilidade e mostra entradas no mercado. O indicador está equipado com vários tipos de alertas. Pode ser aplicado a vários i
GOLD Impulse with Alert
Bernhard Schweigert
4.64 (11)
Este indicador é uma super combinação dos nossos 2 produtos Advanced Currency IMPULSE with ALERT  +   Currency Strength Exotics . Funciona para todos os períodos de tempo e mostra graficamente impulso de força ou fraqueza para as 8 principais moedas mais um Símbolo! Este Indicador é especializado para mostrar a aceleração da força da moeda para quaisquer símbolos como Ouro, Pares Exóticos, Commodities, Índices ou Futuros. É o primeiro do seu género, qualquer símbolo pode ser adicionado à 9ª
Trend Screener
STE S.S.COMPANY
4.79 (95)
Indicador de tendência, solução única inovadora para negociação e filtragem de tendências com todos os recursos de tendências importantes construídos dentro de uma ferramenta! É um indicador multi-timeframe e multi-moedas 100% sem repintura que pode ser usado em todos os símbolos/instrumentos: forex, commodities, criptomoedas, índices e ações. OFERTA POR TEMPO LIMITADO: O indicador Support and Resistance Screener está disponível por apenas US$ 50e vitalício. (Preço original US$ 250) (oferta este
Indicador Miraculous – Ferramenta 100% Não Repintável para Forex e Opções Binárias Baseada no Quadrado de Nove de Gann Este vídeo apresenta o Indicador Miraculous , uma ferramenta de negociação altamente precisa e poderosa, desenvolvida especificamente para traders de Forex e Opções Binárias . O que torna este indicador único é a sua base no lendário Quadrado de Nove de Gann e na Lei da Vibração de Gann , tornando-o uma das ferramentas de previsão mais precisas disponíveis na negociação moderna.
Currency Strength Exotics
Bernhard Schweigert
4.88 (33)
ACTUALMENTE 20% DE DESCONTO ! A melhor solução para qualquer novato ou comerciante especializado! Este Indicador é especializado para mostrar a força da moeda para quaisquer símbolos como Pares Exóticos de Commodities, Índices ou Futuros. É o primeiro do seu género, qualquer símbolo pode ser adicionado à 9ª linha para mostrar a verdadeira força da moeda de Ouro, Prata, Petróleo, DAX, US30, MXN, TRY, CNH etc. Esta é uma ferramenta de negociação única, de alta qualidade e acessível, porque inco
Indicador antecipado       Determina os níveis e zonas de reversão do mercado   , permitindo que você espere o preço retornar ao nível e entre no início de uma nova tendência, e não no seu fim. Ele mostra       níveis de reversão       onde o mercado confirma uma mudança de direção e inicia um movimento adicional. O indicador funciona sem redesenhar, é otimizado para qualquer instrumento e revela seu potencial máximo quando combinado com o       LINHAS DE TENDÊNCIA PRO       indicador. Scanner
Presenting one-of-a-kind Gann Indicator for XAUUSD IQ Gold Gann Levels is a non-repainting, precision tool designed exclusively for XAUUSD/Gold intraday trading. It uses W.D. Gann’s square root method to plot real-time support and resistance levels, helping traders spot high-probability entries with confidence and clarity. William Delbert Gann (W.D. Gann) was an exceptional market analyst whose trading technique was based on a complex blend of mathematics, geometry, astrology, and ancient calcul
Product Name:   Quantum Regime Indicator Short Description:   A multi-engine structural regime and volatility filter. Description: Quantum Regime Indicator (QRI) is a sophisticated technical analysis algorithm designed to identify market structure shifts and volatility regimes. Unlike standard indicators that rely on immediate price action, QRI utilizes a hierarchical logic architecture to filter market noise and identify statistical extremes. The indicator is built on the philosophy of "Market
Apresentamos o Indicador de Avião F-16, uma ferramenta de ponta para o MT4 projetada para revolucionar sua experiência de negociação. Inspirado na velocidade e precisão incomparáveis do caça F-16, este indicador combina algoritmos avançados e tecnologia de última geração para oferecer um desempenho sem igual nos mercados financeiros. Com o Indicador de Avião F-16, você vai decolar acima da concorrência, pois ele fornece análises em tempo real e gera sinais de negociação altamente precisos. Suas
Dynamic Forex28 Navigator
Bernhard Schweigert
4.43 (7)
Dynamic Forex28 Navigator - A ferramenta de negociação Forex de última geração. ATUALMENTE 49% DE DESCONTO. Dynamic Forex28 Navigator é a evolução dos nossos indicadores populares de longa data, combinando o poder de três em um: Indicador Advanced Currency Strength28 (695 avaliações) + Advanced Currency IMPULSE com ALERTA (520 avaliações) + Sinais CS28 Combo (Bônus). Detalhes sobre o indicador https://www.mql5.com/en/blogs/post/758844 O que o Next-Generation Strength Indicator oferece?  Tudo
Trend Lines PRO
Roman Podpora
5 (1)
LINHAS DE TENDÊNCIA PRO       Ajuda a entender onde o mercado está realmente mudando de direção. O indicador mostra inversões de tendência reais e pontos onde os principais participantes retornam ao mercado. Você vê     Linhas BOS     Análise de tendências e níveis-chave em prazos maiores — sem configurações complexas ou ruídos desnecessários. Os sinais não são repintados e permanecem no gráfico após o fechamento da barra. O que o indicador mostra: Mudanças reais  tendência (linhas BOS) Uma vez
KATANA Scalper for MT4 Product Overview Click here for the simple version: https://www.mql5.com/en/market/product/161751 KATANA Scalper for MT4 is an advanced technical analysis indicator optimized for the MetaTrader 4 platform. It is designed to solve the two biggest challenges in short-term trading (scalping and day trading): "price noise" and "reaction lag." Using a unique signal processing algorithm, it eliminates superficial market fluctuations and extracts the "core momentum" with high
Adaptive Volatility Range [AVR] is a powerful tool for identifying key trend reversal points. AVR accurately reflects the Average True Range (ATR) of volatility, taking into account the Volume-Weighted Average Price (VWAP). The indicator adapts to any market volatility by calculating the average volatility over a specific period, ensuring a stable rate of profitable trades. You receive not just an indicator but a professional automated trading system , AVR-EA . Advantages: Automated Trading Sys
ZeusArrow Smart Liquidity Finder  Smart Liquidity Finder is Ai controlled indicator based on the Idea of Your SL is My Entry. It scan and draws the major Liquidity areas on chart partitioning them with Premium and Discount Zone and allows you find the best possible trading setups and help you decide the perfect entry price to avoid getting your Stop Loss hunted . Now no more confusion about when to enter and where to enter. Benefit from this one of it's kind trading tool powered by Ai an trade
Algo Pumping MT4
Ihor Otkydach
4.69 (16)
PUMPING STATION – Sua estratégia pessoal “tudo incluído” Apresentamos o PUMPING STATION — um indicador revolucionário para Forex que vai transformar sua maneira de operar em uma experiência empolgante e eficaz. Este não é apenas um assistente, mas sim um sistema de trading completo com algoritmos poderosos que vão te ajudar a operar de forma mais estável. Ao adquirir este produto, você recebe GRATUITAMENTE: Arquivos de configuração exclusivos: para uma configuração automática e desempenho máximo
Meravith
Ivan Stefanov
5 (1)
O indicador analisa o volume de cada ponto e calcula os níveis de exaustão do mercado para esse volume. Ele consiste em três linhas: Linha de exaustão do volume altista Linha de exaustão do volume baixista Linha que indica a tendência do mercado. Esta linha muda de cor para refletir se o mercado é altista ou baixista. Você pode analisar o mercado a partir de qualquer ponto inicial que escolher. Uma vez que uma linha de exaustão de volume seja atingida, identifique um novo ponto de início para o
The Super Arrow Indicator provides non-repainting buy and sell signals with exceptional accuracy. Key Features No repainting – confirmed signals remain fixed Clear visual arrows: green for buy, red for sell Real-time alerts via pop-up, sound, and optional email Clean chart view with no unnecessary clutter Works on all markets: Forex, gold, oil, indices, crypto Adjustable Parameters TimeFrame Default: "current time frame" Function: Sets the time frame for indicator calculation Options: Can be set
Este indicador é um indicador para análise automática de ondas que é perfeito para negociações práticas! Caso... Nota:   Não estou acostumado a usar nomes ocidentais para classificação de ondas. Devido à influência da convenção de nomenclatura de Tang Lun (Tang Zhong Shuo Zen), nomeei a onda básica como   uma caneta   e a banda de onda secundária como   um segmento   . ao mesmo tempo, o segmento tem a direção da tendência.   O segmento de tendência principal   é nomeado (esse método de nomencl
ONI FUSION PRO Institutional Flow Matrix for MT4 (Institutional Grade Correlation Dashboard / Full MTF Support) A "Cheat Sheet" for the Markets on your MT4. The Next-Generation Cockpit System that completely visualizes Institutional Capital Flow. Why You Cannot Win Without "Correlation" Currency pairs never move in isolation. If the "Dollar" strengthens, the Euro, Pound, and Yen are all affected and move in unison. Ignoring this "invisible chain (correlation)" is like driving a car on the hi
Supply and Demand Dashboard PRO
Bernhard Schweigert
4.8 (20)
Actualmente 20% OFF ! Este painel é uma peça de software muito poderosa que trabalha em múltiplos símbolos e até 9 prazos. Baseia-se no nosso principal indicador (Melhores críticas: Advanced Supply Demand ).   O tablier dá uma óptima visão geral. Mostra:   Valores filtrados da Oferta e da Procura, incluindo a classificação da força da zona, Distâncias de/para as zonas e dentro das zonas, Destaca as zonas aninhadas, Dá 4 tipos de alertas para os símbolos escolhidos em todos os (9) períodos de
PZ Day Trading
PZ TRADING SLU
3.67 (3)
Este indicador detecta reversões de preços em zigue-zague, usando apenas análise de ação de preços e um canal donchiano. Ele foi projetado especificamente para negociações de curto prazo, sem repintar ou retroceder. É uma ferramenta fantástica para traders astutos, com o objetivo de aumentar o tempo de suas operações. [ Guia de instalação | Guia de atualização | Solução de problemas | FAQ | Todos os produtos ] Surpreendentemente fácil de negociar Fornece valor em cada período de tempo Impleme
Hidden Cycles
Lev Vladimirovic Marushkin
5 (1)
The Only 100% Universal Tool! Stop trading against nature! This is your chance to secure the only indicator rooted in the absolute laws that govern the entire universe. Most tools guess—this one reveals the truth. Buy another toy or buy the truth. Your choice... Based on Universal Laws — NOT Some Guy’s Algorithm: Let the market adjust to the Hidden Cycles Geometry — not the other way around. Most indicators are based on a man-made formula. They often lag, fail over time, or need constant re-o
Entry Points Pro
Yury Orlov
4.6 (173)
Este é um indicador para MT4 que fornece sinais precisos para entrar em uma negociação sem redesenhar. Ele pode ser aplicado a qualquer ativo financeiro: forex, criptomoedas, metais, ações, índices. Ele fornecerá estimativas bastante precisas e informará quando é melhor abrir e fechar um negócio. Assista o vídeo (6:22) com um exemplo de processamento de apenas um sinal que compensou o indicador! A maioria dos traders melhora seus resultados de negociação durante a primeira semana de negociação c
Auto Trendline Fibo Dow Theory - Automated Price Action & Structure Analysis Overview: Stop drawing manual trendlines and Fibonacci retracements! Auto Trendline Fibo Dow Theory  is a powerful price action utility designed to automate your technical analysis based on the classic Dow Theory and Fibonacci ratios. This indicator scans market structure using a customizable ZigZag algorithm to identify higher highs, higher lows (Uptrend), or lower highs, lower lows (Downtrend). It automatically plots
Cycle Sniper
Elmira Memish
4.39 (36)
Please contact us after your purchase and we will send you the complimentary indicators to complete the system Cycle Sniper is not a holy grail but when you use it in a system which is explained in the videos, you will feel the difference. If you are not willing to focus on the charts designed with Cycle Sniper and other free tools we provide, we recommend not buying this indicator. We recommend watching the videos about the indiactor and system before purchasing. Videos, settings  and descri
O indicador " Dynamic Scalper System " foi desenvolvido para o método de scalping, operando dentro de ondas de tendência. Testado nos principais pares de moedas e ouro, é possível a compatibilidade com outros instrumentos de negociação. Fornece sinais para a abertura de posições de curto prazo ao longo da tendência, com suporte adicional para o movimento dos preços. O princípio do indicador: As setas grandes determinam a direção da tendência. Um algoritmo para gerar sinais de scalping sob a fo
Friends, we present to your attention our new Forex Gump Laser indicator. Since there are no designers in our team, but mainly mathematicians, financiers, programmers and traders, we did not make any special changes in the indicator design. In appearance, it resembles the usual Forex Gump. On the other hand, Forex Gump has become not just the name of an indicator, it is a brand. And we try to preserve the corporate identity in all its varieties. The whole essence of the indicator in its operatio
Mais do autor
This indicator Super Channel Pro Pluss indicator.Indicator displays trend movement. Indicator calculates automatically line. Features FiltPer - displays indicator channel period. deviation - displays indicator channel deviation. deviation2 - displays indicator channel deviation. deviation3 - displays indicator channel deviation. How to understand the status: If the arrow is up and line color Teal ;trend is up. If the arrow is down and line color Red; trend is down. If the arrow is Yellow close
This indicator displays the ZigZag Pointer Fibonacci Expansion Triangle movements timeframes only M1-W1. Parameters InDepth: Displays the Depth movements. InDeviation: Displays the Deviation movements. InBackstep: Displays the Backstep movements. Fibonacci Expansion: Displays the Fibonacci Expansion movements. Fibonacci Expansion true.(false) Triangle: Displays the Triangle movements. Triangle true.(false) How to understand the status: If the Triangle is green, trend is up. If the Triangle is r
This indicator displays the trend movements. Parameters Trend: Displays the trend movements, true/false. X: moves the trend left and right. Y: moves the trend up and down. How to understand the status: (M1), square indicates the timeframe for 1 minute. If the square is green, trend is up. If the square is red, trend is down. (M5), square indicates the timeframe for 5 minute. If the square is green, trend is up. If the square is red, trend is down. (M15), square indicates the timeframe for 15 mi
This indicator helps to define the dominant trend. The Blue line and Red line changes at incrementations of the trends. Parameters ki: factor of the delay. per: Displays the indicator period. Trend: Displays the Trend movements. Trend true.(false) X: moves the trend left and right. Y: moves the trend up and down. How to understand the status: If the arrow is blue, trend is up. If the arrow is red, trend is down.
This indicator displays the trend movements. Parameters XRMultiplier: XR multiplier. Line: line movement (true/false). XRzak: XRzak movements (true/false). Arrow1: arrow movements (true/false). Arrow2: arrow movements up and down (true/false). Trend: trend movements (true/false). X: move the trend left and right. Y: move the trend up and down. How to understand the status: If the arrow is green, trend is up. If the arrow is red, trend is down.
This indicator displays the trend movements. Parameters XRMultiplier1: XR multiplier 1. XRMultiplier2: XR multiplier 2. Line1: line 1 movement (true/false). Line2: line 2 movement (true/false). XRTrend: XR trend displays Line 1 and Line 2 movements (true/false). X: move the trend left and right. Y: move the trend up and down. How to understand the status: If the Line is green, trend is up. If the Line is red, trend is down.
This indicator zone indicator.Indicator displays high and low zone. Features Green color - Shows movement on the high zone. Red colr - Shows movement on the low zone. Yellow colr - Shows movement on the zero zone.    How to understand the status: If the bar is higher than the yellow color line , trend is up. If the bar is lower than the yellow color line , trend is down.
Super
Mati Maello
This indicator super indicator.Indicator displays trend movement. Indicator calculates automatically bars Features FiltPer - displays indicator period. Multiplier - displays indicator multiplier. How to understand the status: If the indicator bar is higher , trend is up. If the indicator bar is lower , trend is down. IIIIIIIIIIIIIIIIIIIIIIIIIIIIIIIIIIIIIIIIIIIIIIIIIIIIIIIIIIIIIIIIIIIIII
This indicator displays super power trend movement. Features Multiplier - displays multiplier movement. Multiplier2 - displays multiplier2 movement. Trend - displays indicator trend 1 and trend 2 (true/false). separate_windor - displays trend separate window.(0-1....) X - move the trend left and right. Y - move the trend up and down. How to understand the status: If the Trend color is green, trend is up. If the Trend color is red, trend is down.
This indicator displays Super Power  Beeta trend movement.Indicator is version 2 . Features Multiplier - displays multiplier movement. Multiplier2 - displays multiplier2 movement. Trend - displays indicator trend 1 and trend 2 (true/false). Background:color - displays background color (true/false). separate_window - displays trend separate window.(0-1....) separate_window2 - displays trend (background color )separate window.(1-2....) X - move the trend left and right. Y - move the trend up an
XR Power Trend
Mati Maello
1 (1)
This indicator displays XR Power Trend movement.Indicator displays Moving Average period 5,Moving Average period 26,Moving Average period 52,Commodity Channel Index,MACD,Average Directional Movement Index,Bulls Power,Bears Power,Stochastic Oscillator,Relative Strength Index,Force Index,Momentum,DeMarker,average movement.Indicators period is standard period.    Features X - move the trend left and right. Y - move the trend up and down. How to understand the status: If the Trend color is green, t
This indicator Master XR indicator.Indicator displays trend movement. Indicator calculates automatically line. Features FiltPer - displays indicator period. deviation - displays indicator deviation. deviation2 - displays indicator deviation. How to understand the status: If (Timeframe M1-H1) FiltPer = 100; If ( Timeframe H4-MN) FiltPer = 5-20; ////////////////////////////////////////////////////////////////////////////////////////////////////////////////////////////////////////////////////// //
This indicator Super MA Pluss indicator.Indicator displays trend movement. Indicator calculates automatically line. Features FiltPer - displays indicator period. How to understand the status: If the arrow is green, trend is up. If the arrow is red, trend is down. /////////////////////////////////////////////////////////////////////////////////////////////////////////////////////////////////////////////////// ///////////////////////////////////////////////////////////////////////////////////////
This indicator Super Channel Arrow and zak indicator.Indicator displays trend movement. Indicator calculates automatically line. Features FiltPer - displays indicator channel period. FiltPer2 - displays indicator period. deviation - displays indicator channel deviation. How to understand the status: If the arrow is green, trend is up. If the arrow is red, trend is down. best FiltPer ,period timeframe M1-H1 (100);H4-MN (50) best FiltPer2, period timeframe M1-H1 (50);H4-MN (25) //////////////////
This indicator Super Channel Pro indicator.Indicator displays trend movement. Indicator calculates automatically line. Features FiltPer - displays indicator channel period. deviation - displays indicator channel deviation. deviation2 - displays indicator channel deviation. How to understand the status: If the arrow is green, trend is up. If the arrow is red, trend is down. ///////////////////////////////////////////////////////////////////////////////////////////////////////////////////////////
This indicator Super XT indicator.Indicator displays trend movement. Indicator calculates automatically line. Features FiltPer - displays indicator period. Window - displays indicator trend (true/false). Trend - displays indicator trend (true/false). X - move the trend left and right. Y - move the trend up and down.     How to understand the status: If the Trend color is green, trend is up. If the Trend color is red, trend is down. ////////////////////////////////////////////////////////
This indicator Super Turbo indicator.Indicator displays trend movement. Indicator calculates automatically line. Features FiltPer - displays indicator period. Step - displays indicator Step. Trend - displays indicator trend (true/false). X - move the trend left and right. Y - move the trend up and down. How to understand the status: If the Trend color is green, trend is up. If the Trend color is red, trend is down. ///////////////////////////////////////////////////////////////////////////
Pluuto Alert
Mati Maello
1 (1)
This indicator Pluuto Alert indicator.Indicator displays trend movement. Indicator calculates automatically line.Alert = arrow.When the alert is up the next alert is down,when the alert is down the next alert is up (new bar). Features FiltPer - displays indicator period.Line1. FiltPer2 - displays indicator period.Line2. Multiplier - displays indicator multiplier.(FlitPer,Line1;step) Deviation1 - displays indicator deviation.(Line2) Deviation2 - displays indicator deviation.(Arrow) Trend - displa
This indicator Pluuto Alert Plus indicator.Indicator displays trend movement. Indicator calculates automatically line.Alert = FiltPer.When the alert is up the next alert is down,when the alert is down the next alert is up (new bar). Features FiltPer - displays indicator period.Line1. FiltPer2 - displays indicator period.Line2. Multiplier - displays indicator multiplier.(FlitPer,Line1;step) Deviation1 - displays indicator deviation.(Line2) Deviation2 - displays indicator deviation.(Line2) Deviati
This indicator XX Power indicator.Indicator displays trend movement. Indicator helps to buy and sell.In dicator displays arrow and line. Features FiltPer - displays indicator period. How to understand the status:   If the Trend color is green, trend is up. I f the Trend color is red, trend is down.    //////////////////////////////////////////////////////////////////////////////////////////////////////////////////////////////////////////////////// ////////////////////////////////////////////
This indicator Matrix X indicator.Indicator displays Stochastic oscillator,Williams Percent Range,DeMarker,Relative Strength Index,Matrix trend movement. Indicator helps to buy and sell.Matrix trend = (Stochastic+WPR+DeMarker+RSI)/4. Features KPeriod - displays Stochastic K period. DPeriod - displays Stochastic D period. Slowing- displays Stochastic Slowing. Stochastic_Method - displays Stochastic Method. Stochastic_price - displays Stochastic Price. WPR_per - displays WPR period. Dem_per - disp
This indicator Mega Super indicator.Indicator displays trend movement. Indicator helps to buy and sell.In dicator displays arrow and line. Features per - displays indicator period. How to understand the status: If the arrow color is green, trend is up. I f the arrow color is red, trend is down. //////////////////////////////////////////////////////////////////////////////////////////////////////////////////////////////////////////////////// ///////////////////////////////////////////////////
Matic
Mati Maello
This indicator Matic indicator.Indicator displays trend movement. Indicator helps to buy and sell. The indicator shows the movement of sak1 and sak2 Stddevchannel, Regression. Features HLper - displays indicator iHighest and iLowest period. ExtDepth - displays indicator ExtDepth. ExtDeviation - displays indicator ExtDeviation. ExtBackstep - displays indicator ExtBackstep. zak1_ST_RE - displays indicator zak1,Stddevchannel,Regression.(true,false) zak2_ST_RE - displays indicator zak2,Stddevchannel
This indicator Matic Pro indicator.Indicator displays trend movement. Indicator helps to buy and sell. The indicator shows the movement of sak1 and sak2 Stddevchannel, Regression + zak2 indicator. Features HLper - displays indicator iHighest and iLowest period. ExtDepth - displays indicator ExtDepth. ExtDeviation - displays indicator ExtDeviation. ExtBackstep - displays indicator ExtBackstep. p - line indicator bars back.(bars back= zak2) m - regression.(1-8),the best(2-3) i0 -line indicator bar
This indicator Super Neuro Trend indicator.Indicator displays trend movement. Indicator helps to buy and sell. Features FiltPer- displays indicator period. deviation - displaus indicator deviation. Trend - displaus indicator trend.( true,false) Rectangle - displaus indicator rectangle. (true,false)  How to understand the status: If the trend color is green, trend is up. I f the trend color is red, trend is down. I f the trend waiting,trend waiting.     ///////////////////////////////////////////
This indicator Mega Super Neuro Trend indicator.Indicator displays trend movement. Indicator helps to buy and sell.Trend1= line1 > < line1,trend2=line1 > < line2,trend3 = line1,line2  > < line3. Features Trend - displaus indicator trend.( true,false) How to understand the status: If the trend color is green, trend is up. I f the trend color is red, trend is down. ///////////////////////////////////////////////////////////////////////////////////////////////////////////////////////////////////
This indicator XRX Master indicator.Indicator displays trend movement. Indicator helps to buy and sell. Features FiltPer- displays indicator period. deviation - displaus indicator deviation. deviation2 - displaus indicator deviation 2. HL_period - displaus indicator Highest and Lowest period. HL_period2 - displaus indicator Highest 2 and Lowest 2 period. How to understand the status: If the trend color arrow is green, trend is up. I f the trend color arrow is red, trend is down. ///////////
This indicator XXX Master indicator.Indicator displays trend movement. Indicator helps to buy and sell. Features per- displays indicator period. Step- displays indicator step. line- true (false) How to understand the status: If the trend color arrow is green, trend is up. I f the trend color arrow is red, trend is down. //////////////////////////////////////////////////////////////////////////////////////////////////////////////////////////////////////////////////// /////////////////////////////
Filtro:
lorenzo_mella
824
lorenzo_mella 2024.08.30 13:43 
 

ho aquistato questo indicatore e premetto che sono nuovo nel trading ma mi ha risolto tanti problemi è il migliore che ho comprato voto 5 peccato però che non ha gli avvisi sul dispositivo mobile il resto è perfetto.

Responder ao comentário