Jaguar tac

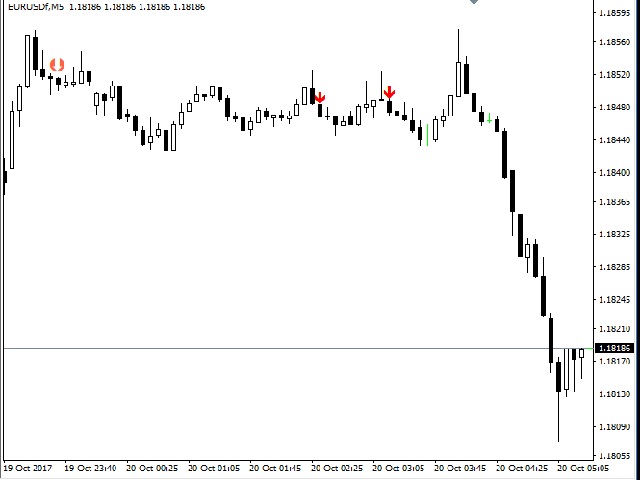
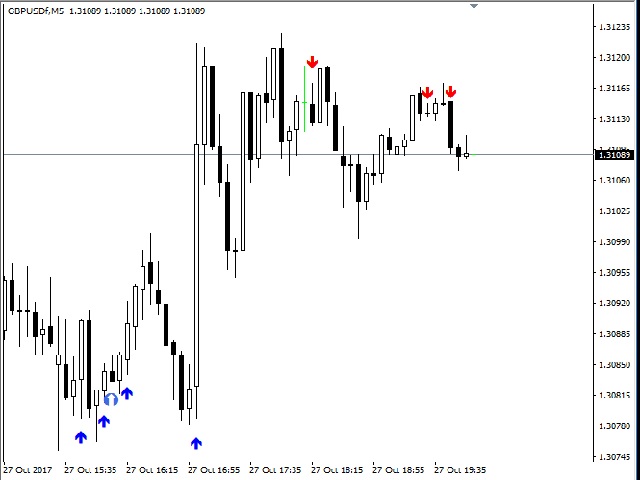
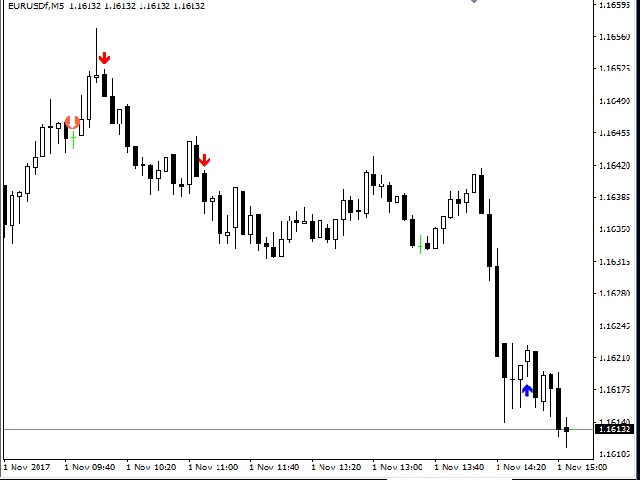
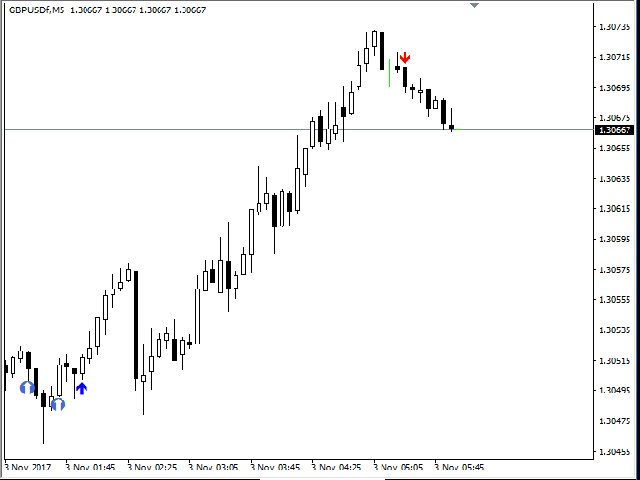
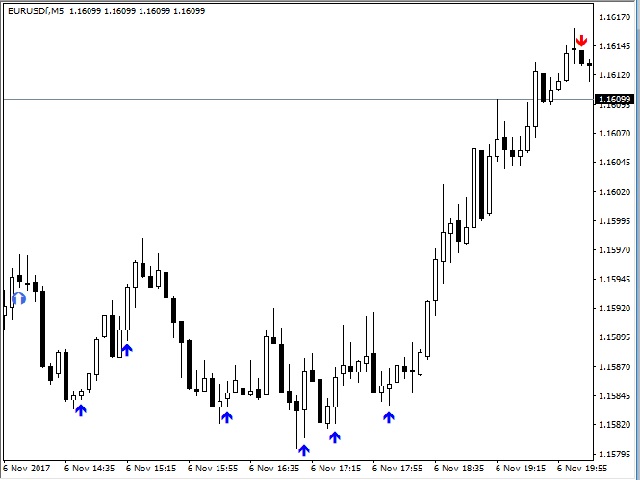
The indicator uses the Envelopes channel in its calculations, which allows working with dynamic support and resistance levels.

It also considers the direction and strength of the trend, as well as the mathematical calculation that determines the percent range of the price channel, which is generally formed at the time of the accumulation of positions. It first generates a preliminary signal in the form of a round arrow. Then it is necessary to wait for a normal arrow and enter the market only after that.

Take profit is from 15 to 50 points. Stop loss is placed beyond the local High and Low levels.


Parameters

  • Bars - number of bars on the history.
  • Notices for a preliminary signal - select the alert for the preliminary signal: alert (pop-up window), email messages, push notifications.
  • Notices for the main signal - select the alert for the main signal: alert (pop-up window), email messages, push notifications.
  • Period Envelopes - period of the Envelopes indicator.
  • Shift Envelopes - shift of the Envelopes indicator.
  • Envelopes method - calculation method of the Envelopes indicator.
  • Envelopes Apply to - applied price of the Envelopes indicator.
  • Deviation Envelopes - percentage for the Envelopes indicator.
Produtos recomendados
Alpha Trend sign has been a very popular trading tool in our company for a long time. It can verify our trading system and clearly indicate trading signals, and the signals will not drift. Main functions: Based on the market display of active areas, indicators can be used to intuitively determine whether the current market trend belongs to a trend market or a volatile market. And enter the market according to the indicator arrows, with green arrows indicating buy and red arrows indicating se
CycleIdentifier
Amyr Shryf Mhmd Salh
The Cycle Identifier MT4 indicator is a great choice of custom indicator for both short-term and long-term traders. The Cycle Identifier MT4 generates filtered price action signals to assist traders to identify when the conditions are right to open buy and sell positions. How it works The Cycle Identifier MT4 indicator displays on a separate indicator chart below the main chart where it draws an oscillating gray line. This gray line is characterized by upward and downward spikes that are accompa
In the world of trading, one of the main concerns is finding a reliable trading system. Meet the TrendEdge Channel indicator - your reliable companion in this search. Developed based on complex mathematical calculations, this indicator predicts the most likely short-term price movements. TrendEdge Channel is designed specifically to identify trends in price movements. Thanks to it, you can quickly determine not only the direction of the trend, but also the levels of interaction between buyers
O VALUE EDITION LIMITED é um indicador técnico avançado, desenvolvido para traders que buscam clareza, precisão e rapidez na leitura do mercado. Compatível com MetaTrader 4 , ele integra zonas inteligentes de sobrecompra/sobrevenda, canais dinâmicos de preço, análise de velas normalizadas e alertas em tempo real, proporcionando suporte confiável para operações em qualquer ativo ou período gráfico. Principais Características Zonas Inteligentes de Negociação: Identificação automática de regiões d
Arriator
Nadiya Mirosh
The Arriator forex indicator algorithm allows you to quickly determine the current trend in the market. The Elephant indicator accompanies long-term trends and can be used without restrictions on instruments or timeframes. This indicator not only helps predict future values, but also generates buy and sell signals. It tracks market trends, ignoring wild swings and market noise around the average price. The indicator implements a type of technical analysis based on the idea of ​​market cyclicalit
Indicador Crypto_Forex "Padrão Homem Enforcado e Martelo Invertido" para MT4. - O indicador "Padrão Homem Enforcado e Martelo Invertido" é um indicador muito poderoso para a negociação de Acção de Preço: sem repintura, sem atraso. - O indicador deteta padrões de alta Inverted_Hammer e baixa Hanging_Man no gráfico: - Martelo Invertido de Alta - Sinal de seta azul no gráfico (ver imagens). - Hanging_Man de baixa - Sinal de seta vermelha no gráfico (ver imagens). - Com alertas para PC, telemóvel
Channels Pro
Alexander Nikolaev
5 (3)
The indicator determines and plots price channels or lines, reading information from multiple timeframes (from current, second and third) simultaneously. Color and width of lines for each timeframe can be customized. It is also possible to set different distance between the Highs and Lows for plotting channels or lines. Parameters History - maximum number of bars to plot channels or lines; Distance - minimum distance from one High (or Low) to another when plotting lines; Shift - shift for sever
This is a multi-timeframe candle patterns indicator. It scans the chart for Hammer , Engulfing candle , Doji candle and Three white soldiers / black crows setups. FEATURES: Main panel showing timeframe s from M5 - W1, last signal and last signal time of the selected candle pattern. You can switch between the timeframes by clicking on them. A panel with buttons to switch from one candle pattern to another on the main panel. Arrows to help you locate the candle pattern. A scale showing you what ca
Dark Absolute Trend
Marco Solito
4.59 (41)
Dark Absolute Trend   is an Indicator for intraday trading. This Indicator is based on Trend Following  strategy but use also candlestick patterns and Volatility. We can enter in good price with this Indicator, in order to follow the main trend on the current instrument. It is advised to use low spread ECN brokers.     Recommended Brokers This Indicator does Not repaint and N ot lag . Recommended timeframes are M5, M15 and H1. Recommended working pairs: All. I nstallation and  Update Guide   -
ADX MA: The Ultimate Trend Strength Guide In forex trading, the Average Directional Index (ADX) is a vital indicator for gauging trend strength. Here's a streamlined approach to using ADX for effective trading: 1. Add ADX to your forex chart. 2. Interpret ADX values: <20 is weak, >40 is strong. 3. Identify trend direction: +DI above -DI indicates an upward trend, and vice versa. 4. Execute trades based on ADX and trend: Strong up trend, consider buying; strong down trend, consider selling; we
Infinity Trend Pro
Yaroslav Varankin
1 (1)
This is a trend indicator without redrawing Developed instead of the binary options strategy (by the color of the Martingale candlestick) Also works well in forex trading When to open trades (binary options) A signal will appear in the place with a candle signaling the current candle It is recommended to open a deal for one candle of the current timeframe M1 and M5 When a blue dot appears, open a deal up When a red dot appears, open a trade down. How to open trades on Forex. When a signal is rec
About: Looks for price making a trend flip pattern. Importance of this pattern is that after it happens, price tends to range a bit and then breakout right after. Features: Looks for trend flip pattern Num of bars creating pattern Extend lines to right to wait for breakout Bull/Bear Strength for candles making the pattern Filter using Halftrend/NRTR How it Works: Use this technique for scalping. After a pattern happens, you will see a red/green rectangle. Red means a Bearish pattern and green
Trend PA
Mikhail Nazarenko
5 (3)
The Trend PA indicator uses   Price Action   and its own filtering algorithm to determine the trend. This approach helps to accurately determine entry points and the current trend on any timeframe. The indicator uses its own algorithm for analyzing price changes and Price Action. Which gives you the advantage of recognizing, without delay, a new nascent trend with fewer false positives. Trend filtering conditions can be selected in the settings individually for your trading style. The indicator
Overview Base Box Indicator automatically detects and draws institutional supply and demand base zones using the Rally-Base-Rally (RBR) and Drop-Base-Drop (DBD) price action methodology — one of the most reliable frameworks for identifying high-probability reversal and continuation areas. Unlike basic support/resistance tools, this indicator isolates the precise consolidation phase (the "Base") between two impulse moves and renders it as a structured 3-layer box that separates candle bodies from
PABT Pattern Indicator - it's classical system one of the signal patterns. Indicator logic - the Hi & Lo of the bar is fully within the range of the preceding bar, look to trade them as pullback in trend. In the way if indicator found PABT pattern it's drawing two lines and arrow what showing trend way.  - First line - it's entry point and drawing at: 1. On the high of signal bar or on middle of the signal bar (depending from indicator mode) for buy; 2. On the low of signal bar or on middle of t
Trend Ray
Andriy Sydoruk
The indicator shows the potential trend direction by cyclical-wave dependence. Thus, all the rays of the intersection will be optimal rays, in the direction of which the price is expected to move, taking into account the indicator period. Rays can be used as a direction for potential market movement. But we must not forget that the approach must be comprehensive, the indicator signals require additional information to enter the market.
PZ Support Resistance
PZ TRADING SLU
3.33 (3)
Cansado de traçar linhas de suporte e resistência? A Resistência de suporte é um indicador de período múltiplo que detecta e plota automaticamente linhas de suporte e resistência no gráfico com um toque muito interessante: conforme os níveis de preços são testados ao longo do tempo e sua importância aumenta, as linhas se tornam mais espessas e mais escuras. [ Guia de instalação | Guia de atualização | Solução de problemas | FAQ | Todos os produtos ] Melhore sua análise técnica da noite para o d
O indicador Crypto_Forex "Auto FIBO Pro" é uma ótima ferramenta auxiliar na negociação! - O indicador calcula e coloca automaticamente no gráfico os níveis de Fibonacci e as linhas de tendência locais (cor vermelha). - Os níveis de Fibonacci indicam áreas-chave onde o preço pode reverter. - Os níveis mais importantes são 23,6%, 38,2%, 50% e 61,8%. - Pode utilizá-lo para scalping de reversão ou para negociação de grelha de zona. - Existem muitas oportunidades para melhorar o seu sistema atual ut
MultiCurrency Indicators is a multi-currency indicator which calculates the values of multiple standard indicators for each of the 8 major currencies: EUR, GBP, AUD, NZD, USD, CAD, CHF, JPY. Advantages of the indicator Calculation is performed for 8 virtual charts of the currencies: EUR, GBP, AUD, NZD, USD, CAD, CHF, JPY; Show the currency strength, which does not depend on the currency pair; It allows determining the strongest and the weakest currencies at any moment, it also sorts currencies
Reversal Area Indicator
Shiffolika Kapila
5 (2)
Reversal Area Indicator (MT4) A precision‑engineered MT4 indicator designed to capture market tops, bottoms, and re‑entry points using intelligent Support/Resistance zone detection and high‑probability reversal logic. The Reversal Area Indicator identifies dynamic reversal zones where price is most likely to react, giving you early, accurate Buy/Sell entries with extremely small Stop Losses and exceptional Risk‑to‑Reward potential. Optimized for fast‑moving charts (M1/M5) yet powerful enough f
Dynamic Levels
Svyatoslav Kucher
Dynamic Levels is a channel indicator of dynamic levels, designed for identification of the price extremums. It allows increasing the efficiency of any strategy due to advanced parameters, which in turn allow customizing it for personal trading style. Dynamic Levels does not change its values, it is suitable for any timeframe and currency pair. Indicator Parameters ChannelPeriod - period for the indicator calculation. ChannelSmoot - smoothing of values. ATRPeriod - volatility calculation period
"Adjustable Fractals Pro" - é uma versão avançada do indicador fractal, uma ferramenta de negociação muito útil! - Como sabemos, o indicador Standard fractals mt4 não tem definições, o que é muito inconveniente para os traders. - O Adjustable Fractals Pro resolveu este problema - tem todas as definições necessárias: - Período ajustável do indicador (valores recomendados - acima de 7). - Distância ajustável entre máximas e mínimas de preço. - Design ajustável de setas fractais. - Possui Info Sp
Daily Candle Predictor é um indicador que prevê o preço de fechamento de uma vela. O indicador destina-se principalmente ao uso em gráficos D1. Este indicador é adequado tanto para negociação forex tradicional quanto para negociação de opções binárias. O indicador pode ser usado como um sistema de negociação autônomo ou pode atuar como um complemento ao seu sistema de negociação existente. Este indicador analisa a vela atual, calculando certos fatores de força dentro do próprio corpo da vela, be
Indicador Crypto_Forex "Padrão Estrela da Manhã e Estrela da Tarde" para MT4, sem repintura, sem atraso. - O indicador "Padrão Estrela da Manhã e Estrela da Tarde" é um indicador muito poderoso para negociação de Price Action. - O indicador detecta os padrões Estrela da Manhã e Estrela da Tarde no gráfico: - Padrão Estrela da Manhã de alta - Sinal de seta azul no gráfico (veja as imagens). - Padrão Estrela da Tarde de baixa - Sinal de seta vermelha no gráfico (veja as imagens). - Com alertas pa
Rainbow Price Visualizer v1.21 See where the market really breathes. Turns your MT4 chart into an ultra-precise heatmap that highlights price zones favored by big players. Why it matters 300 price levels at 0.2‑pip resolution — microscopic detail. 8 visual themes (Rainbow, Fire, Ocean…) for instant readibility. Smart opacity: low noise fades, real zones pop. Lightweight rendering with automatic cleanup. Fully customizable: saturation, opacity, resolution, history depth. Bands project into the f
GeoShowCond
Georgij Komarov
For professionals in candlestick and technical analysis! This is your tool! The innovative GeoShowCond indicator allows you to quickly test candlestick patterns that you describe yourself! You define formula‑based buy and sell conditions, for example: B1=close[i] > high[i+1] && low[i] > low[i+2] S1=close[i] < low[i+1] && high[i] < high[i+2] B2=close[i] > high[i+2] S2=close[i] < low[i+2] B3=close[i] > high[i+1] && low[i] < low[i+1] && low[i] < low[i+2] && low[i] < low[i+3] S3=close[i] < low[
MFI Pointer is an indicator based on Money Flow Index indicator that uses both price and volume to measure buying and selling pressure. Money Flow Index is also known as volume-weighted RSI . MFI Pointer simply draws arrows on chart window when value of Money Flow Index (from parameter MFI_Period) is below MFI_Level (green upward pointing arrow) or above 100-MFI_Level (red downward pointing arrow). Indicator works on all timeframes and all currency pairs, commodities, indices, stocks etc. MFI Po
The Master Pivot indicator is a very interesting generator of static levels based on historical percentage variation. The levels are completely customizable changing the input numbers. Period can also be modified to select the preferred Time Frame. The color is flexible so you can change color easily, we recommend a red color upper and lower green for a contrarian style, conversely instead for a style follower trend. This indicator used in a confluent way offers some really interesting ideas. I
Indicador com sistema de cálculo de taxa de vitória [Recursos do Indicador] Este indicador permite que os traders confirmem de forma intuitiva e clara a análise técnica regular por meio de sinais de sinal. Além disso, pode verificar se os parâmetros atuais são apropriados verificando a taxa de vitória e inclui um sistema automático de determinação da taxa de vitória que se abstém de gerar sinais quando a taxa de vitória é baixa. Isso reduz as entradas desnecessárias e permite a entrada apenas
Trend Code
Ning Liu
4 (1)
Trend Code (v2.0) Trend Code is a very simple and yet effective trend indicator to capture trend movement, detect the trend reversal, calculate entry price as well as proper stop loss. Trend Code indicator is made up of a series of block, while bull trend block in bull colour and bear block in bear trend colour. For bull trend block, the TrendOpen is the lower edge, TrendClose is the upper edge, for bear trend block, the other way round. Parameters: TrendOpenAdjustment   = 0.8, (range 0~1.0) Tr
Os compradores deste produto também adquirem
Neuro Poseidon MT4
Daria Rezueva
4.95 (38)
Neuro Poseidon is a new indicator by Daria Rezueva. It combines precise trading signals with adaptive TP/SL levels - creating best possible trades as a result! Message me and get  Neuro Poseidon Assistant  as a gift to automize your trading process! What makes it stand out? 1. Proven profitability on all assets and timeframes 2. Only confirmed BUY and SELL signals present on the chart 3. Adaptive TP & SL levels generated by the software for each trade 4. Easy to understand - suitable for all
Indicador Miraculous – Ferramenta 100% Não Repintável para Forex e Opções Binárias Baseada no Quadrado de Nove de Gann Este vídeo apresenta o Indicador Miraculous , uma ferramenta de negociação altamente precisa e poderosa, desenvolvida especificamente para traders de Forex e Opções Binárias . O que torna este indicador único é a sua base no lendário Quadrado de Nove de Gann e na Lei da Vibração de Gann , tornando-o uma das ferramentas de previsão mais precisas disponíveis na negociação moderna.
Trend Catcher ind
Ramil Minniakhmetov
5 (4)
INDICADOR TREND CATCHER O Indicador Trend Catcher analisa os movimentos de preços do mercado, utilizando uma combinação de indicadores de análise de tendências adaptativos, proprietários e personalizados pelo autor. Identifica a verdadeira direção do mercado, filtrando o ruído de curto prazo e focando a força do momentum subjacente, a expansão da volatilidade e o comportamento da estrutura de preços. Utiliza também uma combinação de indicadores personalizados de suavização e filtragem de tendê
Gann Made Easy
Oleg Rodin
4.84 (165)
Gann Made Easy é um sistema de negociação Forex profissional e fácil de usar, baseado nos melhores princípios de negociação usando a teoria do sr. W. D. Gann. O indicador fornece sinais precisos de COMPRA e VENDA, incluindo níveis de Stop Loss e Take Profit. Você pode negociar mesmo em movimento usando notificações PUSH. Entre em contato comigo após a compra para receber instruções de negociação e ótimos indicadores extras gratuitamente! Provavelmente você já ouviu muitas vezes sobre os métodos
Dynamic Forex28 Navigator
Bernhard Schweigert
4.43 (7)
Dynamic Forex28 Navigator - A ferramenta de negociação Forex de última geração. ATUALMENTE 49% DE DESCONTO. Dynamic Forex28 Navigator é a evolução dos nossos indicadores populares de longa data, combinando o poder de três em um: Indicador Advanced Currency Strength28 (695 avaliações) + Advanced Currency IMPULSE com ALERTA (520 avaliações) + Sinais CS28 Combo (Bônus). Detalhes sobre o indicador https://www.mql5.com/en/blogs/post/758844 O que o Next-Generation Strength Indicator oferece?  Tudo
M1 Sniper
Oleg Rodin
5 (24)
O M1 SNIPER é um sistema indicador de negociação fácil de usar. É um indicador de seta projetado para o período M1. O indicador pode ser usado como um sistema independente para scalping no período M1 e pode ser usado como parte do seu sistema de negociação existente. Embora este sistema de negociação tenha sido projetado especificamente para negociação no M1, ele também pode ser usado em outros períodos. Originalmente, desenvolvi este método para negociar XAUUSD e BTCUSD. Mas considero-o útil ta
Scalper Inside PRO
Alexey Minkov
4.68 (69)
Scalper Inside PRO Scalper Inside PRO is an intraday trend and scalping indicator that uses exclusive built-in algorithms to evaluate market direction and key target levels. The indicator automatically calculates entry and exit points and several profit target levels, and it shows detailed performance statistics, so you can see how different instruments and strategies behaved on historical data. This helps you select instruments that fit current market conditions. You can also connect your own a
Advanced Supply Demand
Bernhard Schweigert
4.91 (300)
Atualmente com 30% de desconto! A melhor solução para qualquer Trader Novato ou especialista! Este indicador é uma ferramenta de negociação exclusiva, de alta qualidade e acessível porque incorporamos uma série de recursos proprietários e uma nova fórmula. Com esta atualização, você poderá mostrar fusos horários duplos. Você não só será capaz de mostrar um TF mais alto, mas também mostrar ambos, o TF do gráfico, MAIS o TF mais alto: MOSTRANDO ZONAS ANINHADAS. Todos os traders de Oferta e Demanda
MetaBands M4
Vahidreza Heidar Gholami
3.5 (6)
MetaBands utiliza algoritmos poderosos e únicos para desenhar canais e detectar tendências, a fim de fornecer aos traders pontos potenciais para entrar e sair de negociações. É um indicador de canal mais um indicador de tendência poderoso. Inclui diferentes tipos de canais que podem ser mesclados para criar novos canais simplesmente usando os parâmetros de entrada. O MetaBands usa todos os tipos de alertas para notificar os usuários sobre eventos de mercado. Recursos Suporta a maioria dos algori
Genesis Matrix Pro is a professional multi-timeframe trend detection indicator designed to help traders identify high-quality market alignment with clarity and structure. It combines 12 different technical indicators into one visual alignment matrix, allowing traders to quickly see when market conditions are bullish, bearish, or neutral. A signal is generated only when the selected strategies are aligned, helping reduce noise and improve decision-making. PLEASE CONTACT ME AFTER PURCHASE TO GET
Este produto foi atualizado para o mercado de 2026 e otimizado para as versões mais recentes do MT5. AVISO DE ATUALIZAÇÃO DE PREÇO: Smart Trend Trading System está atualmente disponível por $99 . O preço aumentará para $199 após as próximas 30 compras . OFERTA ESPECIAL: Após comprar o Smart Trend Trading System, envie-me uma mensagem privada para receber o Smart Universal EA GRÁTIS e transformar seus sinais do Smart Trend em operações automatizadas. Smart Trend Trading System é um sistema de tr
O Indicador de Quadrados de Gann é uma poderosa ferramenta de análise de mercado baseada no artigo "Fórmula Matemática para Previsões de Mercado" escrito por W.D. Gann, que se baseia em conceitos matemáticos para análise. Ele incorpora elementos das técnicas de Gann relacionadas com os quadrados de 144, 90 e 52, bem como o quadrado de 9. Além disso, inclui o método do  sobre como combinar o quadrado de 9 com canais e padrões de estrela. Manual do Usuário e Modo de Uso: Antes de usar este indicad
Breakout Arrows Mt4
Michael Oko Oboh
5 (1)
Trend Breakout Arrows Indicator The Trend Breakout Arrows Indicator is a momentum-based signal tool designed to identify potential bullish and bearish breakout opportunities. It displays clear arrow signals directly on the price chart, helping traders quickly recognize possible trend changes and continuation setups. Up Arrow (Buy Signal) A magenta up arrow appears below a candle when bullish momentum begins to strengthen. This signal indicates that buying pressure may be overtaking selling press
Neo Wave PRO
Nikolay Raykov
5 (1)
Price & Time Market Structure Indicator A professional market structure tool that analyzes waves through both price and time — not price alone. Main Description NeoWave PRO is a professional market structure indicator for MetaTrader 4 designed for traders who want to move beyond traditional one-dimensional wave tools such as ZigZag, swing indicators, and basic high/low systems. Most wave indicators analyze only one thing: Price. But a real market wave is not only a price movement. A true wave de
Prop Firm Sniper MT4  is a professional market structure indicator that automatically identifies high-probability BUY and SELL opportunities using BOS and CHoCH analysis. Recommended Timeframes: For backtesting, use the indicator on   M5 or M15   for Gold (XAUUSD), and   M15 or H1   for more volatile Forex pairs such as   GBPUSD, USDJPY, EURGBP , and similar markets. CONTACT ME AFTER PURCHASE TO CLAIM YOUR FREE BONUSES! Prop Firm Sniper  is a professional market structure indicator designed t
BTMM State Engine Pro is a MetaTrader 4 indicator for traders who use the Beat The Market Maker approach: Asian session context, kill zone timing, level progression, peak formation detection, and a multi-pair scanner from a single chart. It combines cycle state logic with a built-in scanner dashboard so you do not need the same tool on many charts at once. What it does Draws the Asian session range; session times can follow broker server offset or be set in inputs. Tracks level progression (L
Enigma scalper fx
Yonny Pascal Ekwa Mezui
Enigma Scalper  Overview Enigma Scalper Pro is a multi-filter breakout indicator designed for traders who want clean entry signals with confirmation from several technical conditions instead of relying on a single trigger. The indicator combines: 3-Bar Breakout pattern detection Higher Timeframe confluence Bollinger Band extreme filtering RSI momentum analysis Optional EMA trend filtering ATR-based SL/TP projection Signals are generated only after candle close to ensure stable non-repainting beh
O sistema PRO Renko é um sistema de negociação altamente preciso especialmente concebido para a negociação de gráficos RENKO. Trata-se de um sistema universal que pode ser aplicado a vários instrumentos de negociação. O sistema neutraliza eficazmente o chamado ruído de mercado, dando-lhe acesso a sinais de inversão precisos. O indicador é muito fácil de usar e tem apenas um parâmetro responsável pela geração de sinal. Você pode facilmente adaptar a ferramenta a qualquer instrumento de negocia
O Pinpoint é um indicador de negociação altamente eficiente, sem redesenho e sem atrasos, projetado para sinais precisos de compra e venda no XAUUSD . O indicador é projetado para os comerciantes que querem soluções rápidas, precisas e visuais, em tempo real, em um mercado em rápida mudança. O indicador funciona como uma estratégia de negociação pronta. Ele analisa o comportamento do preço do ativo de acordo com um algoritmo embutido e determina os pontos de entrada ideais, Além de mostrar onde
The indicator scans for Dinapoli thrust pattern in multiple timeframes for the all markets filtered and shows the results on Dashboard. Key Features Dashboard can be used for all markets It can scan for thrust pattern on MN1, W1, D1, H4, H1, M30, M15 ,M5, M1 timeframes Ability to choose number of bars required above/below displaced moving average to define thrust Parameters UseMarketWatch: Set true to copy all symbols available in market watch MarketWatchCount : Set the number of symbols that
ACTUALMENTE COM 40% DE DESCONTO A melhor solução para qualquer novato ou comerciante especializado! Este Indicador é uma ferramenta comercial única, de alta qualidade e acessível, porque incorporámos uma série de características proprietárias e uma nova fórmula. Com apenas UM gráfico, pode ler a força da moeda para 28 pares de Forex! Imagine como a sua negociação irá melhorar porque é capaz de apontar o ponto exacto do gatilho de uma nova tendência ou oportunidade de escalada? Manual do util
Reversion King MT4
Eugen-alexandru Zibileanu
Um Novo Rei Chegou ao Mercado – Indicador + Gestão de Ordens (TP1 + TP2 + TP3) (SISTEMA DE TRADING COMPLETO) Este indicador inclui uma estratégia avançada, um sistema de trading completo com gestão de ordens totalmente personalizável e um sistema de reversão à média (Mean Reversion) que combina extensões de Envelopes com múltiplos filtros inteligentes de confirmação, como o RSI, para identificar entradas de reversão de alta probabilidade através de sinais de COMPRA (BUY) e VENDA (SELL). O indica
Este indicador é um indicador para análise automática de ondas que é perfeito para negociações práticas! Caso... Nota:   Não estou acostumado a usar nomes ocidentais para classificação de ondas. Devido à influência da convenção de nomenclatura de Tang Lun (Tang Zhong Shuo Zen), nomeei a onda básica como   uma caneta   e a banda de onda secundária como   um segmento   . ao mesmo tempo, o segmento tem a direção da tendência.   O segmento de tendência principal   é nomeado (esse método de nomencl
Introduction Harmonic Patterns are best used to predict potential turning point. Traditionally, Harmonic Pattern was identified manually connecting peaks and troughs points in the chart. Manual harmonic pattern detection is painfully tedious and not suitable for everyone. You are often exposed under subjective pattern identification with manual pattern detection. To avoid these limitations, Harmonic Pattern Plus was designed to automate your harmonic pattern detection process. The functionality
KT Alpha Hunter Arrows MT4
KEENBASE SOFTWARE SOLUTIONS
A maioria dos indicadores de setas entrega um sinal e deixa você descobrir todo o resto sozinho. O KT Alpha Hunter Arrows entrega um plano de trading completo. Cada seta de sinal aparece com um plano completo já desenhado no gráfico: linha de entrada, stop loss, quatro níveis de take profit e um veredito de edge em tempo real, mostrando se aquele ativo e timeframe valem a pena ser operados naquele momento. O pacote inclui o Trade Manager EA, que cuida da execução depois que você entra na operaçã
Break Axis Signal
Leandro Bernardez Camero
BreakAxis — Sinais de Precisão no Ponto de Virada Junte-se ao canal para não perder nenhuma novidade: https://www.mql5.com/en/channels/forexnewadvisor Lógica de Sinal Baseada no Cruzamento do Eixo O BreakAxis Signal foi desenvolvido para detectar mudanças de direção com base em cruzamentos do eixo zero. As transições do histograma são usadas para destacar possíveis mudanças de momentum no mercado, com confirmação visual através de setas direcionais. Confirmação e Estabilidade do Sinal Cada
PZ ABCD Retracement
PZ TRADING SLU
4 (5)
Este indicador encontra os padrões de retração AB = CD. O padrão AB = CD Retracement é uma estrutura de preço de 4 pontos em que o segmento de preço inicial é parcialmente retraído e seguido por um movimento equidistante da conclusão da retirada, e é a base básica para todos os padrões harmônicos. [ Guia de instalação | Guia de atualização | Solução de problemas | FAQ | Todos os produtos ] Tamanhos de padrão personalizáveis Proporções AC e BD personalizáveis Períodos de interrupção personali
Trend Lines PRO
Roman Podpora
5 (1)
LINHAS DE TENDÊNCIA PRO       Ajuda a entender onde o mercado está realmente mudando de direção. O indicador mostra inversões de tendência reais e pontos onde os principais participantes retornam ao mercado. Você vê     Linhas BOS     Análise de tendências e níveis-chave em prazos maiores — sem configurações complexas ou ruídos desnecessários. Os sinais não são repintados e permanecem no gráfico após o fechamento da barra. VERSÃO MT 5      -      Revela seu potencial máximo quando emparelhada co
Legacy of Gann
Pavel Zamoshnikov
4.83 (12)
The indicator very accurately determines the levels of the possible end of the trend and profit fixing. The method of determining levels is based on the ideas of W.D.Gann, using an algorithm developed by his follower Kirill Borovsky. Extremely high reliability of reaching levels (according to K. Borovsky  - 80-90%) Indispensable for any trading strategy – every trader needs to determine the exit point from the market! Precisely determines targets on any timeframes and any instruments (forex, met
RFI levels PRO
Roman Podpora
5 (1)
O indicador mostra com precisão os pontos de reversão e as zonas de retorno de preço onde o   Principais players . Você identifica onde novas tendências estão se formando e toma decisões com máxima precisão, mantendo o controle sobre cada negociação. VERSION MT5     -     Revela seu potencial máximo quando combinado com o indicador   TREND LINES PRO. O que o indicador mostra: Estruturas de reversão e níveis de reversão com ativação no início de uma nova tendência. Exibição dos níveis de   TAKE
Mais do autor
Strategy Builder
Pavel Shutovskiy
5 (1)
Strategy Builder O indicador de Construtor de estratégia permite criar estratégias clássicas e individuais sem carregar o gráfico com um grande número de indicadores e sem rastrear muitos indicadores diferentes para identificar o sinal verdadeiro. O Construtor de estratégias exibe sinais na forma de setas em 30 indicadores padrão, 23 indicadores mostrando divergência clássica e oculta, recebendo sinais de níveis de Fibonacci, horizontal, linhas de tendência e retângulo. Com a ajuda deste indic
ADX arrow
Pavel Shutovskiy
5 (1)
ADX arrow Este indicador mostra os sinais do indicador ADX (índice médio de movimento direccional) como pontos no gráfico. Isto facilita a identificação visual dos sinais. O indicador também apresenta alertas (caixas de mensagens pop-up) empurrar e enviar sinais para o e-mail. Parametro Período médio. Aplicar ao preço utilizado para os cálculos: Próximo, Aberto, Alto, Baixo, mediana(alto+baixo)/2, típico (alto+baixo+perto)/3, próximo ponderado (alto+baixo+perto+perto) / 4. Alerta-Activar/D
OsMA Arrow MTF
Pavel Shutovskiy
3.9 (10)
The indicator displays crossing zero level by Moving Average of Oscillator (OsMA) in the form of arrows. The this is a multi-timeframe indicator, and it displays signals from other timeframes. The indicator notifies about a signal by means of a pop-up Alert window, or sending notification to e-mail. Parameters Time-frame - select timeframe to show indicator signals. Fast EMA Period - fast EMA. This is an exponential moving average from a price with a short period. Slow EMA Period - slow EMA. Th
FREE
OsMA Arrow
Pavel Shutovskiy
3.83 (6)
The indicator displays crossing zero level by Moving Average of Oscillator (OsMA) in the form of arrows. The indicator notifies about a signal by means of a pop-up Alert window, or sending notification to e-mail. Parameters Fast EMA Period - fast EMA. This is an exponential moving average from a price with a short period. Slow EMA Period - slow EMA. This is also an exponential moving average of a market price but with a longer period. Signal SMA Period - MACD SMA. This is a signal line which is
FREE
AC Arrow
Pavel Shutovskiy
4 (2)
The indicator displays zero level Accelerator Oscillator (AC) crossover in the form of dots on the chart. In indicator settings one can specify number of bars in the history to display signals, as well as shift of dots with respect to a bar. Parameters Bars — number of bars in the history to display indicator's signals; Shift — shift of dots with respect to bars.
FREE
Fibo
Pavel Shutovskiy
5 (2)
The script sets Fibonacci levels on the chart using maximums and minimums visible on the chart. The script names Fibo with such timeframe on which it has been launched (Fibo D1 or Fibo M30, etc.), therefore preserving previously constructed levels on different time charts. This instrument will be useful for those who start studying Fibonacci levels and those who need to form these levels in a speedy fashion. The script does not have additional settings. Fibonacci lines can be amended in standard
FREE
Beacon
Pavel Shutovskiy
5 (2)
The indicator determines overbought/oversold zones on various timeframes. Arrows show market trend in various time sessions: if the market leaves the overbought zone, the arrow will indicate an ascending trend (arrow up), if the market leaves the oversold zone, the arrow will indicate a descending trend (arrow down). Situation on the timeframe, where the indicator is located, is displayed in the lower right window. Information on the market location (overbought or oversold zone), as well as the
FREE
MA 2 Histogram
Pavel Shutovskiy
4.5 (2)
The indicator is based on two Moving Averages. Its only difference from traditional indicators is that it is presented as a histogram. The histogram has four colors; each color represents a MA with its own period. In case of a descending trend, if a price is lower than a moving average, the indicator displays a value lower than the red zero level. In case of ascending trend, the indicator value is higher than the green zero level. Parameters: Period MA 1 - Period of the first moving average. MA
FREE
AD Trend line
Pavel Shutovskiy
5 (1)
AD Trend line draws trend lines on the basis of A/D indicator (Accumulation/Distribution). When A/D indicator breaks a trend line, the probability of the trend reversal is very high. This is a multitimeframe indicator which can display values from higher timeframes. Parameters Time-frame — Select a timeframe; zero is the current timeframe of the chart; Trend Line — Display lines on the chart; Apply to — Apply lines to close the candle's highest/lowest value; Width line — Width of the line; Style
FREE
Trend following
Pavel Shutovskiy
4.5 (2)
The EA in the form of histogram displays up and down trends. This tool is recommended to be used as a filter. Its readings will help to detect beginning, end, and continuation of a trend. This additional tool will suit any trading system. Parameters Period — indicator period; Bars — number of bars on the history.
FREE
Maps
Pavel Shutovskiy
4.75 (4)
The indicator displays on the chart a map, on which markers show the current trading session, as well as shows a text. The indicator provides two types of background display: white and black. The indicator is displayed as the background and does not hinder tracking the current market situation. Parameters: GMT -  the time difference of the terminal and GMT. Background - selection of background - black or white.
FREE
Any chart has patterns of consolidation which are also called accumulation patterns. These are sections where the market has been on the same price level during significant amount of time, and thus it was accumulating positions. After such accumulation, positions are distributing, and the market passes from flat into trend. The Consolidation Levels indicator is a professional tool which identifies these sections and builds levels according to the price of the market at the moment of consolidatio
ATR Pivot
Pavel Shutovskiy
The indicator calculates the levels by ATR daily range using the equations: 1AR = Open + ATR -1AS = Open - ATR AR 1/2 = Open + (ATR / 2) AS -1/2 = Open - (ATR / 2) AR 1/4 = Open + (ATR / 4) AS -1/4 = Open - (ATR / 4) AR 3/4 = Open + ((ATR*3) / 4) AS -3/4 = Open - ((ATR*3) / 4) AR 2 = Open + (ATR*2) AS -2 = Open - (ATR*2) Parameters Period ATR - ATR period Shift time - shift by time for Open Color opening of day - Open line color Color 1AR, -1AS - 1AR, -1AS line color Color AR 1/2, AS -1/2 - AR 1
Max Min Levels
Pavel Shutovskiy
The indicator makes levels according to local maximums and minimums of a week, a month, or a year. Parameters: Week number - number of weeks for lines display Week level color - Week line color Month number - number of months for lines display Month level color - Month line color Year number - number of years for lines display Year level color - Year line color Width line - Width of lines Style line - Style of lines
AO AC Signal
Pavel Shutovskiy
The indicator displays signals of different indicators (which can be selected in parameters) on a chart when zero level is crossed. AO, AC or AO+AC if signals of two indicators coincide. The indicator shows an Alert message (pop-up window) when a signal appears. Parameters: Indicators - Selection of the indicator AO, AC, AO+AC. Bars - Number of bars in history for display of signals. Alert - Pop-up window in case of a signal.
The indicator displays trend reversal in the form of arrows. The indicator does not change its values (is not redrawn) after a signal. The program notifies about arrows by means of a pop-up window, or sending notification to e-mail. This is a multitimeframe instrument. Values of the indicator may be displayed from higher timeframes. Parameters Time-frame - select time session; zero is the current timeframe (Time-frame cannot be lower than the current time interval). Bars - number of bars on the
Beginning
Pavel Shutovskiy
The indicator builds levels from beginning of a week or a month, or according to local Highs and Lows. These levels are meant for detection of strong support and resistance levels on a chart. Most big players of the market are guided by particularly these data: opening of the week or opening of the month. Breakout of one or several Highs and price consolidation on these levels suggest that market intends to grow. Breakout of Lows and price consolidation bears evidence of market's intention to mo
F trend
Pavel Shutovskiy
The indicator is designed for scalping fans, it gives signals of an average of ten pips. The indicator is based on mathematical calculation, it determines the average range of the price channel, which is generally formed at the time of accumulation of positions. Once the price moves beyond its borders, a signal is generated in the form of an arrow. The indicator has a minimum of settings: the period for which you need to calculate, and the frequency of signals (the signal frequency is determined
Woltec
Pavel Shutovskiy
4 (1)
The indicator has been developed for scalping. The indicator is based on a mathematical calculation that determines the percent range of the price channel, which is generally formed at the time of the accumulation of positions. Once the price moves beyond its borders, a signal is generated in the form of dots. The indicator has a minimum of settings - the frequency of signals. Smaller values produce more signals. Parameters: Multiplier - the frequency of signals (with lower values signals are m
ADX trend
Pavel Shutovskiy
This indicator displays the signals of the ADX indicator (Average Directional Movement Index) as points on the chart. This facilitates the visual identification of signals. The indicator also features alerts (pop-up message boxes) and sending signals to e-mail. Parameters Period - averaging period. Apply to - price used for calculations: Close, Open, High, Low, Median (high+low)/2, Typical (high+low+close)/3, Weighted Close (high+low+close+close)/4. Alert - enable/disable alerts. EMail - enable
ADX arrow N
Pavel Shutovskiy
ADX arrow Este indicador mostra os sinais do indicador ADX (índice médio de movimento direccional) como pontos no gráfico. Isto facilita a identificação visual dos sinais. O indicador também apresenta alertas (caixas de mensagens pop-up) empurrar e enviar sinais para o e-mail. Parametro Período médio. Aplicar ao preço utilizado para os cálculos: Próximo, Aberto, Alto, Baixo, mediana(alto+baixo)/2, típico (alto+baixo+perto)/3, próximo ponderado (alto+baixo+perto+perto) / 4. Alerta-Activar/D
ATR Pivots
Pavel Shutovskiy
The indicator calculates intraday levels based on the average daily price range, builds support and resistance levels that may be reversal. Parameters Period ATR - period of the ATR indicator Shift time - time offset for the opening of the day Color opening of day - color of the opening line of the day Color 1AR, -1AS - line color 1AR, -1AS Color AR 1/2, AS -1/2 - line color AR 1/2, AS Color AR 1/4, AS -1/4 - line color AR 1/4, AS -1/4 Color AR 3/4, AS -3/4 - line color AR 3/4, AS -3/4 Color
Filtro:
Dimitri Nepomniachtchi
5762
Dimitri Nepomniachtchi 2018.05.27 00:15 
 

O usuário não deixou nenhum comentário para sua avaliação

rainwalker123
3430
rainwalker123 2018.01.15 09:05 
 

O usuário não deixou nenhum comentário para sua avaliação

NeobizFX
14
NeobizFX 2017.12.26 16:29 
 

O usuário não deixou nenhum comentário para sua avaliação

alexsxs72
398
alexsxs72 2017.12.03 04:12 
 

O usuário não deixou nenhum comentário para sua avaliação

Responder ao comentário