AD Trend line

5

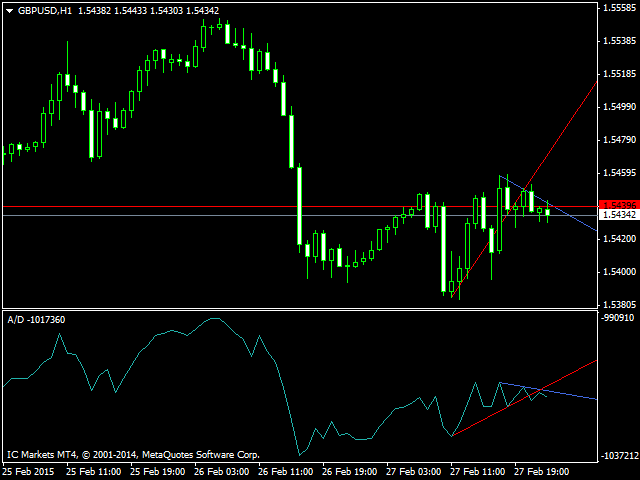
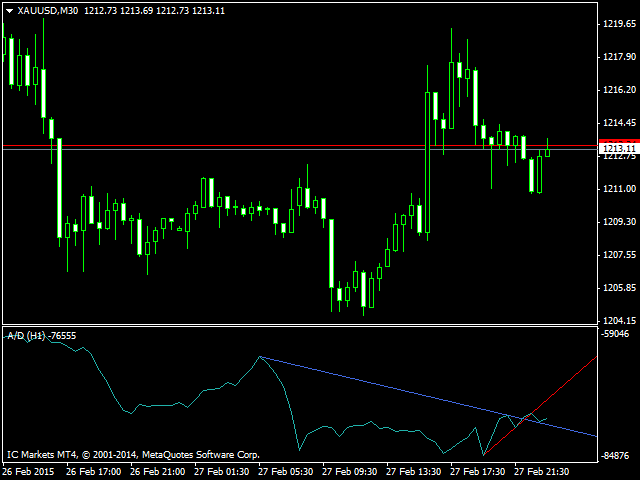
AD Trend line draws trend lines on the basis of A/D indicator (Accumulation/Distribution).

When A/D indicator breaks a trend line, the probability of the trend reversal is very high. This is a multitimeframe indicator which can display values from higher timeframes.

Parameters

  • Time-frame — Select a timeframe; zero is the current timeframe of the chart;
  • Trend Line — Display lines on the chart;
  • Apply to — Apply lines to close the candle's highest/lowest value;
  • Width line — Width of the line;
  • Style line — Style of the line;
  • Color up trend line — Color of the upper trend line;
  • Color down trend line — Color of the lower trend line.
Produtos recomendados
MQLTA Candle Timer
MQL4 Trading Automation
5 (1)
MQLTA Candle Timer is an indicator that can show you the details about a symbol/pair and alert you before the close of a candle. Used in swing trading and not only, it can help your strategies knowing and be ready before the close of a candle. How does it work Simply add the indicator to the chart and set the notifications options. You can load a minimalistic interface or a full interface. The alert will be sent once per candle. Parameters All the parameters, that you can see in the picture, a
FREE
HTF Candle Plus Timer Upgrade your trading experience with HTF Candle Plus Timer, a smart indicator that displays higher timeframe candles directly on your current chart. It allows you to stay aligned with the bigger market picture while focusing on your preferred trading timeframe. Key Features: Higher Timeframe Candles Plot custom higher timeframe (HTF) candles such as H1, H4, D1, W1, or MN directly on lower timeframe charts for a clearer market overview. Current Candle Timer A live countdown
This indicator uses a different approach from the previous version to get it's trendlines. This method is derived from Orchard Forex, and the process of making the indicator is demonstrated in there video   https://www.youtube.com/watch?v=mEaiurw56wY&t=1425s . The basic idea behind this indicator is it draws a   tangent line   on the highest levels and lowest levels of the bars used for calculation, while ensuring that the lines don't intersect with the bars in review (alittle confusing? I know
FREE
Shadow System Candles - AI Trend Visualization Concept "Stop trading in the dark. Equip your chart with Night Vision." Shadow System Candles is the visual core of the "Shadow Operation" project. It eliminates market noise and visualizes the true direction of the trend using AI-based logic (ADX + MA integration). Note: This tool does not generate buy/sell arrows. It is designed to train your eyes to recognize "Active Trends" and "Dangerous Ranges. Key Features ・AI Logic Coloring[/b]: Automat
FREE
Just INDY
Pankom Sriboonlue
5 (1)
Just INDY is a simple, and easy to use trend and reversal indicator. It will continuously monitor the movement of the price actions searching for new trends establishing or strong reversals at extreme overbought, and oversold levels. Parameters Signal Perios Sent Notification Please Test it with Strategy Tester and see how it work. Happy Trading...
FREE
KFX Symbol Changer
Peter Kariuki Thande
4 (1)
KFX SMA: Symbol Changer + Moving Average (3x) + ATR + RSI + Candle Timer. This indicator allows you to create a Symbol list and change between symbols of the current chart or Timeframe by selecting the appropriate button. On Chart there are three(3) multi timeframe Moving Averages shown (selected by you), ATR Value MTF ( selected by you -  helps with setting SL and TP), RSI Value MTF (selected by you) and a Candle Timer.   Features: - Symbol Changer : Change Symbol and Timeframe of Chart.   (s
FREE
Apex Trend Sniper
Steffen Reinhold Noll
Apex Trend Sniper Apex Trend Sniper is a trend-following indicator for MetaTrader 4. It identifies directional changes in price by combining a Williams Percent Range oscillator with a multi-layer filter system. Signals are displayed directly on the chart as arrows. The indicator is suitable for use on Bitcoin (BTCUSD), major indices (US30, GER40, NAS100, SPX500) and Gold (XAUUSD). Operation The core signal is derived from the Williams Percent Range. When the oscillator crosses defined threshold
FREE
MACD Scanner With Alerts
Niravkumar Maganbhai Patel
4 (2)
MACD Dashboard Panel   This indicator helps you to scan symbols which are in the Market Watch window and filter out a trend according to MACD. Moving Average Convergence Divergence (MACD) is a trend-following momentum indicator that shows the relationship between two moving averages of a security’s price. The MACD is calculated by subtracting the 26-period Exponential Moving Average (EMA) from the 12-period EMA. The result of that calculation is the MACD line. A nine-day EMA of the MACD called
FREE
Indicador Crypto_Forex "Histograma de Entrada de Tendência" para MT4, sem repintura. - O indicador Histograma de Entrada de Tendência pode ser usado para buscar sinais de entrada na direção da tendência assim que a barra de entrada aparecer. - Este indicador possui um recurso exclusivo: ele considera preço e volume para cálculos. - O Histograma de Entrada de Tendência pode ter duas cores: vermelho para tendência de baixa e azul para tendência de alta. - Assim que você observar uma tendência es
Esta ferramenta oferece dois grandes benefícios: melhora a usabilidade dos indicadores econômicos do MT5 e permite o compartilhamento fluido dos dados com o MT4. Por exemplo, permite usar de forma eficaz dados de indicadores econômicos de mais de 10 anos atrás para treinamentos e backtesting. Além disso, é compatível com o PracticeSimulator do MT4, tornando-se uma ferramenta valiosa para tudo, desde praticar negociações com dados históricos até negociações ao vivo no MT4. Aviso importante Esta
FREE
Liquidity Sentinel Pro – Painel Multi-TF e Alertas de Rejeição de Pavio Descrição: O Liquidity Sentinel Pro é um poderoso indicador tudo-em-um para MT4, projetado para fornecer aos traders uma visão completa da dinâmica do mercado, combinando análise de tendência em múltiplos períodos de tempo, força de oferta/demanda e alertas precisos de rejeição de pavio. Esta ferramenta oferece informações práticas sobre quais pares de moedas ou ativos estão em tendência, destaca pontos de reversão de alta p
Jerk Indicator
Safwan Rushdi Khalil Arekat
5 (1)
In physics, "Jerk" is the third time-derivative of position, with acceleration being the second derivative and velocity the first derivative. In technical analysis, the first derivative of price is the price momentum, with the second derivative,acceleration, being seldom used and the third derivative virtually unknown. The magnitude frequency response of a digital differentiator is a positive-slope straight line passing through zero frequency. Therefore, every instance of a digital signal differ
FREE
Lisek Stochastic
Darius Hans Lischka
2.83 (6)
Lisek Stochastic   oscillator indicator with Alarm, Push Notifications and e-mail  Notifications. The Stochastic indicator is a momentum indicator that shows you how strong or weak the current trend is. It helps you identify overbought and oversold market conditions within a trend. The Stochastic indicator is lagging indicator, which means it don't predict where price is going, it is only providing data on where price has been !!! How to trade with Stochastic indicator: Trend following: As long
FREE
MA in color PRT
Irina Cherkashina
The MA in Color_PRT Indicator offers valuable insights into market trends by displaying moving averages in different colors based on their direction. Green indicates an uptrend, red for a downtrend, and yellow for a consolidation phase. Traders can use this indicator to easily identify potential entry and exit points in their forex trades. When the lines change color, it can signal a change in market direction, giving traders an opportunity to adjust their strategy accordingly. Additionally, th
FREE
The Magic SMMA indicator is of great help in determining trend direction. It can be an excellent addition to your existing strategy or the basis of a new one. We humans can make better decisions when we see better visually. So we designed it to show a different color for rising and falling trends. Everyone can customize this in the way that suits them best. By setting the Trend Period, we can optimize it for longer or shorter trends for our strategy. It is great for all time frames. IF YOU NEE
FREE
Este indicador antecipa reversões de preços analisando as pressões de alta e de baixa no mercado. A pressão de compra é a soma de todas as barras de acumulação ao longo de um determinado número de dias, multiplicada pelo volume. A pressão de venda é a soma de toda a distribuição no mesmo número de barras, multiplicada pelo volume. [ Guia de instalação | Guia de atualização | Solução de problemas | FAQ | Todos os produtos ] A proporção do indicador fornece uma medida da pressão de compra como uma
FREE
The Stock Exchange One Sessions Hours version 2.00 This indicator facilitates observing the currency pair's quotations during subsequent parts of the stock exchange session live. Before the session starts, a rectangle is drawn on the chart but not filled in with color. It means the extent of the session duration. Before the first bar enters the rectangle of the session, a sound signal or pop-up window will notify us that the session will just start. When the price graph crosses the edge of the
FREE
Dark Bands
Marco Solito
4.96 (157)
Dark Bands   is an Indicator for intraday trading. This Indicator is based on   Counter Trend  strategy but use also Volatility. We can enter in good price with this Indicator, in order to follow the inversions on the current instrument. Key benefits Easily visible take profit/stop loss lines Reliable bands lines with futuristic colors, and  Intuitive directional arrows Useful   statistics , which indicate the   win rate   of the signals   Plus Package  available, leave a feedback to receive
FREE
Strategy Overview (Best for Scalping) - Non-repainting A sophisticated multi-filter trading system designed to identify high-probability entry points with exceptional precision. This proprietary methodology combines multiple confirmation layers to generate signals with high statistical reliability. ATTACH THE INDICATOR TO RENKO CHART Entry Conditions: Buy Entry: Price is above the Green line Up Arrows are plotted Sell Entry: Price is above the Red line Down Arrows are plotted
The Hong Kong Stock Exchange Session's Hours This indicator facilitates observing the currency pair's quotations during subsequent parts of the stock exchange session live. Before the session starts, a rectangle is drawn on the chart but not filled in with color. It means the extent of the session duration. Before the first bar enters the rectangle of the session, a sound signal or pop-up window will notify us that the session will just start. When the price graph crosses the edge of the sessi
FREE
MA Multi-Currencies  Multi-Timeframes Histogram BUY/SELL Indicator up to 6 currencies on time  calculations based on 6 time frames : M5, M15, M30, H1, H4, D1 Trading Strategies: **TREND shifts to UP trend when Green point appears after Red and Gray points -> Close SELL positions then add new BUY positions on new Green points  **TREND shifts to DOWN trend when Red point appears after Green and Gray points -> Close BUY  positions then add new SELL positions on new Red points ** Close BUY position
Wa Candle Timer Percentage
Wachinou Lionnel Pyrrhus Sovi Guidi
Wa Candle Timer Percentage MT4 is an indicator which shows the user how much time is remaining until the next candle will form. The percentage of the evolution of the current candle is also displayed. The user can set the percentage that the candle timer will change the color. These are the settings: 1- The percentage that the candle timer will change the color. 2- Color of Candle Timer when it's BELOW the percentage set by the user. 3- Color of Candle Timer when it's ABOVE the percentage set b
FREE
O R Var Moving Average Indicator é um indicador de tendência desenvolvido para seguidores obstinados de tendências. É um indicador de negociação forex bastante popular entre os comerciantes de ações, bem como os comerciantes de commodities, e sua popularidade decorre de sua capacidade de fornecer sinais genuínos de geração de dinheiro para seus usuários. O indicador é composto por pontos verdes e vermelhos que são colocados em uma linha sienna. O ponto verde aponta para um sinal de alta, enqu
FREE
Currency Strength Gauge incicator The currency strength gauge is an indicator to measure of the strength or weakness of currencies in the Forex market. Comparing the strength of currencies in a graphic representation will lead to a good overview of the market and its future trends. You will see in a graphic chart both the strength of the currencies and their correlation, and this will help you in your decisions to get better trades.   -To easy detection of over Overbought and Oversold points,
The Icarus Reversals(TM) FREE Indicator is a powerful tool to identify high-probability reversal points, across all instruments.  The Reversals Indicator provides traders and investors with a simple-to-use and highly dynamic insight into points of likely price-action reversals.  Generated by a unique proprietary code-set, the Reversals Indicator (FREE version) generates long and short trade signals, which can be customised for key inputs and colourisation. Settings of the Icarus Reversals FREE h
FREE
Skan
Niravkumar Maganbhai Patel
4.75 (4)
SKAN   This indicator helps you to scan all symbols which are in the Market Watch window and filter out a trend with alerts. It works on five most effective indicators which are used by most of traders for trading: Moving Average Super Trend (ST) Bolinger Band (BB) OPRC BFD It calculates two bars for scanning. When box colour changes to coral or royal blue colour, it indicates you for trend change for long and short entry. And also you will get alert on screen. When it changes to royal blue, it
FREE
Advanced Currency Strength Indicator Comprehensive Market Analysis in One Tool User-Friendly and Versatile for All Traders This indicator simplifies market analysis by evaluating the strength of 28 forex currency pairs, along with Gold, Silver, and other selected instruments. By using a Triangular Moving Average (TMA) and ATR-based bands , it provides a structured view of market movements, assisting traders in making informed decisions. Identify Market Trends Efficiently The indicator helps ass
Currency StrengtT
Hafis Mohamed Yacine
What Is Currency StrengtT Indicator? A currency strengthT indicator is a graphical tool that shows the strength of a currency. Common indicators usually show the strength of a currency in relation to another currency, however, with some calculations it is possible to find the absolute strength of each individual currency. Therefore, a currency strength matrix indicator (or meter) is a tool that tries to express the absolute strength of a currency, so that you can compare this strength with the
ATR Stops MTF
Marcio Jose Da Silva Pereira
5 (1)
ATR Stops MTF é um indicador de tendência baseado em ATR (Average True Range) que fornece níveis dinâmicos de stop, ajudando o trader a identificar a direção predominante do mercado e possíveis pontos de reversão. O indicador suporta multitimeframe (MTF) , filtro por média móvel e possui botão ON/OFF diretamente no gráfico para controle visual rápido. Principais características Stops dinâmicos baseados em ATR Identificação clara da tendência atual Suporte a Multitimeframe (MTF) Filtro
FREE
BeST Oscillators Collection is a Composite MT4 Indicator including the  Chaikin,Chande  and TRIX Oscillators which by default are contained in  MT5  but not in  MT4 platform. It  also provides  the option of displaying or not a Mov. Avg. as a Signal   Line and the resulting Signals as Arrows in a Normal (all arrows) or in a Reverse Mode (without showing up any resulting successive and of same type arrows). Analytically for each one of the specific Oscillators: The Chaikin Oscillator ( CHO )   is
FREE
Os compradores deste produto também adquirem
Gann Made Easy
Oleg Rodin
4.83 (155)
Gann Made Easy é um sistema de negociação Forex profissional e fácil de usar, baseado nos melhores princípios de negociação usando a teoria do sr. W. D. Gann. O indicador fornece sinais precisos de COMPRA e VENDA, incluindo níveis de Stop Loss e Take Profit. Você pode negociar mesmo em movimento usando notificações PUSH. ENTRE EM CONTATO COMIGO APÓS A COMPRA PARA RECEBER DICAS DE NEGOCIAÇÃO, BÔNUS E O ASSISTENTE EA "GANN MADE EASY" GRATUITAMENTE! Provavelmente você já ouviu muitas vezes sobre os
Game Changer Indicator
Vasiliy Strukov
4.76 (17)
Game Changer es un indicador de tendencia revolucionario, diseñado para usarse en cualquier instrumento financiero y transformar su MetaTrader en un potente analizador de tendencias. Funciona en cualquier marco temporal y facilita la identificación de tendencias, señala posibles reversiones, actúa como mecanismo de trailing stop y proporciona alertas en tiempo real para una respuesta rápida del mercado. Tanto si es un profesional experimentado como si es un principiante que busca una ventaja com
GOLD Impulse with Alert
Bernhard Schweigert
4.64 (11)
Este indicador é uma super combinação dos nossos 2 produtos Advanced Currency IMPULSE with ALERT  +   Currency Strength Exotics . Funciona para todos os períodos de tempo e mostra graficamente impulso de força ou fraqueza para as 8 principais moedas mais um Símbolo! Este Indicador é especializado para mostrar a aceleração da força da moeda para quaisquer símbolos como Ouro, Pares Exóticos, Commodities, Índices ou Futuros. É o primeiro do seu género, qualquer símbolo pode ser adicionado à 9ª
Scalper Inside PRO
Alexey Minkov
4.74 (69)
An exclusive indicator that utilizes an innovative algorithm to swiftly and accurately determine the market trend. The indicator automatically calculates opening, closing, and profit levels, providing detailed trading statistics. With these features, you can choose the most appropriate trading instrument for the current market conditions. Additionally, you can easily integrate your own arrow indicators into Scalper Inside Pro to quickly evaluate their statistics and profitability. Scalper Inside
Trend Lines PRO
Roman Podpora
5 (1)
LINHAS DE TENDÊNCIA PRO       Ajuda a entender onde o mercado está realmente mudando de direção. O indicador mostra inversões de tendência reais e pontos onde os principais participantes retornam ao mercado. Você vê     Linhas BOS     Análise de tendências e níveis-chave em prazos maiores — sem configurações complexas ou ruídos desnecessários. Os sinais não são repintados e permanecem no gráfico após o fechamento da barra. VERSÃO MT 5      -      Revela seu potencial máximo quando emparelhada co
Indicador Miraculous – Ferramenta 100% Não Repintável para Forex e Opções Binárias Baseada no Quadrado de Nove de Gann Este vídeo apresenta o Indicador Miraculous , uma ferramenta de negociação altamente precisa e poderosa, desenvolvida especificamente para traders de Forex e Opções Binárias . O que torna este indicador único é a sua base no lendário Quadrado de Nove de Gann e na Lei da Vibração de Gann , tornando-o uma das ferramentas de previsão mais precisas disponíveis na negociação moderna.
Dynamic Forex28 Navigator
Bernhard Schweigert
4.43 (7)
Dynamic Forex28 Navigator - A ferramenta de negociação Forex de última geração. ATUALMENTE 49% DE DESCONTO. Dynamic Forex28 Navigator é a evolução dos nossos indicadores populares de longa data, combinando o poder de três em um: Indicador Advanced Currency Strength28 (695 avaliações) + Advanced Currency IMPULSE com ALERTA (520 avaliações) + Sinais CS28 Combo (Bônus). Detalhes sobre o indicador https://www.mql5.com/en/blogs/post/758844 O que o Next-Generation Strength Indicator oferece?  Tudo
RFI levels PRO
Roman Podpora
5 (1)
O indicador mostra com precisão os pontos de reversão e as zonas de retorno de preço onde o   Principais players . Você identifica onde novas tendências estão se formando e toma decisões com máxima precisão, mantendo o controle sobre cada negociação. VERSION MT5     -     Revela seu potencial máximo quando combinado com o indicador   TREND LINES PRO. O que o indicador mostra: Estruturas de reversão e níveis de reversão com ativação no início de uma nova tendência. Exibição dos níveis de   TAKE
M1 Sniper
Oleg Rodin
5 (19)
O M1 SNIPER é um sistema indicador de negociação fácil de usar. É um indicador de seta projetado para o período M1. O indicador pode ser usado como um sistema independente para scalping no período M1 e pode ser usado como parte do seu sistema de negociação existente. Embora este sistema de negociação tenha sido projetado especificamente para negociação no M1, ele também pode ser usado em outros períodos. Originalmente, desenvolvi este método para negociar XAUUSD e BTCUSD. Mas considero-o útil ta
Currency Strength Wizard é um indicador muito poderoso que fornece uma solução completa para uma negociação bem-sucedida. O indicador calcula o poder deste ou daquele par forex usando os dados de todas as moedas em vários intervalos de tempo. Esses dados são representados em uma forma de índice de moeda fácil de usar e linhas de energia de moeda que você pode usar para ver o poder desta ou daquela moeda. Tudo o que você precisa é anexar o indicador ao gráfico que deseja negociar e o indicador mo
Currency Strength Exotics
Bernhard Schweigert
4.88 (33)
ACTUALMENTE 20% DE DESCONTO ! A melhor solução para qualquer novato ou comerciante especializado! Este Indicador é especializado para mostrar a força da moeda para quaisquer símbolos como Pares Exóticos de Commodities, Índices ou Futuros. É o primeiro do seu género, qualquer símbolo pode ser adicionado à 9ª linha para mostrar a verdadeira força da moeda de Ouro, Prata, Petróleo, DAX, US30, MXN, TRY, CNH etc. Esta é uma ferramenta de negociação única, de alta qualidade e acessível, porque inco
Precautions for subscribing to indicator This indicator only supports the computer version of MT4 Does not support MT5, mobile phones, tablets The indicator only shows the day's entry arrow The previous history arrow will not be displayed (Live broadcast is for demonstration) The indicator is a trading aid Is not a EA automatic trading No copy trading function The indicator only indicates the entry position No exit (target profit)  The entry stop loss point is set at 30-50 PIPS Or the front hi
O sistema PRO Renko é um sistema de negociação altamente preciso especialmente concebido para a negociação de gráficos RENKO. Trata-se de um sistema universal que pode ser aplicado a vários instrumentos de negociação. O sistema neutraliza eficazmente o chamado ruído de mercado, dando-lhe acesso a sinais de inversão precisos. O indicador é muito fácil de usar e tem apenas um parâmetro responsável pela geração de sinal. Você pode facilmente adaptar a ferramenta a qualquer instrumento de negocia
Are you looking for a simple and reliable indicator that can help you spot market swing points easily? Do you want clear buy and sell signals that work on any timeframe and any trading instrument? Buy Sell Signal Pro is designed to do exactly that. It helps traders identify important market turning points and understand the current market structure in a clear and easy way. This indicator detects Higher Highs (HH), Higher Lows (HL), Lower Highs (LH), and Lower Lows (LL) so you can quickly see wh
Actualmente 40% OFF ! A melhor solução para qualquer novato ou comerciante especializado! Este software de painel de instrumentos está a funcionar em 28 pares de moedas. É baseado em 2 dos nossos principais indicadores (Advanced Currency Strength 28 e Advanced Currency Impulse). Dá uma grande visão geral de todo o mercado Forex. Mostra valores avançados de força da moeda, velocidade de movimento da moeda e sinais para 28 pares de divisas em todos os (9) períodos de tempo. Imagine como a sua n
ACTUALMENTE COM 40% DE DESCONTO A melhor solução para qualquer novato ou comerciante especializado! Este Indicador é uma ferramenta comercial única, de alta qualidade e acessível, porque incorporámos uma série de características proprietárias e uma nova fórmula. Com apenas UM gráfico, pode ler a força da moeda para 28 pares de Forex! Imagine como a sua negociação irá melhorar porque é capaz de apontar o ponto exacto do gatilho de uma nova tendência ou oportunidade de escalada? Manual do util
FX Power MT4 NG
Daniel Stein
4.95 (21)
FX Power: Analise a Força das Moedas para Decisões de Negociação Mais Inteligentes Visão Geral FX Power é a sua ferramenta essencial para compreender a força real das principais moedas e do ouro em quaisquer condições de mercado. Identificando moedas fortes para comprar e fracas para vender, FX Power simplifica as decisões de negociação e revela oportunidades de alta probabilidade. Quer você prefira seguir tendências ou antecipar reversões usando valores extremos de Delta, esta ferramenta adap
Advanced Supply Demand
Bernhard Schweigert
4.91 (298)
Atualmente com 40% de desconto! A melhor solução para qualquer Trader Novato ou especialista! Este indicador é uma ferramenta de negociação exclusiva, de alta qualidade e acessível porque incorporamos uma série de recursos proprietários e uma nova fórmula. Com esta atualização, você poderá mostrar fusos horários duplos. Você não só será capaz de mostrar um TF mais alto, mas também mostrar ambos, o TF do gráfico, MAIS o TF mais alto: MOSTRANDO ZONAS ANINHADAS. Todos os traders de Oferta e Demanda
ACTUALMENTE 40% DE DESCONTO!! A melhor solução para qualquer novato ou comerciante especializado! Este indicador é uma ferramenta comercial única, de alta qualidade e acessível, porque incorporámos uma série de características proprietárias e uma fórmula secreta. Com apenas UM gráfico, dá alertas para todos os 28 pares de moedas. Imagine como a sua negociação irá melhorar porque é capaz de identificar o ponto exacto de desencadeamento de uma nova tendência ou oportunidade de escalada! Constr
Trend indicator AI
Ramil Minniakhmetov
4.57 (82)
O indicador Trend Ai é uma ótima ferramenta que irá melhorar a análise de mercado de um trader, combinando a identificação de tendências com pontos de entrada acionáveis e alertas de reversão. Este indicador permite que os usuários naveguem pelas complexidades do mercado forex com confiança e precisão Além dos sinais primários, o indicador Trend Ai identifica pontos de entrada secundários que surgem durante retrações ou retrações, permitindo que os comerciantes capitalizem as correções de preço
FX Volume
Daniel Stein
4.63 (38)
FX Volume: Vivencie o Verdadeiro Sentimento de Mercado sob a Perspectiva de um Corretor Visão Geral Rápida Quer aprimorar sua abordagem de trading? FX Volume fornece insights em tempo real sobre como traders de varejo e corretores estão posicionados—bem antes de relatórios atrasados como o COT. Seja para buscar ganhos consistentes ou simplesmente ter uma vantagem mais clara no mercado, FX Volume ajuda você a detectar grandes desequilíbrios, confirmar rompimentos e aperfeiçoar sua gestão de ris
Apollo Secret Trend é um indicador de tendência profissional que pode ser usado para encontrar tendências em qualquer par e período de tempo. O indicador pode facilmente se tornar seu principal indicador de negociação, que você pode usar para detectar tendências de mercado, não importa qual par ou período de tempo você prefira negociar. Ao usar um parâmetro especial no indicador, você pode adaptar os sinais ao seu estilo de negociação pessoal. O indicador fornece todos os tipos de alertas, inclu
Meravith
Ivan Stefanov
5 (3)
Ferramenta dos market makers. O Meravith irá: Analisar todos os timeframes e exibir a tendência atual em vigor. Destacar zonas de liquidez (equilíbrio de volume) onde o volume comprador e vendedor é igual. Mostrar todos os níveis de liquidez de diferentes timeframes diretamente no seu gráfico. Gerar e apresentar análise de mercado em formato de texto para sua referência. Calcular alvos, níveis de suporte e pontos de stop-loss com base na tendência atual. Calcular a relação risco/retorno das sua
O Apollo SR Master é um indicador de Suporte/Resistência com recursos especiais que tornam a negociação com zonas de Suporte/Resistência mais fácil e confiável. O indicador calcula as zonas de Suporte/Resistência em tempo real, sem qualquer atraso, detectando topos e fundos de preço locais. Em seguida, para confirmar a área de Suporte/Resistência recém-formada, o indicador exibe um sinal especial que indica que a zona pode ser considerada e usada como um sinal de VENDA ou COMPRA. Nesse caso, a f
Presenting one-of-a-kind Gann Indicator for XAUUSD IQ Gold Gann Levels is a non-repainting, precision tool designed exclusively for XAUUSD/Gold intraday trading. It uses W.D. Gann’s square root method to plot real-time support and resistance levels, helping traders spot high-probability entries with confidence and clarity. William Delbert Gann (W.D. Gann) was an exceptional market analyst whose trading technique was based on a complex blend of mathematics, geometry, astrology, and ancient calcul
KT Trend Trading Suite MT4
KEENBASE SOFTWARE SOLUTIONS
O KT Trend Trading Suite é um indicador multifuncional que combina uma estratégia de acompanhamento de tendência com múltiplos pontos de rompimento como sinais de entrada. Assim que uma nova tendência é estabelecida, o indicador oferece várias oportunidades de entrada para aproveitar o movimento. Um limite de recuo é utilizado para evitar entradas menos relevantes. Versão para MT5 disponível aqui  https://www.mql5.com/en/market/product/46270 Recursos Combina diversas dinâmicas de mercado em
El indicador "MR BEAST ALERTAS DE LIQUIDEZ" es una herramienta avanzada diseñada para proporcionar señales y alertas sobre la liquidez del mercado basándose en una serie de indicadores técnicos y análisis de tendencias. Ideal para traders que buscan oportunidades de trading en función de la dinámica de precios y los niveles de volatilidad, este indicador ofrece una visualización clara y detallada en la ventana del gráfico de MetaTrader. Características Principales: Canal ATR Adaptativo: Calcula
Volatility Trend System - um sistema de negociação que dá sinais para entradas. O sistema de volatilidade fornece sinais lineares e pontuais na direção da tendência, bem como sinais para sair dela, sem redesenho e atrasos. O indicador de tendência monitora a direção da tendência de médio prazo, mostra a direção e sua mudança. O indicador de sinal é baseado em mudanças na volatilidade e mostra entradas no mercado. O indicador está equipado com vários tipos de alertas. Pode ser aplicado a vários i
GM Arrows Pro
Guillaume Pierre Philippe Mesplont
Product Name: GM Arrows Pro – Signals & Alerts Short Description: GM Arrows Pro is a clean, reliable MT4 indicator showing BUY/SELL arrows on the chart with unique alerts at the moment the signal appears. Full Description: GM Arrows Pro is a professional MT4 indicator designed for traders who want clear, actionable signals: BUY and SELL arrows visible on the entire chart history Unique alerts when a new signal appears (no repeated alerts) Option to disable repetitive signals ( disable_repeatin
Difícil de encontrar e com pouca frequência, as divergências são um dos cenários de negociação mais confiáveis. Este indicador localiza e verifica automaticamente divergências ocultas e regulares usando seu oscilador favorito. [ Guia de instalação | Guia de atualização | Solução de problemas | FAQ | Todos os produtos ] Fácil de trocar Encontra divergências regulares e ocultas Suporta muitos osciladores conhecidos Implementa sinais de negociação baseados em fugas Exibe níveis adequados de sto
Mais do autor
The indicator displays trend reversal in the form of arrows. The indicator does not change its values (is not redrawn) after a signal. The program notifies about arrows by means of a pop-up window, or sending notification to e-mail. This is a multitimeframe instrument. Values of the indicator may be displayed from higher timeframes. Parameters Time-frame - select time session; zero is the current timeframe (Time-frame cannot be lower than the current time interval). Bars - number of bars on the
ADX arrow
Pavel Shutovskiy
5 (1)
ADX arrow Este indicador mostra os sinais do indicador ADX (índice médio de movimento direccional) como pontos no gráfico. Isto facilita a identificação visual dos sinais. O indicador também apresenta alertas (caixas de mensagens pop-up) empurrar e enviar sinais para o e-mail. Parametro Período médio. Aplicar ao preço utilizado para os cálculos: Próximo, Aberto, Alto, Baixo, mediana(alto+baixo)/2, típico (alto+baixo+perto)/3, próximo ponderado (alto+baixo+perto+perto) / 4. Alerta-Activar/D
OsMA Arrow MTF
Pavel Shutovskiy
3.9 (10)
The indicator displays crossing zero level by Moving Average of Oscillator (OsMA) in the form of arrows. The this is a multi-timeframe indicator, and it displays signals from other timeframes. The indicator notifies about a signal by means of a pop-up Alert window, or sending notification to e-mail. Parameters Time-frame - select timeframe to show indicator signals. Fast EMA Period - fast EMA. This is an exponential moving average from a price with a short period. Slow EMA Period - slow EMA. Th
FREE
Trend following
Pavel Shutovskiy
4.5 (2)
The EA in the form of histogram displays up and down trends. This tool is recommended to be used as a filter. Its readings will help to detect beginning, end, and continuation of a trend. This additional tool will suit any trading system. Parameters Period — indicator period; Bars — number of bars on the history.
FREE
Maps
Pavel Shutovskiy
4.75 (4)
The indicator displays on the chart a map, on which markers show the current trading session, as well as shows a text. The indicator provides two types of background display: white and black. The indicator is displayed as the background and does not hinder tracking the current market situation. Parameters: GMT -  the time difference of the terminal and GMT. Background - selection of background - black or white.
FREE
OsMA Arrow
Pavel Shutovskiy
3.83 (6)
The indicator displays crossing zero level by Moving Average of Oscillator (OsMA) in the form of arrows. The indicator notifies about a signal by means of a pop-up Alert window, or sending notification to e-mail. Parameters Fast EMA Period - fast EMA. This is an exponential moving average from a price with a short period. Slow EMA Period - slow EMA. This is also an exponential moving average of a market price but with a longer period. Signal SMA Period - MACD SMA. This is a signal line which is
FREE
Beacon
Pavel Shutovskiy
5 (2)
The indicator determines overbought/oversold zones on various timeframes. Arrows show market trend in various time sessions: if the market leaves the overbought zone, the arrow will indicate an ascending trend (arrow up), if the market leaves the oversold zone, the arrow will indicate a descending trend (arrow down). Situation on the timeframe, where the indicator is located, is displayed in the lower right window. Information on the market location (overbought or oversold zone), as well as the
FREE
AC Arrow
Pavel Shutovskiy
4 (2)
The indicator displays zero level Accelerator Oscillator (AC) crossover in the form of dots on the chart. In indicator settings one can specify number of bars in the history to display signals, as well as shift of dots with respect to a bar. Parameters Bars — number of bars in the history to display indicator's signals; Shift — shift of dots with respect to bars.
FREE
MA 2 Histogram
Pavel Shutovskiy
4.5 (2)
The indicator is based on two Moving Averages. Its only difference from traditional indicators is that it is presented as a histogram. The histogram has four colors; each color represents a MA with its own period. In case of a descending trend, if a price is lower than a moving average, the indicator displays a value lower than the red zero level. In case of ascending trend, the indicator value is higher than the green zero level. Parameters: Period MA 1 - Period of the first moving average. MA
FREE
Fibo
Pavel Shutovskiy
5 (2)
The script sets Fibonacci levels on the chart using maximums and minimums visible on the chart. The script names Fibo with such timeframe on which it has been launched (Fibo D1 or Fibo M30, etc.), therefore preserving previously constructed levels on different time charts. This instrument will be useful for those who start studying Fibonacci levels and those who need to form these levels in a speedy fashion. The script does not have additional settings. Fibonacci lines can be amended in standard
FREE
Any chart has patterns of consolidation which are also called accumulation patterns. These are sections where the market has been on the same price level during significant amount of time, and thus it was accumulating positions. After such accumulation, positions are distributing, and the market passes from flat into trend. The Consolidation Levels indicator is a professional tool which identifies these sections and builds levels according to the price of the market at the moment of consolidatio
ATR Pivot
Pavel Shutovskiy
The indicator calculates the levels by ATR daily range using the equations: 1AR = Open + ATR -1AS = Open - ATR AR 1/2 = Open + (ATR / 2) AS -1/2 = Open - (ATR / 2) AR 1/4 = Open + (ATR / 4) AS -1/4 = Open - (ATR / 4) AR 3/4 = Open + ((ATR*3) / 4) AS -3/4 = Open - ((ATR*3) / 4) AR 2 = Open + (ATR*2) AS -2 = Open - (ATR*2) Parameters Period ATR - ATR period Shift time - shift by time for Open Color opening of day - Open line color Color 1AR, -1AS - 1AR, -1AS line color Color AR 1/2, AS -1/2 - AR 1
Max Min Levels
Pavel Shutovskiy
The indicator makes levels according to local maximums and minimums of a week, a month, or a year. Parameters: Week number - number of weeks for lines display Week level color - Week line color Month number - number of months for lines display Month level color - Month line color Year number - number of years for lines display Year level color - Year line color Width line - Width of lines Style line - Style of lines
AO AC Signal
Pavel Shutovskiy
The indicator displays signals of different indicators (which can be selected in parameters) on a chart when zero level is crossed. AO, AC or AO+AC if signals of two indicators coincide. The indicator shows an Alert message (pop-up window) when a signal appears. Parameters: Indicators - Selection of the indicator AO, AC, AO+AC. Bars - Number of bars in history for display of signals. Alert - Pop-up window in case of a signal.
Beginning
Pavel Shutovskiy
The indicator builds levels from beginning of a week or a month, or according to local Highs and Lows. These levels are meant for detection of strong support and resistance levels on a chart. Most big players of the market are guided by particularly these data: opening of the week or opening of the month. Breakout of one or several Highs and price consolidation on these levels suggest that market intends to grow. Breakout of Lows and price consolidation bears evidence of market's intention to mo
F trend
Pavel Shutovskiy
The indicator is designed for scalping fans, it gives signals of an average of ten pips. The indicator is based on mathematical calculation, it determines the average range of the price channel, which is generally formed at the time of accumulation of positions. Once the price moves beyond its borders, a signal is generated in the form of an arrow. The indicator has a minimum of settings: the period for which you need to calculate, and the frequency of signals (the signal frequency is determined
Woltec
Pavel Shutovskiy
4 (1)
The indicator has been developed for scalping. The indicator is based on a mathematical calculation that determines the percent range of the price channel, which is generally formed at the time of the accumulation of positions. Once the price moves beyond its borders, a signal is generated in the form of dots. The indicator has a minimum of settings - the frequency of signals. Smaller values produce more signals. Parameters: Multiplier - the frequency of signals (with lower values signals are m
Jaguar tac
Pavel Shutovskiy
The indicator uses the Envelopes channel in its calculations, which allows working with dynamic support and resistance levels. It also considers the direction and strength of the trend, as well as the mathematical calculation that determines the percent range of the price channel, which is generally formed at the time of the accumulation of positions. It first generates a preliminary signal in the form of a round arrow. Then it is necessary to wait for a normal arrow and enter the market only af
ADX trend
Pavel Shutovskiy
This indicator displays the signals of the ADX indicator (Average Directional Movement Index) as points on the chart. This facilitates the visual identification of signals. The indicator also features alerts (pop-up message boxes) and sending signals to e-mail. Parameters Period - averaging period. Apply to - price used for calculations: Close, Open, High, Low, Median (high+low)/2, Typical (high+low+close)/3, Weighted Close (high+low+close+close)/4. Alert - enable/disable alerts. EMail - enable
Strategy Builder
Pavel Shutovskiy
5 (1)
Strategy Builder O indicador de Construtor de estratégia permite criar estratégias clássicas e individuais sem carregar o gráfico com um grande número de indicadores e sem rastrear muitos indicadores diferentes para identificar o sinal verdadeiro. O Construtor de estratégias exibe sinais na forma de setas em 30 indicadores padrão, 23 indicadores mostrando divergência clássica e oculta, recebendo sinais de níveis de Fibonacci, horizontal, linhas de tendência e retângulo. Com a ajuda deste indic
ADX arrow N
Pavel Shutovskiy
ADX arrow Este indicador mostra os sinais do indicador ADX (índice médio de movimento direccional) como pontos no gráfico. Isto facilita a identificação visual dos sinais. O indicador também apresenta alertas (caixas de mensagens pop-up) empurrar e enviar sinais para o e-mail. Parametro Período médio. Aplicar ao preço utilizado para os cálculos: Próximo, Aberto, Alto, Baixo, mediana(alto+baixo)/2, típico (alto+baixo+perto)/3, próximo ponderado (alto+baixo+perto+perto) / 4. Alerta-Activar/D
ATR Pivots
Pavel Shutovskiy
The indicator calculates intraday levels based on the average daily price range, builds support and resistance levels that may be reversal. Parameters Period ATR - period of the ATR indicator Shift time - time offset for the opening of the day Color opening of day - color of the opening line of the day Color 1AR, -1AS - line color 1AR, -1AS Color AR 1/2, AS -1/2 - line color AR 1/2, AS Color AR 1/4, AS -1/4 - line color AR 1/4, AS -1/4 Color AR 3/4, AS -3/4 - line color AR 3/4, AS -3/4 Color
Filtro:
John Winsome Munar
3471
John Winsome Munar 2022.06.20 06:11 
 

O usuário não deixou nenhum comentário para sua avaliação

Maksym Mudrakov
30049
Maksym Mudrakov 2016.08.31 07:04 
 

O usuário não deixou nenhum comentário para sua avaliação

Richard Jehl
1702
Richard Jehl 2016.07.05 02:04 
 

O usuário não deixou nenhum comentário para sua avaliação

Natalya Gornaeva
29
Natalya Gornaeva 2015.03.03 16:09 
 

O usuário não deixou nenhum comentário para sua avaliação

Responder ao comentário