Gold ADR Daily Range Meter MT4

How much room does gold have left today? This indicator shows the average daily range (ADR) of XAUUSD, how much of it today has already used, where today's ADR high and ADR low are, and how often past days that got this far went on to the full range.

Gold ADR Daily Range Meter draws today's ADR high and ADR low on the chart, fills a bar as the day uses its range and alerts you when the day has used its full ADR. A table counts on your own daily history what usually happens next: once a day had used 50%, 75%, 100% or 125% of its ADR, how often did it go on to 100%, 125% and 150%? Made for gold, works on any symbol. Free.

MT5 version (free)

What gold did (1,000 days of XAUUSD since December 2022, broker data)

  • Half of all days stayed under 92% of their ADR
  • 41% of days reached their full ADR
  • Once a day had used 75% of its ADR, it went on to 100% on 59% of days and to 125% on 33%
  • Once a day had used its full ADR, it went on to 125% on 55% of days

Your broker's history gives your own numbers: the table counts them on your chart.

What it draws

  • ADR high = today's low + ADR, ADR low = today's high - ADR. Before the day has used its full ADR they show how far price can still go up or down on an average day
  • Once the day has used its full ADR the two lines stop moving and mark the full-range box (low + ADR when the up move got there first, high - ADR when the down move did). Price beyond the box is extension
  • The day's open (dotted)
  • The same lines for the last 5 days, dotted, so you see how past days used their range

The panel

  • ADR in dollars for gold and silver, pips for forex, price units for indices and crypto
  • Today's range and the share of the ADR it has used, with a bar that marks 100%
  • Room up to the ADR high and down to the ADR low from the current price
  • The live odds line for today's exact share, e.g. "Of 700 past days that got to 75%, 59% went on to 100%" (it looks at the next step above today's share: 100%, 125%, 150% or 200%)
  • The previous day's range and this week's range against the 10-week average

The history table

  • Rows: the day's range reached 50%, 75%, 100% or 125% of its ADR
  • Columns: how many days got there, and the share of them that went on to 100%, 125% and 150%
  • Today's row is highlighted
  • Under the table: the median day (in % of ADR) and the share of days that reach their full ADR

The numbers are plain counts of your broker's daily candles: every day's range against the average range of the 20 days before it. Nothing is fitted or optimised.

Alerts

  • When today's range has used 100% of the ADR (or any share you set, 0 = off), once per day
  • Popup, sound, push to the MetaTrader app on your phone, e-mail

How to use it

  • Put it on any chart from M1 to D1: the daily numbers are the same on every timeframe
  • Before a trade: is there still room to the target, or has gold already used most of its usual day?
  • Take-profit and stop distances: compare them with the ADR and the room left
  • Afternoon breakouts after a full-ADR morning: the table shows how often such days really extended
  • Sunday candles of brokers on GMT count with Monday; markets that trade every day (crypto) keep every day

Limitations

  • A day here is your broker's day (server time). Brokers with another time zone cut days differently, so their numbers differ a little
  • The lines are fixed by candle highs and lows; inside one candle the order of moves is unknown
  • Past behaviour does not guarantee future behaviour. This is a measuring tool, not a trading signal

Inputs

  • ADR: average of the last 20 days; weekly range: average of the last 10 weeks (0 = off)
  • Lines: days to draw (5), colours, day open on/off, line names on/off
  • Alert: share of ADR (100%, 0 = off); popup, sound, push, e-mail
  • Panel and table on/off, corners, days for the table (1,000), font size

Support: if something doesn't work as expected, send me a private message first. I answer every message and fix problems quickly.

Produtos recomendados
Bitcoin 999
Ahmed Ragab Ramadan Abdelfattah
Bitcoin 999  - is a trend indicator that automatically analyzes the market and provides information about the trend and each of its changes, as well as giving signals for entering trades without redrawing! The indicator uses each candle, analyzing them separately. referring to different impulses - up or down impulse. Exact entry points into transactions for currencies, crypto, metals, stocks, indices!  Main functions: Accurate entry signals WITHOUT REPAINTING! Once a signal appears, it remains
FREE
Blahtech VWAP
Blahtech Limited
5 (3)
Blahtech VWAP - Volume Weighted Average Price (VWAP) is the ratio of price to total volume. It provides an average price over a specified time interval.  Links [  Install  |  Update  |  Documentation   ] Feature Highlights Configurable VWAP Line Sessions, intervals, anchored or continuous Previous day settlement line Standard Deviation bands Alerts at bar close or real time Automatic Broker or Tick volumes Significantly reduced CPU usage Input Parameters Expert Advisor Mode  - Reserved for iC
FREE
Follow The Line
Oliver Gideon Amofa Appiah
3.94 (16)
FOLLOW THE LINE GET THE FULL VERSION HERE: https://www.mql5.com/en/market/product/36024 This indicator obeys the popular maxim that: "THE TREND IS YOUR FRIEND" It paints a GREEN line for BUY and also paints a RED line for SELL.  It gives alarms and alerts of all kinds. IT DOES NOT REPAINT and can be used for all currency pairs and timeframes. Yes, as easy and simple as that. Even a newbie can use it to make great and reliable trades. NB: For best results, get my other premium indicators for more
FREE
Email Drawdown Alert
Roman Starostin
5 (12)
Free informative Indicator-helper. It'll be usefull for traders who trade many symbols or using grid systems (Averaging or Martingale). Indicator counts drawdown as percent and currency separate. It has a number of settings: Count deposite drawdown according equity value and send e-mail or notifications to user if DD more than set; Sending e-mail when max open orders reached; Shows price and remaining pips amount before MarginCall on current chart and Account generally; Display summary trade lot
FREE
Toms Dashboard
Thomas Alexander Kevin Anderson
Dynamic Trading Dashboard for MT4 This powerful MT4 trading dashboard offers traders a comprehensive view of current and historical trading performance in an intuitive and visually organized format. With its precision-engineered design, the dashboard provides a seamless blend of real-time insights and historical analysis.  This trading dashboard is perfect for meticulous traders who seek a precise, all-encompassing tool to manage open and closed positions while gaining insights into past perform
FREE
Wave Reversal Indicator
Vitalyi Belyh
4.33 (3)
Wave Reversal Indicator - determina a direção e as reversões de preço em torno da linha de equilíbrio. O indicador mostra os movimentos das ondas e os picos de tendência. Dá recomendações sobre onde seguir o trader, ajuda a seguir a estratégia de trading. É um complemento a uma estratégia intradiária ou de médio prazo. Quase todos os parâmetros são selecionados para cada intervalo de tempo e mudam automaticamente; Prazos ideais para utilizar M5, M15, M30, H1, H4. Funciona em vários instrumentos
FREE
SuperTrend V
Muhammad Hassaan
*This is TradingView indicator converted to mql4* The SuperTrend V indicator is a popular technical analysis tool used to identify trends and potential trend reversals in financial markets. It is based on the concept of the SuperTrend indicator but incorporates additional features and variations. The SuperTrend V indicator uses a combination of price action and volatility to determine the trend direction and generate trading signals. Here are the key components and features of the indicator: Ca
FREE
Arlene Sessions Background is an indicator that draws colored vertical background on the chart depending on your session. You can see the version 1 here: https://www.mql5.com/en/market/product/68822 You can see more of my publications here: https://www.mql5.com/en/users/joaquinmetayer/seller If you only want to paint a session on your chart, you must set the color "none" to deactivate it.
FREE
Smart RSI MT4
Mostafa Saad Saeed Shawara
Título do produto Smart RSI (MT4) – parte da série SmartView Descrição breve Indicador RSI com experiência de usuário única na plataforma MetaTrader. Oferece capacidades avançadas não disponíveis anteriormente, como abrir configurações com duplo clique, ocultar e mostrar indicadores sem excluí-los, e exibir a janela do indicador em tamanho completo do gráfico. Projetado para funcionar perfeitamente com o restante da série SmartView Indicators. Visão geral A série SmartView oferece uma experiênci
FREE
Free automatic Fibonacci is an indicator that automatically plots a Fibonacci retracement based on the number of bars you select on the BarsToScan setting in the indicator. The Fibonacci is automatically updated in real time as new highest and lowest values appears amongst the selected bars. You can select which level values to be displayed in the indicator settings. You can also select the color of the levels thus enabling the trader to be able to attach the indicator several times with differe
FREE
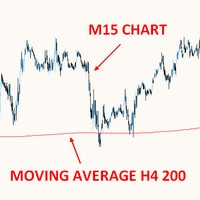
THIS FREE INDICATOR ALLOWS YOU TO SET THE TIMEFRAME OF THE MA YOU WANT ON YOUR CHART For example, it's very useful if you want to trade the H4 200 SMA using a lower timeframe chart, to identify price reactions such as reversals, Wyckoff schematics, etc. ***Please comment, rate and share it to your friends if you like it*** ------------------------------------------------------------------------- Moving averages are popular technical indicators used to identify trends, support and resistance leve
FREE
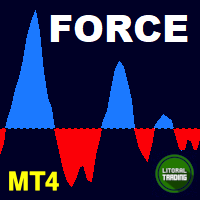
Para quem gosta de tendencia Force será um indicador muito útil. Isso por que ele é baseado no famoso ADX, que mede a força de uma tendencia, porém sem as 3 linhas confusas dele. Force tem sua interpretação muito simples: se o histograma estiver acima do nível zero a tendência é de alta, do contrário é queda. Você pode utilizá-lo para encontrar divergências também, algo muito lucrativo. Se tiver alguma dúvida ou sugestão, por favor, me contate. Faça bom uso! Versão para o MT5:  https://www.mql5
FREE
Stochastic Rsi Alert
Biswarup Banerjee
3 (1)
Apresentando o Stoch RSI MT4, um indicador de negociação inovador projetado para aprimorar suas estratégias de negociação, combinando as forças do oscilador Stochastic com o Índice de Força Relativa (RSI). Ideal tanto para traders novatos quanto experientes, esta ferramenta fornece insights críticos sobre o momento do mercado e reversões de tendência. Com o Stoch RSI MT4, você pode tomar decisões de negociação bem informadas, identificando pontos de entrada e saída ideais. Este indicador oferece
FREE
HMA Trend
Pavel Zamoshnikov
4.56 (72)
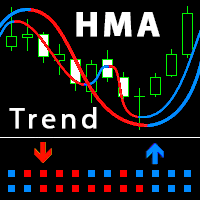
A trend indicator based on the Hull Moving Average (HMA) with two periods. The Hull Moving Average is an improved variant of the moving average, which shows the moment of trend reversal quite accurately. It is often used as a signal filter. Combination of two types of Hull Moving Averages makes a better use of these advantages: HMA with a slow period identifies the trend, while HMA with a fast period determines the short-term movements and signals in the trend direction. Features The movement d

FREE
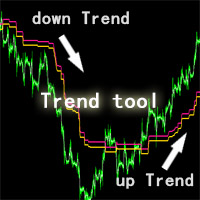
Esta ferramenta ZhiBiQuShi é adequada para todas as variedades e é adequada por mais de 5 minutos. É uma boa ferramenta para julgar tendências! O preço é uma tendência de queda abaixo das duas linhas, e o preço é uma tendência ascendente acima das duas linhas. DESCRIÇÃO DAS CONFIGURAÇÕES till_breakeven_rate: Determina com que proximidade o canal seguirá o preço até que a negociação se estabilize. RECOMENDAR 1 space1: Determina a largura do canal desde o início de uma negociação até que o
FREE
Traditional MACD MT4
Daniel Lewis
4.59 (56)
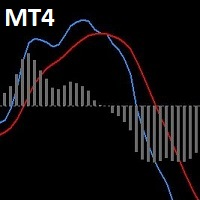
Indicador MACD em MetaTrader 4/5 parece diferente do que o MACD faz na maioria dos outros softwares gráficos. Isso é porque a versão MetaTrader 4/5 de MACD mostra a linha MACD como um histograma quando é tradicionalmente apresentado como uma linha. Além disso, a versão MetaTrader 4/5 calcula a linha de sinal usando uma SMA, no entanto de acordo com a definição, o indicador MACD supostamente é calculado com uma EMA. A versão MetaTrader 4/5 também não computa um verdadeiro Histograma MACD (a difer
FREE
The Sextet
Naim El Hajj
4 (3)
Overview The Sextet is an MT4 trend-alignment indicator based on a sequence of six moving-average levels. Each level is calculated from the previous one, creating a layered view of trend structure. The indicator marks conditions where the moving-average levels align in order, which can help traders observe trend direction and trend organization more clearly. Key Features Displays six moving-average levels. Uses a layered moving-average sequence. Helps visualize trend alignment and directional st
FREE
This indicator collects and organizes spread data. It is an organic add-on to my news robot, ExpertNews , which can be downloaded here . You can also watch a video about news trading using the ExpertNews robot. It is available on youtube . Unfortunately, it is not possible to place the robot in the mql5.com store, because the automatic validation of ExpertNews by the mql5 service ends in failure. In reality, there are no errors in the robot. Testing fails due to the fact that the advisor is
FREE
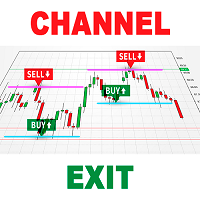
As you know, the price always moves in a certain channel and when the price goes out of the channel, it always tends to return back to the trading channel The Ind Channel Exit indicator will help you not to miss the price going out of the channel It can show an alert or send a message to the terminal on your smartphone that the next bar has closed above or below the channel levels It has a minimum number of settings and the main parameter is the Channel Multiplier , which determines the width o
FREE
Multi-TF MA Levels plots a single moving average across multiple timeframes directly on your chart, giving you instant context at every level of the market. No switching charts. No mental maths. Just clean, flat lines showing exactly where the MA sits on M15, M30, H1, H4 and D1 — all updated on confirmed bar close so there is no repainting. Features Plots the local timeframe MA plus up to 5 higher timeframe MAs simultaneously HTF lines only update on confirmed bar close — no repainting Higher ti
FREE
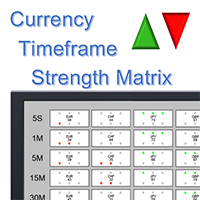
Note: this product is a free limited version of the full featured product Currency Timeframe Strength Matrix . It only includes AUD, CAD, CHF currencies instead of all 8 currencies. It includes only 5S, 1M, 5M time frames instead of all 8 (5S, 1M, 5M, 15M, 30M, 1H, 4H, 1D). What is it? The Currency TimeFrame Strength Matrix is a simple and comprehensive Forex map that gives a snapshot of what is happening in the Forex market at the very present time. It illustrates the strength and momentum ch
FREE
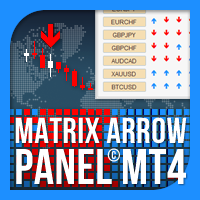
O Matrix Arrow Indicator Multi Timeframe Panel MT4 é um complemento gratuito e um grande trunfo para o seu Matrix Arrow Indicator MT4 . Ele mostra o sinal atual do Matrix Arrow Indicator MT4 para 5 intervalos de tempo personalizados pelo usuário e para 16 símbolos / instrumentos modificáveis ​​no total. O usuário tem a opção de habilitar / desabilitar qualquer um dos 10 indicadores padrão, que compõem o Indicador de Seta de Matriz MT4 . Todos os atributos dos 10 indicadores padrão também são aj
FREE
This indicator will turn the colors of your candles into a trend oriented colored showing 4 different colors based on two moving averages and the slope of the slow moving average. very powerful indicator for all periods of time showing you the direction of the trend to confirm your trades. Green: Bullish Dark Green: Bullish Weak Light red: Bearish Weak Red: Bearish  For more info: https://linktr.ee/trader_1st
FREE
Multi ATR
Mr Ittiphol Pudkrajang
5 (1)
Simple dashboard to view ATR value across multiple time frame, no need to click at any timeframe, we can see the overview of ATR quicker. Support changing value of ATR period. Download free! We already tested via Strategy Tester, nothing wrong. If you found something wrong just drop the comment below or contact me at site: https://youtube.com/@itwetrade Email: itwetrade@gmail.com --------------------------- Support for development: https://www.buymeacoffee.com/itwetrade
FREE
Discover the power of precision and efficiency in your trading with the " Super Auto Fibonacci " MT4 indicator. This cutting-edge tool is meticulously designed to enhance your technical analysis, providing you with invaluable insights to make informed trading decisions. Key Features: Automated Fibonacci Analysis: Say goodbye to the hassle of manual Fibonacci retracement and extension drawing. "Super Auto Fibonacci" instantly identifies and plots Fibonacci levels on your MT4 chart, saving you tim
FREE
Zigzag Extremum points
Oleg Popov
4.82 (33)
New version 8.00 is available. In this version, I tried to take into account the wishes of the user. Each of you can also take part in the improvement of this advisor. In the default settings, the adviser opens trades when the extremum point is broken       standard indicator       Zigzag. When the upper point of the zigzag extremum is broken, it opens a buy deal, and when the lower point of the zigzag extremum is broken, it opens a sell deal. In addition to the standard ZigZag indicator, which
FREE
Donchian channels are a tool in technical analysis used to determine the relative volatility of a market and the potential for price breakouts. Can help identify potential breakouts and reversals in price, which are the moments when traders are called on to make strategic decisions. These strategies can help you capitalize on price trends while having pre-defined entry and exit points to secure gains or limit losses. Using the Donchian channel can thus be part of a disciplined approach to managi
FREE
Velvet RVI
Kevin Peter Abate
Velvet RVI is intended for use with the Velvet advanced ordering layer.  It is based on the algorithm for the Relative Vigor Index, provided by Investopedia here . All of the data it displays is accurate and verified against the internal API function iRVI, when it is detected by the ordering layer.  In order to place orders with the Velvet RVI indicator, the ordering layer must be installed and running.  Ordering from the Velvet RVI indicator requires that "Velvet Ordering Layer" ( found here ),
FREE
FFx RVI
Eric Venturi-Bloxs
5 (1)
The purpose of this new version of the MT4 standard indicator provided in your platform is to display in a sub-window multiple timeframes of the same indicator. See the example shown in the picture below. But the display isn’t like a simple MTF indicator. This is the real display of the indicator on its timeframe. Here's the options available in the FFx indicator: Select the timeframes to be displayed (M1 to Monthly) Define the width (number of bars) for each timeframe box Alert pop up/sound/ema
FREE
A ratio between 0 and 1 with the higher values representing a more efficient or trending market,  It is used in the calculation of Perry J. Kaufman Adaptive Moving Average (KAMA), dividing the price change over a period by the absolute sum of the price movements that occurred to achieve that change. The Fractal Efficiency or also known as Efficiency Ratio was first published by Perry J. Kaufman in his book ‘Smarter Trading‘. This is mostly considered a filter for volatile markets none the less
FREE
Os compradores deste produto também adquirem
Trend SniperX MT4
Sarvarbek Abduvoxobov
5 (5)
Trend Sniper X é um indicador de tendência multitemporal para MetaTrader 5 que ajuda os traders a identificar a direção da tendência e potenciais pontos de reversão com clareza e precisão. Para MT5: https://www.mql5.com/en/market/product/181101 Informação de preço: O preço atual é promocional e está sujeito a alterações à medida que novas atualizações e recursos forem lançados. Canal Code2Profit Domine o Mercado com Análise Multitemporal! Como Maximizar sua Taxa de Acerto com o Trend Sniper X: R
Scalper Vault
Oleg Rodin
5 (40)
O Scalper Vault é um sistema de negociação poderoso e completo, projetado para traders que buscam consistência em operações intraday. Este indicador de alta precisão funciona como um sistema de negociação autônomo, oferecendo análises de nível institucional tanto para o mercado Forex quanto para Opções Binárias. ENTRE EM CONTATO COMIGO APÓS A COMPRA PARA RECEBER DICAS DE NEGOCIAÇÃO E UM BÔNUS EXCLUSIVO! Ao eliminar suposições e análises manuais complexas, o Scalper Vault permite que você foque
Zoryk Gold mt4
Reda El Koutbane
5 (3)
O desconto termina em 24 horas — próximo preço $ 69 ZORYK — Sistema avançado de sinais e planejamento para XAUUSD no MetaTrader 4 Você conhece essa sensação. Você analisa o ouro, espera pela entrada e finalmente abre a operação. O preço começa a se mover contra você. Você fecha cedo demais, altera o Stop Loss ou hesita por alguns segundos. Logo depois, o mercado segue exatamente na direção que você esperava, mas sem você na operação. O problema nem sempre era a direção. O verdadeiro problem
Atomic Analyst
Issam Kassas
5 (14)
Atomic Analyst — MetaTrader 4 Para dúvidas sobre o produto, orientação de configuração ou suporte técnico, envie-me uma mensagem diretamente aqui no MQL5. O indicador transforma cálculos complexos do mercado em sinais visuais simples, candles coloridos, leituras de tendência, níveis de stop loss e várias zonas de take profit que os traders podem entender rapidamente e usar em condições reais de mercado. Principais usos de trading: Scalping e day trade: Desenvolvido para tomada de decisão rápida
M1 Sniper
Oleg Rodin
4.97 (30)
O M1 SNIPER é um sistema indicador de negociação fácil de usar. É um indicador de seta projetado para o período M1. O indicador pode ser usado como um sistema independente para scalping no período M1 e pode ser usado como parte do seu sistema de negociação existente. Embora este sistema de negociação tenha sido projetado especificamente para negociação no M1, ele também pode ser usado em outros períodos. Originalmente, desenvolvi este método para negociar XAUUSD e BTCUSD. Mas considero-o útil ta
O sistema PRO Renko é um sistema de negociação altamente preciso especialmente concebido para a negociação de gráficos RENKO. Trata-se de um sistema universal que pode ser aplicado a vários instrumentos de negociação. O sistema neutraliza eficazmente o chamado ruído de mercado, dando-lhe acesso a sinais de inversão precisos. O indicador é muito fácil de usar e tem apenas um parâmetro responsável pela geração de sinal. Você pode facilmente adaptar a ferramenta a qualquer instrumento de negocia
Currency Strength Wizard é um indicador muito poderoso que fornece uma solução completa para uma negociação bem-sucedida. O indicador calcula o poder deste ou daquele par forex usando os dados de todas as moedas em vários intervalos de tempo. Esses dados são representados em uma forma de índice de moeda fácil de usar e linhas de energia de moeda que você pode usar para ver o poder desta ou daquela moeda. Tudo o que você precisa é anexar o indicador ao gráfico que deseja negociar e o indicador mo
Smart Trend Trading System é um indicador para MetaTrader 4 que reúne informações de tendência, sinais de entrada e saída e níveis de preço em um único gráfico. Ele combina mais de 10 ferramentas de trading em um único sistema, incluindo detecção de tendência, zonas de reversão, Smart Cloud, lógica de trailing stop, suporte e resistência, coloração de candles, alertas e análise multi-timeframe. O sistema foi desenvolvido para ajudar você a operar diferentes condições de mercado: Mercados em tend
Tokyo mt4 Indicator
Vasiliy Strukov
5 (9)
O Tokyo Indicator oferece uma visão geral visual e clara da direção da tendência, de possíveis sinais de negociação e das condições de mercado. Sua linha de tendência em degraus e codificada por cores diferencia as fases de alta (em azul) das fases de baixa (em magenta). Setas direcionais correspondentes destacam possíveis oportunidades de compra e venda quando a tendência exibida muda. Um painel integrado reúne o sinal atual, a tendência do mercado (viés), o momentum, a volatilidade e a qualid
Neuro Poseidon MT4
Daria Rezueva
4.74 (46)
Neuro Poseidon is a new indicator by Daria Rezueva. It combines precise trading signals with adaptive TP/SL levels - creating best possible trades as a result! Message me and get  Neuro Poseidon Assistant  as a gift to automize your trading process! What makes it stand out? 1. Proven profitability on all assets and timeframes 2. Only confirmed BUY and SELL signals present on the chart 3. Adaptive TP & SL levels generated by the software for each trade 4. Easy to understand - suitable for all
Gann Made Easy
Oleg Rodin
4.84 (173)
Gann Made Easy é um sistema de negociação Forex profissional e fácil de usar, baseado nos melhores princípios de negociação usando a teoria do sr. W. D. Gann. O indicador fornece sinais precisos de COMPRA e VENDA, incluindo níveis de Stop Loss e Take Profit. Você pode negociar mesmo em movimento usando notificações PUSH. Entre em contato comigo após a compra para receber instruções de negociação e ótimos indicadores extras gratuitamente! Provavelmente você já ouviu muitas vezes sobre os métodos
Liquidity Scalper System: um sistema de trading baseado em liquidez no formato de indicador. A maioria dos indicadores mostra apenas uma seta, e depois o trader decide sozinho onde colocar o stop, onde está o alvo e se pode confiar no sinal. O Liquidity Scalper System cobre todo o ciclo da operação: encontra pools de liquidez, dá um sinal no seu rompimento, calcula imediatamente Entry, Stop Loss e três alvos, e mostra no painel as estatísticas e os resultados da validação em dados novos. O sist
SR Liquidity
Oleg Rodin
5 (2)
O SR Liquidity é um indicador de trading projetado para revelar as zonas ocultas onde a liquidez do mercado se concentra e o preço reage com maior intensidade. Essas áreas específicas de liquidez funcionam como níveis poderosos de suporte e resistência, oferecendo um mapa claro de onde é mais provável que o mercado reverta. Em vez de traçar linhas comuns de Suporte e Resistência, o SR Liquidity analisa o comportamento real dos preços para detectar as zonas onde se acumulam pressões de compra e v
AW Prime Oscillator
AW Trading Software Limited
5 (1)
Uma combinação de dois osciladores. O primeiro exibe os pontos de entrada, o segundo mostra a tendência atual. O indicador pode exibir sinais do oscilador por meio de setas em dois modos, todos os sinais do oscilador rápido ou sinais apenas na direção da tendência atual. Possui painel multi-timeframe e três tipos de notificações de sinal. Benefícios: Adequado para negociação diurna e de scalping Filtragem de tendências Configuração simples e sensível Painel multiperíodo Adequado para integração
CRT Candle Range Theory HTF MT4 - Ultimate CRT Indicator: Conceitos Avançados de ICT e Sistema de Negociação SnR Malaio Domine as pegadas dos criadores de mercado com o indicador mais avançado de Candle Range Theory. Desbloqueie o verdadeiro poder dos Smart Money Concepts (SMC) e opere com a precisão das instituições com o Ultimate CRT Indicator. Construído exclusivamente para traders sérios, este indicador automatiza a altamente eficaz Teoria CRT, um pilar central dos Conceitos ICT (Inner Circl
PZ Harmonacci Patterns
PZ TRADING SLU
3.17 (6)
Este é sem dúvida o indicador de reconhecimento automático de formação de preço harmônico mais completo que você pode encontrar para a MetaTrader Platform. Ele detecta 19 padrões diferentes, leva as projeções de Fibonacci tão a sério quanto você, exibe a Zona de Reversão Potencial (PRZ) e encontra níveis adequados de stop loss e take-profit. [ Guia de instalação | Guia de atualização | Solução de problemas | FAQ | Todos os produtos ] Detecta 19 formações harmônicas de preços diferentes Traça
O Top Bottom Tracker é um indicador baseado em algoritmos sofisticados que analisa a tendência do mercado e pode detetar os altos e baixos da tendência / Versão MT5 . O preço aumentará progressivamente até atingir 500$. Próximo preço --> $99 Características Sem repintura Este indicador não altera os seus valores quando chegam novos dados Pares de negociação Todos os pares de forex Timeframe   Todos os timeframes Parâmetros ==== Configuração do indicador ==== Parâmetro de configuração
Cycles Predictor Indicator This indicator uses past market cycles to predict future price movements. The indicator scans through past data and considers  combinations  of cycles. When cycles  coincide  at the same future date/time then it is considered a valid future prediction. The predictions are drawn as vertical lines on the right side of the chart in the future. A prediction will often result in type of candle (ex. bull or bear) and/or a reversal point (ex. bottom or top) forming at this ex
SIO Oscillator: oscilador auto-otimizável de desequilíbrio de semivariância Compre o indicador e receba GRÁTIS o Expert Advisor (EA) baseado nele. A maioria dos osciladores trata todo movimento de preço da mesma forma. O SIO separa a pressão de alta da pressão de baixa e mede o desequilíbrio entre elas, mostrando qual lado realmente controla o mercado: compradores ou vendedores. Quando o desequilíbrio atinge um extremo, o SIO gera um sinal claro com níveis de entrada, Stop Loss e Take Profit. O
Break and Retest Hunter MT4 is a powerful MetaTrader 5 indicator designed to automatically identify support and resistance levels, breakout structures, and potential retest opportunities in real time. Bonus Indicator: After purchasing Break and Retest Hunter , contact me to receive Trade Indicator Assistant EA completely free as a bonus utility. $65 for the next 10 copies . Next price is $120.  Combining adaptive market analysis, clear BUY/SELL signals, Fibonacci-based profit targets, and a pre
Sinal de tendência GoldRush Arrow O indicador Sinal de tendência GoldRush Arrow fornece uma análise precisa e em tempo real das tendências, adaptada para scalpers de alta velocidade e curto prazo em XAU/USD. Criada especificamente para o intervalo de tempo de 1 minuto, esta ferramenta exibe setas direcionais para pontos de entrada claros, permitindo que os scalpers naveguem em condições de mercado voláteis com confiança. O indicador consiste em setas de alerta PRIMÁRIAS e SECUNDÁRIAS. Os sin
ForexTrendMT4
Andriy Sydoruk
5 (1)
ForexTrendMT4 Indicator: A Reliable Tool for Market Tracking The ForexTrendMT4 indicator offers reliable market trend tracking, filtering out sudden fluctuations and market noise. This tool helps identify trends and signals favorable entry points into the market using arrows. It is suitable for both scalping on shorter timeframes and long-term trading strategies. Based on the principles of technical analysis, ForexTrendMT4 takes into account the cyclical nature of the market. Key Features and A
Super Signal – Skyblade Edition Sistema profissional de sinais de tendência sem repintar / sem atraso com taxa de acerto excepcional | Para MT4 / MT5 Funciona melhor em timeframes mais curtos, como 1 minuto, 5 minutos e 15 minutos. Principais características: Super Signal – Skyblade Edition é um sistema inteligente de sinais desenvolvido especificamente para operações com tendência. Utiliza uma lógica de filtragem em múltiplas camadas para detectar apenas movimentos direcionais fortes sustenta
ACTUALMENTE COM 40% DE DESCONTO A melhor solução para qualquer novato ou comerciante especializado! Este Indicador é uma ferramenta comercial única, de alta qualidade e acessível, porque incorporámos uma série de características proprietárias e uma nova fórmula. Com apenas UM gráfico, pode ler a força da moeda para 28 pares de Forex! Imagine como a sua negociação irá melhorar porque é capaz de apontar o ponto exacto do gatilho de uma nova tendência ou oportunidade de escalada? Manual do util
Introducing Volume Orderflow Profile , a versatile tool designed to help traders visualize and understand the dynamics of buying and selling pressure within a specified lookback period. Perfect for those looking to gain deeper insights into volume-based market behavior! MT5 Version -  https://www.mql5.com/en/market/product/122657 The indicator gathers data on high and low prices, along with buy and sell volumes, over a user-defined period. It calculates the maximum and minimum prices during this
Smart Price Action Concepts — MetaTrader 4 Para dúvidas sobre o produto, orientação de configuração ou suporte técnico, envie-me uma mensagem diretamente aqui no MQL5. Recursos: • Smart Money Concepts SMC • Inner Circle Trading ICT • Price Action PA e Institutional Trading IT • Estrutura de mercado em tempo real e swing structure highs and lows (HH HL LL LH) • Order blocks internos e swing de oferta e demanda em tempo real • Premium Equilibrium e Discount Zones • Detecção automática de Fibonacci
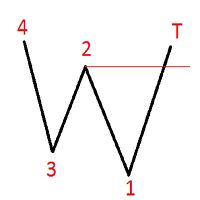
ZigZag Alert   O indicador é baseado no ZigZag padrão. Exibido no gráfico e sinaliza o surgimento de um determinado padrão formado. À escolha do usuário, os sinais indicadores são exibidos no terminal, ou um e-mail para o endereço, ou envia uma notificação para o terminal móvel. Condições padrão para o sinal de movimento ascendente: o preço do ponto 4 deve ser superior ao preço do ponto 2, o preço do ponto T deve ser superior ao preço do ponto 2. Ao descer, ao contrário, ao subir. Descrição das
True Direction Oscillator
Muhammad Elbermawi
4.85 (364)
Ou (TDO) que é um índice que mede a taxa de variação do preço usando o princípio de " Pure Momentum ". Quando o preço de um título avança de 10 para 15, a taxa de variação do preço é 150%, mas quando diminui de 15 para 10, a taxa de variação do preço é apenas 33,3%. É por isso que os indicadores de análise técnica como "Taxa de variação do preço" (ROC) ou "Momentum" fornecem leituras mais altas para movimentos de preços ascendentes do que para os descendentes. O TDO corrige esse problema para aj
Trend Lines PRO
Roman Podpora
5 (2)
LINHAS DE TENDÊNCIA PRO       Ajuda a entender onde o mercado está realmente mudando de direção. O indicador mostra inversões de tendência reais e pontos onde os principais participantes retornam ao mercado. Você vê     Linhas BOS     Análise de tendências e níveis-chave em prazos maiores — sem configurações complexas ou ruídos desnecessários. Os sinais não são repintados e permanecem no gráfico após o fechamento da barra. VERSÃO MT 5      -      Revela seu potencial máximo quando emparelhada co
Actualmente 30% OFF ! A melhor solução para qualquer novato ou comerciante especializado! Este software de painel de instrumentos está a funcionar em 28 pares de moedas. É baseado em 2 dos nossos principais indicadores (Advanced Currency Strength 28 e Advanced Currency Impulse). Dá uma grande visão geral de todo o mercado Forex. Mostra valores avançados de força da moeda, velocidade de movimento da moeda e sinais para 28 pares de divisas em todos os (9) períodos de tempo. Imagine como a sua n
Mais do autor
Where is price in the range - premium, discount or in the OTE zone? This indicator draws it, alerts you, and checks on your own chart what price did next. ICT Premium Discount OTE Honest Stats draws the current dealing range with premium, discount, equilibrium (50%) and the optimal trade entry zone (62-79%), alerts you when price reaches the OTE zone, and measures on that chart's own history how often price then went on with the leg, next to random candles. Free, part of the Honest Stats series.
FREE
Most liquidity indicators draw the lines. This one also checks whether price respects them. ICT Liquidity Levels Honest Stats draws the levels ICT traders watch: previous day high and low, previous week high and low, and the Asian range high and low. A table measures on your own chart how often price reached each level and how often it turned back there, next to random lines nearby. Free, part of the Honest Stats series. MT4 version | ICT Killzones Honest Stats (free) | ICT FVG Honest Stats (fre
FREE
How much room does gold have left today? This indicator shows the average daily range (ADR) of XAUUSD, how much of it today has already used, where today's ADR high and ADR low are, and how often past days that got this far went on to the full range. Gold ADR Daily Range Meter draws today's ADR high and ADR low on the chart, fills a bar as the day uses its range and alerts you when the day has used its full ADR. A table counts on your own daily history what usually happens next: once a day had u
FREE
Most FVG indicators draw boxes. This one also checks whether the boxes work. ICT Fair Value Gap FVG Honest Stats draws every fair value gap on your chart and measures, on that chart's own history, how often price came back to a gap and how often the gap held, next to fake boxes of the same size. Free, part of the Honest Stats series. MT4 version | ICT Killzones Honest Stats (free) | ICT Liquidity Levels Honest Stats (free) | ICT SMT Divergence Honest Stats (free) | TrueRisk Trade Panel (free) NE
FREE
Trade the ICT Silver Bullet hours without watching the clock. This indicator draws the three windows, waits for the liquidity sweep and the first fair value gap after it, alerts you, and checks on your own chart what price did next. ICT Silver Bullet Honest Stats marks the London (03:00-04:00), New York AM (10:00-11:00) and New York PM (14:00-15:00) Silver Bullet windows in New York time, draws the liquidity of the two hours before each window, shows when the window sweeps it, and marks the firs
FREE
See which fair value gaps flipped sides. This indicator marks every inversion fair value gap (IFVG) - a gap that a candle closed straight through - signals and alerts when price comes back to it and respects it, and checks on your own chart what price did next. ICT Inversion Fair Value Gap IFVG Honest Stats finds fair value gaps, waits for a candle to close through one and turns it into an inversion gap on the other side: a bearish gap closed above becomes bullish support, a bullish gap closed b
FREE
Most liquidity indicators draw the lines. This one also checks whether price respects them. ICT Liquidity Levels Honest Stats draws the levels ICT traders watch: previous day high and low, previous week high and low, and the Asian range high and low. A table measures on your own chart how often price reached each level and how often it turned back there, next to random lines nearby. Free, part of the Honest Stats series. MT5 version | ICT Killzones Honest Stats MT4 (free) | ICT FVG Honest Stats
FREE
Order blocks from any timeframe, with alerts - and a table that tells you honestly whether they work on your chart. ICT Order Blocks Honest Stats draws order blocks from this or a higher timeframe, marks each one fresh, tested or broken, alerts you when price comes back to a fresh block, and measures on your chart's own history how often the blocks held next to fake zones of the same size. Free, part of the Honest Stats series. Market Structure MT4 (free) | MT5 version (free) | Free: FVG Honest
FREE
ICT market structure from any timeframe - HH, HL, LH, LL, every BOS and CHoCH, with alerts - and a table that measures how often price really followed each break on your chart. ICT Market Structure Honest Stats labels every swing high and low, draws each break of structure (BOS) and change of character (CHoCH), shows the levels the next break needs, alerts you the moment a new break forms, and measures on your chart's own history how often price went on in the break's direction compared with ran
FREE
Where is price in the range - premium, discount or in the OTE zone? This indicator draws it, alerts you, and checks on your own chart what price did next. ICT Premium Discount OTE Honest Stats draws the current dealing range with premium, discount, equilibrium (50%) and the optimal trade entry zone (62-79%), alerts you when price reaches the OTE zone, and measures on that chart's own history how often price then went on with the leg, next to random candles. Free, part of the Honest Stats series.
FREE
Most SMT indicators mark the divergences. This one also checks whether they work. ICT Correlation SMT Divergence Honest Stats compares your chart with a related market (gold with silver, EURUSD with GBPUSD, BTC with ETH, US500 with US100) and marks every SMT divergence. A table measures on your own chart whether price turned after an SMT more often than after a normal new high or low. Free, part of the Honest Stats series. MT4 version | ICT Killzones Honest Stats (free) | ICT FVG Honest Stats (f
FREE
Order blocks from any timeframe, with alerts - and a table that tells you honestly whether they work on your chart. ICT Order Blocks Honest Stats draws order blocks from this or a higher timeframe, marks each one fresh, tested or broken, alerts you when price comes back to a fresh block, and measures on your chart's own history how often the blocks held next to fake zones of the same size. Free, part of the Honest Stats series. Market Structure (free) | MT4 version (free) | Free: FVG Honest Stat
FREE
Most FVG indicators draw boxes. This one also checks whether the boxes work. ICT Fair Value Gap FVG Honest Stats draws every fair value gap on your chart and measures, on that chart's own history, how often price came back to a gap and how often the gap held, next to fake boxes of the same size. Free, part of the Honest Stats series. MT5 version | ICT Killzones Honest Stats MT4 (free) | ICT Liquidity Levels Honest Stats MT4 (free) | ICT SMT Divergence Honest Stats MT4 (free) | TrueRisk Trade Pan
FREE
ICT market structure from any timeframe - HH, HL, LH, LL, every BOS and CHoCH, with alerts - and a table that measures how often price really followed each break on your chart. ICT Market Structure Honest Stats labels every swing high and low, draws each break of structure (BOS) and change of character (CHoCH), shows the levels the next break needs, alerts you the moment a new break forms, and measures on your chart's own history how often price went on in the break's direction compared with ran
FREE
Most killzone indicators draw boxes. This one also checks whether the boxes work. ICT Killzones Honest Stats for MetaTrader 4 draws the four ICT killzones (Asia, London open, New York open, London close) and measures on your own chart how often the day's high or low really formed inside each one, next to what pure chance would give, and how often the London Judas swing really reverses. Free, part of the Honest Stats series. MT5 version | ICT FVG Honest Stats MT4 (free) | ICT Liquidity Levels Hon
FREE
See which fair value gaps flipped sides. This indicator marks every inversion fair value gap (IFVG) - a gap that a candle closed straight through - signals and alerts when price comes back to it and respects it, and checks on your own chart what price did next. ICT Inversion Fair Value Gap IFVG Honest Stats finds fair value gaps, waits for a candle to close through one and turns it into an inversion gap on the other side: a bearish gap closed above becomes bullish support, a bullish gap closed b
FREE
Most killzone indicators draw boxes. This one checks whether the boxes work. Asia, London open, New York open and London close drawn automatically A table on your chart measures how often the day's high or low really formed inside each killzone, next to what pure chance would give Free. Check the numbers before you trust any killzone strategy MT4 version (free) | ICT FVG Honest Stats (free) | ICT Liquidity Levels Honest Stats (free) | ICT SMT Divergence Honest Stats (free) | TrueRisk Trade Panel
FREE
Free. One click to switch the chart to another symbol. TrueRisk Symbol Changer puts your symbols on the chart as buttons, each with today's % change in green or red. Click one and the chart switches to it, keeping your timeframe, your template and your other indicators. One row of timeframe buttons (M1 to MN) does the same for the timeframe. No more right-click, Symbols, find, drag. MT4 version (free) | TrueRisk Account Dashboard (free) | TrueRisk Trade Panel (free) | All TrueRisk tools Symbols
FREE
Free. Set your risk, click Buy or Sell, done. TrueRisk Trade Panel works out the lot size for you. Type how much of your account you want to risk (for example 1%), set the stop loss in points or drag it on the chart, and the BUY and SELL buttons already show the right lot. No lot calculator, no guessing, no trade that risks ten times more than you meant. TrueRisk Account Dashboard MT4 (free) | TrueRisk Symbol Changer MT4 (free) | MT5 version | All TrueRisk tools NEW (free): a picture of every tr
FREE
Most SMT indicators mark the divergences. This one also checks whether they work. ICT Correlation SMT Divergence Honest Stats compares your chart with a related market (gold with silver, EURUSD with GBPUSD, BTC with ETH, US500 with US100) and marks every SMT divergence. A table measures on your own chart whether price turned after an SMT more often than after a normal new high or low. Free, part of the Honest Stats series. MT5 version | ICT Killzones Honest Stats MT4 (free) | ICT FVG Honest Stat
FREE
Trade the ICT Silver Bullet hours without watching the clock. This indicator draws the three windows, waits for the liquidity sweep and the first fair value gap after it, alerts you, and checks on your own chart what price did next. ICT Silver Bullet Honest Stats marks the London (03:00-04:00), New York AM (10:00-11:00) and New York PM (14:00-15:00) Silver Bullet windows in New York time, draws the liquidity of the two hours before each window, shows when the window sweeps it, and marks the firs
FREE
Free. Set your risk, click Buy or Sell, done. TrueRisk Trade Panel works out the lot size for you. Type how much of your account you want to risk (for example 1%), set the stop loss in points or drag it on the chart, and the BUY and SELL buttons already show the right lot. No lot calculator, no guessing, no trade that risks ten times more than you meant. MT4 version (free) NEW (free): a picture of every trade, saved by itself. TrueRisk Trade Journal saves a chart picture when a trade opens and w
FREE
Manual Copy your trades to every account, MT4 and MT5, each sized to its own risk TrueRisk Trade Copier copies trades between MetaTrader 4 terminals, and between MetaTrader 4 and MetaTrader 5 (with the MT5 version), on the same computer or VPS: from the account you trade to your other accounts, to a prop-firm challenge, or from a personal account to a funded one. Each receiving account sizes every copy to its own risk % from the sender's stop loss, and never lets a copy's stop break that account
Manual TrueRisk Account Guard Pro watches your whole MetaTrader 4 account and steps in before a prop firm's loss limit is breached. On top of the daily and maximum loss limits it caps the loss on each trade, adds missing stop losses, limits how much you trade and closes everything before the weekend. Firm presets: FTMO 2-Step, FTMO 1-Step, FundedNext Stellar 2-Step, The5ers High Stakes, or your own rules Daily reset in the firm's own time zone (Prague, New York, UTC or server time), summer time
Manual TrueRisk Trade Manager is a one-click trading panel for MetaTrader 4. You set your risk in percent and the stop loss; the panel works out the lot size, checks that the stop can't take you past your daily or maximum loss limit, opens the trade and then manages it for you: partial close, break-even and trailing stop. Lot size from your risk %, cut to the room left before your loss limits Partial close, break-even and trailing stop in R, automatically Stop loss and lot size for trades you op
Every ICT idea in one indicator - market structure, order blocks, fair value gaps, premium / discount and OTE, liquidity sweeps, killzones and SMT - added up into one confluence score, with alerts and a multi-symbol scanner. Try it free first: press Free Demo and run it in the Strategy Tester (visual mode) - the panel, zones, signals and scanner all work there. ICT Pro Honest Stats draws all of it on your chart, checks every closed candle against nine ICT factors, shows the bullish and bearish s
Manual A hard daily loss limit for any account: your own money or a prop challenge. Set your daily and maximum loss limit once. Before either is reached it closes every position and locks trading: all symbols, all EAs, manual and phone trades Per-trade loss cap, automatic stop loss, max trades per day, news lock, Friday close: the rules most traders write down and then break Trading a challenge? Pick FTMO, FundedNext or The5ers and the limits load the way that firm counts them, with the right re
Manual Risk-based lot size, stop and target in one click. On any account. Set your stop, click Buy or Sell: the lot comes from your risk %. On an account with loss limits it is also cut to the room left before your daily and maximum loss limit. Ordinary trade panels only do the first part Partial close, break-even and trailing stop then run by themselves Trades opened on your phone get a stop loss and are cut to your risk % by the desktop manager (MT5 mobile has no lot calculator) Account protec
Manual Copy your trades to every account, each sized to its own risk TrueRisk Trade Copier copies trades between MetaTrader 5 terminals on the same computer or VPS: from the account you trade to your other accounts, to a prop-firm challenge, or from a personal account to a funded one. Each receiving account sizes every copy to its own risk % from the sender's stop loss, and never lets a copy's stop break that account's daily or maximum loss limit. MT4 version | TrueRisk Account Guard Pro (the gu
Every ICT idea in one indicator - market structure, order blocks, fair value gaps, premium / discount and OTE, liquidity sweeps, killzones and SMT - added up into one confluence score, with alerts and a multi-symbol scanner. Try it free first: press Free Demo and run it in the Strategy Tester (visual mode) - the panel, zones, signals and scanner all work there. ICT Pro Honest Stats draws all of it on your chart, checks every closed candle against nine ICT factors, shows the bullish and bearish s
Filtro:
Sem comentários
Responder ao comentário