Gold ADR Daily Range Meter MT4

How much room does gold have left today? This indicator shows the average daily range (ADR) of XAUUSD, how much of it today has already used, where today's ADR high and ADR low are, and how often past days that got this far went on to the full range.

Gold ADR Daily Range Meter draws today's ADR high and ADR low on the chart, fills a bar as the day uses its range and alerts you when the day has used its full ADR. A table counts on your own daily history what usually happens next: once a day had used 50%, 75%, 100% or 125% of its ADR, how often did it go on to 100%, 125% and 150%? Made for gold, works on any symbol. Free.

MT5 version (free)

What gold did (1,000 days of XAUUSD since December 2022, broker data)

  • Half of all days stayed under 92% of their ADR
  • 41% of days reached their full ADR
  • Once a day had used 75% of its ADR, it went on to 100% on 59% of days and to 125% on 33%
  • Once a day had used its full ADR, it went on to 125% on 55% of days

Your broker's history gives your own numbers: the table counts them on your chart.

What it draws

  • ADR high = today's low + ADR, ADR low = today's high - ADR. Before the day has used its full ADR they show how far price can still go up or down on an average day
  • Once the day has used its full ADR the two lines stop moving and mark the full-range box (low + ADR when the up move got there first, high - ADR when the down move did). Price beyond the box is extension
  • The day's open (dotted)
  • The same lines for the last 5 days, dotted, so you see how past days used their range

The panel

  • ADR in dollars for gold and silver, pips for forex, price units for indices and crypto
  • Today's range and the share of the ADR it has used, with a bar that marks 100%
  • Room up to the ADR high and down to the ADR low from the current price
  • The live odds line for today's exact share, e.g. "Of 700 past days that got to 75%, 59% went on to 100%" (it looks at the next step above today's share: 100%, 125%, 150% or 200%)
  • The previous day's range and this week's range against the 10-week average

The history table

  • Rows: the day's range reached 50%, 75%, 100% or 125% of its ADR
  • Columns: how many days got there, and the share of them that went on to 100%, 125% and 150%
  • Today's row is highlighted
  • Under the table: the median day (in % of ADR) and the share of days that reach their full ADR

The numbers are plain counts of your broker's daily candles: every day's range against the average range of the 20 days before it. Nothing is fitted or optimised.

Alerts

  • When today's range has used 100% of the ADR (or any share you set, 0 = off), once per day
  • Popup, sound, push to the MetaTrader app on your phone, e-mail

How to use it

  • Put it on any chart from M1 to D1: the daily numbers are the same on every timeframe
  • Before a trade: is there still room to the target, or has gold already used most of its usual day?
  • Take-profit and stop distances: compare them with the ADR and the room left
  • Afternoon breakouts after a full-ADR morning: the table shows how often such days really extended
  • Sunday candles of brokers on GMT count with Monday; markets that trade every day (crypto) keep every day

Limitations

  • A day here is your broker's day (server time). Brokers with another time zone cut days differently, so their numbers differ a little
  • The lines are fixed by candle highs and lows; inside one candle the order of moves is unknown
  • Past behaviour does not guarantee future behaviour. This is a measuring tool, not a trading signal

Inputs

  • ADR: average of the last 20 days; weekly range: average of the last 10 weeks (0 = off)
  • Lines: days to draw (5), colours, day open on/off, line names on/off
  • Alert: share of ADR (100%, 0 = off); popup, sound, push, e-mail
  • Panel and table on/off, corners, days for the table (1,000), font size

Support: if something doesn't work as expected, send me a private message first. I answer every message and fix problems quickly.

Prodotti consigliati
Bitcoin 999
Ahmed Ragab Ramadan Abdelfattah
Bitcoin 999  - is a trend indicator that automatically analyzes the market and provides information about the trend and each of its changes, as well as giving signals for entering trades without redrawing! The indicator uses each candle, analyzing them separately. referring to different impulses - up or down impulse. Exact entry points into transactions for currencies, crypto, metals, stocks, indices!  Main functions: Accurate entry signals WITHOUT REPAINTING! Once a signal appears, it remains
FREE
Blahtech VWAP
Blahtech Limited
5 (3)
Blahtech VWAP - Volume Weighted Average Price (VWAP) is the ratio of price to total volume. It provides an average price over a specified time interval.  Links [  Install  |  Update  |  Documentation   ] Feature Highlights Configurable VWAP Line Sessions, intervals, anchored or continuous Previous day settlement line Standard Deviation bands Alerts at bar close or real time Automatic Broker or Tick volumes Significantly reduced CPU usage Input Parameters Expert Advisor Mode  - Reserved for iC
FREE
Follow The Line
Oliver Gideon Amofa Appiah
3.94 (16)
FOLLOW THE LINE GET THE FULL VERSION HERE: https://www.mql5.com/en/market/product/36024 This indicator obeys the popular maxim that: "THE TREND IS YOUR FRIEND" It paints a GREEN line for BUY and also paints a RED line for SELL.  It gives alarms and alerts of all kinds. IT DOES NOT REPAINT and can be used for all currency pairs and timeframes. Yes, as easy and simple as that. Even a newbie can use it to make great and reliable trades. NB: For best results, get my other premium indicators for more
FREE
Email Drawdown Alert
Roman Starostin
5 (12)
Free informative Indicator-helper. It'll be usefull for traders who trade many symbols or using grid systems (Averaging or Martingale). Indicator counts drawdown as percent and currency separate. It has a number of settings: Count deposite drawdown according equity value and send e-mail or notifications to user if DD more than set; Sending e-mail when max open orders reached; Shows price and remaining pips amount before MarginCall on current chart and Account generally; Display summary trade lot
FREE
Toms Dashboard
Thomas Alexander Kevin Anderson
Dynamic Trading Dashboard for MT4 This powerful MT4 trading dashboard offers traders a comprehensive view of current and historical trading performance in an intuitive and visually organized format. With its precision-engineered design, the dashboard provides a seamless blend of real-time insights and historical analysis.  This trading dashboard is perfect for meticulous traders who seek a precise, all-encompassing tool to manage open and closed positions while gaining insights into past perform
FREE
Wave Reversal Indicator
Vitalyi Belyh
4.33 (3)
Wave Reversal Indicator - determina la direzione e le inversioni di prezzo attorno alla linea di equilibrio. L'indicatore mostra i movimenti delle onde e i picchi di tendenza. Dà consigli su dove seguire il trader, aiuta a seguire la strategia di trading. È un'aggiunta a una strategia intraday o a medio termine. Quasi tutti i parametri vengono selezionati per ciascun intervallo di tempo e cambiano automaticamente; l'unico parametro per la regolazione manuale è la lunghezza d'onda. Tempi ottimal
FREE
SuperTrend V
Muhammad Hassaan
*This is TradingView indicator converted to mql4* The SuperTrend V indicator is a popular technical analysis tool used to identify trends and potential trend reversals in financial markets. It is based on the concept of the SuperTrend indicator but incorporates additional features and variations. The SuperTrend V indicator uses a combination of price action and volatility to determine the trend direction and generate trading signals. Here are the key components and features of the indicator: Ca
FREE
Arlene Sessions Background is an indicator that draws colored vertical background on the chart depending on your session. You can see the version 1 here: https://www.mql5.com/en/market/product/68822 You can see more of my publications here: https://www.mql5.com/en/users/joaquinmetayer/seller If you only want to paint a session on your chart, you must set the color "none" to deactivate it.
FREE
Smart RSI MT4
Mostafa Saad Saeed Shawara
Titolo del prodotto Smart RSI (MT4) – parte della serie SmartView Indicators Descrizione breve Indicatore RSI con un'esperienza utente unica sulla piattaforma MetaTrader. Offre capacità avanzate non disponibili in precedenza, come aprire le impostazioni con doppio clic, nascondere e mostrare gli indicatori senza eliminarli, e visualizzare la finestra dell'indicatore a dimensione intera del grafico. Progettato per funzionare perfettamente con il resto della serie SmartView Indicators. Panoramica
FREE
Free automatic Fibonacci is an indicator that automatically plots a Fibonacci retracement based on the number of bars you select on the BarsToScan setting in the indicator. The Fibonacci is automatically updated in real time as new highest and lowest values appears amongst the selected bars. You can select which level values to be displayed in the indicator settings. You can also select the color of the levels thus enabling the trader to be able to attach the indicator several times with differe
FREE
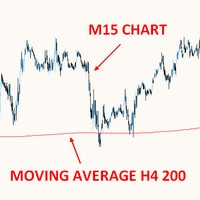
THIS FREE INDICATOR ALLOWS YOU TO SET THE TIMEFRAME OF THE MA YOU WANT ON YOUR CHART For example, it's very useful if you want to trade the H4 200 SMA using a lower timeframe chart, to identify price reactions such as reversals, Wyckoff schematics, etc. ***Please comment, rate and share it to your friends if you like it*** ------------------------------------------------------------------------- Moving averages are popular technical indicators used to identify trends, support and resistance leve
FREE
For those who like trend the Force will be a very useful indicator. This is because it is based on the famouse ADX, which measure the strenght of a trend, but without its 3 confusing lines. Force has its very simple interpretation: if the histogram is above zero level the trend is up, otherwise it is down. You can use it to find divergences too, which is very profitable. If you have any doubt or suggestion, please, contact me. Enjoy! MT5 version:  https://www.mql5.com/en/market/product/41928 T
FREE
Stochastic Rsi Alert
Biswarup Banerjee
3 (1)
Presentiamo il Stoch RSI MT4, un indicatore di trading innovativo progettato per migliorare le tue strategie di trading combinando i punti di forza dell'oscillatore Stochastic con l'Indice di Forza Relativa (RSI). Ideale sia per i trader principianti che per quelli esperti, questo strumento fornisce informazioni critiche sul momentum di mercato e sui cambiamenti di tendenza. Con il Stoch RSI MT4, puoi prendere decisioni di trading ben informate identificando i punti di ingresso e uscita ottimali
FREE
HMA Trend
Pavel Zamoshnikov
4.56 (72)
A trend indicator based on the Hull Moving Average (HMA) with two periods. The Hull Moving Average is an improved variant of the moving average, which shows the moment of trend reversal quite accurately. It is often used as a signal filter. Combination of two types of Hull Moving Averages makes a better use of these advantages: HMA with a slow period identifies the trend, while HMA with a fast period determines the short-term movements and signals in the trend direction. Features The movement d

FREE
This ZhiBiQuShi tool is suitable for all varieties and is suitable for more than 5 minutes. It is a good tool for judging trends! The price is a downward trend below the two lines, and the price is an upward trend above the two lines. DESCRIPTION OF SETTINGS till_breakeven_rate : Determines how closely the channel will follow the price till the trade breaks even.                                   RECOMMEND 1  space1 : Determines the width of the channel from the beginning of a trade till profi
FREE
Traditional MACD MT4
Daniel Lewis
4.59 (56)
MACD indicator in MetaTrader 4/5 looks different than MACD does in most other charting software. That is because the MetaTrader 4/5 version of MACD displays the MACD line as a histogram when it is traditionally displayed as a line. Additionally, the MetaTrader 4/5 version computes the Signal line using an SMA, while according to MACD definition it is supposed to be an EMA. The MetaTrader 4/5 version also does not compute a true MACD Histogram (the difference between the MACD/Signal lines). This
FREE
The Sextet
Naim El Hajj
4 (3)
Overview The Sextet is an MT4 trend-alignment indicator based on a sequence of six moving-average levels. Each level is calculated from the previous one, creating a layered view of trend structure. The indicator marks conditions where the moving-average levels align in order, which can help traders observe trend direction and trend organization more clearly. Key Features Displays six moving-average levels. Uses a layered moving-average sequence. Helps visualize trend alignment and directional st
FREE
SpreadFix
Oleg Shangin
This indicator collects and organizes spread data. It is an organic add-on to my news robot, ExpertNews , which can be downloaded here . You can also watch a video about news trading using the ExpertNews robot. It is available on youtube . Unfortunately, it is not possible to place the robot in the mql5.com store, because the automatic validation of ExpertNews by the mql5 service ends in failure. In reality, there are no errors in the robot. Testing fails due to the fact that the advisor is
FREE
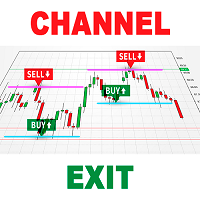
As you know, the price always moves in a certain channel and when the price goes out of the channel, it always tends to return back to the trading channel The Ind Channel Exit indicator will help you not to miss the price going out of the channel It can show an alert or send a message to the terminal on your smartphone that the next bar has closed above or below the channel levels It has a minimum number of settings and the main parameter is the Channel Multiplier , which determines the width o
FREE
Multi TF MA Levels
Luke Anthony Caras
Multi-TF MA Levels plots a single moving average across multiple timeframes directly on your chart, giving you instant context at every level of the market. No switching charts. No mental maths. Just clean, flat lines showing exactly where the MA sits on M15, M30, H1, H4 and D1 — all updated on confirmed bar close so there is no repainting. Features Plots the local timeframe MA plus up to 5 higher timeframe MAs simultaneously HTF lines only update on confirmed bar close — no repainting Higher ti
FREE
Note: this product is a free limited version of the full featured product Currency Timeframe Strength Matrix . It only includes AUD, CAD, CHF currencies instead of all 8 currencies. It includes only 5S, 1M, 5M time frames instead of all 8 (5S, 1M, 5M, 15M, 30M, 1H, 4H, 1D). What is it? The Currency TimeFrame Strength Matrix is a simple and comprehensive Forex map that gives a snapshot of what is happening in the Forex market at the very present time. It illustrates the strength and momentum ch
FREE
Il Matrix Arrow Indicator Multi Timeframe Panel MT4 è un componente aggiuntivo gratuito e una grande risorsa per il tuo Matrix Arrow Indicator MT4 . Mostra l'attuale segnale Matrix Arrow Indicator MT4 per 5 timeframe personalizzati dall'utente e per 16 simboli/strumenti modificabili in totale. L'utente ha la possibilità di abilitare/disabilitare uno qualsiasi dei 10 indicatori standard di cui è composto il Matrix Arrow Indicator MT4 . Anche tutti i 10 attributi degli indicatori standard sono re
FREE
This indicator will turn the colors of your candles into a trend oriented colored showing 4 different colors based on two moving averages and the slope of the slow moving average. very powerful indicator for all periods of time showing you the direction of the trend to confirm your trades. Green: Bullish Dark Green: Bullish Weak Light red: Bearish Weak Red: Bearish  For more info: https://linktr.ee/trader_1st
FREE
Multi ATR
Mr Ittiphol Pudkrajang
5 (1)
Simple dashboard to view ATR value across multiple time frame, no need to click at any timeframe, we can see the overview of ATR quicker. Support changing value of ATR period. Download free! We already tested via Strategy Tester, nothing wrong. If you found something wrong just drop the comment below or contact me at site: https://youtube.com/@itwetrade Email: itwetrade@gmail.com --------------------------- Support for development: https://www.buymeacoffee.com/itwetrade
FREE
Discover the power of precision and efficiency in your trading with the " Super Auto Fibonacci " MT4 indicator. This cutting-edge tool is meticulously designed to enhance your technical analysis, providing you with invaluable insights to make informed trading decisions. Key Features: Automated Fibonacci Analysis: Say goodbye to the hassle of manual Fibonacci retracement and extension drawing. "Super Auto Fibonacci" instantly identifies and plots Fibonacci levels on your MT4 chart, saving you tim
FREE
Zigzag Extremum points
Oleg Popov
4.82 (33)
New version 8.00 is available. In this version, I tried to take into account the wishes of the user. Each of you can also take part in the improvement of this advisor. In the default settings, the adviser opens trades when the extremum point is broken       standard indicator       Zigzag. When the upper point of the zigzag extremum is broken, it opens a buy deal, and when the lower point of the zigzag extremum is broken, it opens a sell deal. In addition to the standard ZigZag indicator, which
FREE
Donchian channels are a tool in technical analysis used to determine the relative volatility of a market and the potential for price breakouts. Can help identify potential breakouts and reversals in price, which are the moments when traders are called on to make strategic decisions. These strategies can help you capitalize on price trends while having pre-defined entry and exit points to secure gains or limit losses. Using the Donchian channel can thus be part of a disciplined approach to managi
FREE
Velvet RVI
Kevin Peter Abate
Velvet RVI is intended for use with the Velvet advanced ordering layer.  It is based on the algorithm for the Relative Vigor Index, provided by Investopedia here . All of the data it displays is accurate and verified against the internal API function iRVI, when it is detected by the ordering layer.  In order to place orders with the Velvet RVI indicator, the ordering layer must be installed and running.  Ordering from the Velvet RVI indicator requires that "Velvet Ordering Layer" ( found here ),
FREE
FFx RVI
Eric Venturi-Bloxs
5 (1)
The purpose of this new version of the MT4 standard indicator provided in your platform is to display in a sub-window multiple timeframes of the same indicator. See the example shown in the picture below. But the display isn’t like a simple MTF indicator. This is the real display of the indicator on its timeframe. Here's the options available in the FFx indicator: Select the timeframes to be displayed (M1 to Monthly) Define the width (number of bars) for each timeframe box Alert pop up/sound/ema
FREE
A ratio between 0 and 1 with the higher values representing a more efficient or trending market,  It is used in the calculation of Perry J. Kaufman Adaptive Moving Average (KAMA), dividing the price change over a period by the absolute sum of the price movements that occurred to achieve that change. The Fractal Efficiency or also known as Efficiency Ratio was first published by Perry J. Kaufman in his book ‘Smarter Trading‘. This is mostly considered a filter for volatile markets none the less
FREE
Gli utenti di questo prodotto hanno anche acquistato
Trend SniperX MT4
Sarvarbek Abduvoxobov
5 (5)
Trend Sniper X è un indicatore di trend-following multi-timeframe per MetaTrader 5 che aiuta i trader a identificare la direzione del trend e i potenziali punti di inversione con chiarezza e precisione. Per MT5: https://www.mql5.com/en/market/product/181101 Informazioni sul prezzo: Il prezzo attuale è promozionale ed è soggetto a modifiche con il rilascio dei prossimi aggiornamenti e nuove funzionalità. Canale Code2Profit Domina il mercato con l'analisi multi-timeframe! Come massimizzare il tuo
Zoryk Gold mt4
Reda El Koutbane
5 (3)
ZORYK — Sistema avanzato di segnali e pianificazione per XAUUSD su MetaTrader 4 Conosci sicuramente questa situazione. Analizzi l’oro, aspetti l’ingresso e finalmente apri la posizione. Il prezzo si muove immediatamente contro di te. Chiudi troppo presto, sposti lo Stop Loss oppure esiti per alcuni secondi. Poco dopo, il mercato raggiunge esattamente la direzione e l’obiettivo che avevi previsto, ma senza di te. Il problema non era sempre la direzione. Il vero problema era l’incertezza. No
M1 Sniper
Oleg Rodin
4.97 (30)
M1 SNIPER è un sistema di indicatori di trading facile da usare. Si tratta di un indicatore a freccia progettato per l'intervallo temporale M1. L'indicatore può essere utilizzato come sistema autonomo per lo scalping sull'intervallo temporale M1 e come parte del tuo sistema di trading esistente. Sebbene questo sistema di trading sia stato progettato specificamente per il trading sull'intervallo temporale M1, può comunque essere utilizzato anche con altri intervalli temporali. Inizialmente ho pro
Tokyo mt4 Indicator
Vasiliy Strukov
5 (9)
Il Tokyo Indicator offre una chiara panoramica visiva della direzione del trend, dei potenziali segnali di trading e delle condizioni di mercato. La sua linea di trend a gradini, codificata a colori, distingue le fasi rialziste (in blu) da quelle ribassiste (in magenta). Frecce direzionali dedicate evidenziano potenziali opportunità di acquisto e vendita al variare del trend visualizzato. Una dashboard integrata riunisce in un'unica visualizzazione pratica il segnale corrente, il bias di mercato
PRO Renko System
Oleg Rodin
5 (31)
PRO Renko System è un sistema di trading altamente accurato appositamente progettato per il trading di grafici RENKO. Questo è un sistema universale che può essere applicato a vari strumenti di trading. Il sistema neutralizza efficacemente il cosiddetto rumore di mercato che consente di accedere a segnali di inversione accurati. L'indicatore è molto facile da usare e ha un solo parametro responsabile della generazione del segnale. Puoi facilmente adattare lo strumento a qualsiasi strumento di
Currency Strength Wizard è un indicatore molto potente che ti fornisce una soluzione all-in-one per un trading di successo. L'indicatore calcola la potenza di questa o quella coppia forex utilizzando i dati di tutte le valute su più intervalli di tempo. Questi dati sono rappresentati in una forma di indice di valuta facile da usare e linee elettriche di valuta che puoi utilizzare per vedere il potere di questa o quella valuta. Tutto ciò di cui hai bisogno è collegare l'indicatore al grafico che
Atomic Analyst
Issam Kassas
5 (14)
Atomic Analyst — MetaTrader 4 Per domande sul prodotto, indicazioni sulla configurazione o supporto tecnico, scrivimi direttamente qui su MQL5. L’indicatore trasforma calcoli complessi del mercato in semplici segnali visivi, candele colorate, letture del trend, livelli di stop-loss e diverse zone di take-profit che i trader possono capire rapidamente e usare in condizioni reali di mercato. Principali utilizzi di trading: Scalping e trading intraday: Progettato per decisioni rapide, frecce chiar
Smart Trend Trading System è un indicatore per MetaTrader 4 che riunisce informazioni sul trend, segnali di entrata e uscita e livelli di prezzo in un unico grafico. Combina più di 10 strumenti di trading in un unico sistema, inclusi rilevamento del trend, zone di inversione, Smart Cloud, logica di trailing stop, supporto e resistenza, colorazione delle candele, avvisi e analisi multi-timeframe. Il sistema è progettato per aiutarti a operare in diverse condizioni di mercato: Mercati in trend: I
Scalper Vault
Oleg Rodin
5 (40)
Scalper Vault è un sistema di trading potente e completo, progettato per i trader che desiderano ottenere risultati costanti nel trading intraday. Questo indicatore ad alta precisione funge da sistema di trading autonomo, offrendo analisi di livello istituzionale sia per il mercato Forex che per le Opzioni Binarie. CONTATTAMI DOPO L'ACQUISTO PER RICEVERE I MIEI CONSIGLI DI TRADING E UN FANTASTICO BONUS! Eliminando le congetture e le complesse analisi manuali, Scalper Vault ti permette di concen
Neuro Poseidon MT4
Daria Rezueva
4.74 (46)
Neuro Poseidon is a new indicator by Daria Rezueva. It combines precise trading signals with adaptive TP/SL levels - creating best possible trades as a result! Message me and get  Neuro Poseidon Assistant  as a gift to automize your trading process! What makes it stand out? 1. Proven profitability on all assets and timeframes 2. Only confirmed BUY and SELL signals present on the chart 3. Adaptive TP & SL levels generated by the software for each trade 4. Easy to understand - suitable for all
Gann Made Easy
Oleg Rodin
4.84 (173)
Gann Made Easy è un sistema di trading Forex professionale e facile da usare che si basa sui migliori principi del trading utilizzando la teoria di mr. WD Gann. L'indicatore fornisce segnali ACQUISTA e VENDI accurati, inclusi i livelli di Stop Loss e Take Profit. Puoi fare trading anche in movimento utilizzando le notifiche PUSH. CONTATTAMI DOPO L'ACQUISTO PER RICEVERE GRATUITAMENTE LE ISTRUZIONI DI TRADING E OTTIMI INDICATORI EXTRA! Probabilmente hai già sentito parlare molte volte dei metodi d
Liquidity Scalper System: un sistema di trading basato sulla liquidità in formato indicatore. La maggior parte degli indicatori mostra solo una freccia, poi è il trader a decidere dove mettere lo stop, dove si trova il target e se fidarsi del segnale. Liquidity Scalper System copre l'intero ciclo del trade: trova i pool di liquidità, dà un segnale alla loro rottura, calcola subito Entry, Stop Loss e tre target, e mostra sul pannello le statistiche e i risultati della verifica su dati nuovi. Il
SR Liquidity
Oleg Rodin
5 (2)
SR Liquidity è un indicatore di trading progettato per individuare le zone nascoste in cui si concentra la liquidità di mercato e dove il prezzo reagisce con maggiore intensità. Queste aree di liquidità agiscono come potenti livelli di supporto e resistenza, offrendo una mappa chiara dei punti in cui è più probabile che il mercato inverta la propria direzione. Invece di tracciare le classiche linee di supporto e resistenza, SR Liquidity analizza l'effettivo comportamento dei prezzi per individua
AW Prime Oscillator
AW Trading Software Limited
5 (1)
Una combinazione di due oscillatori. Il primo mostra i punti di ingresso, il secondo mostra l'andamento attuale. L'indicatore può visualizzare i segnali dell'oscillatore tramite frecce in due modalità, tutti i segnali dell'oscillatore veloce o segnali solo nella direzione della tendenza attuale. Ha un pannello multi-intervallo temporale e tre tipi di notifiche di segnali. Benefici: Adatto per il trading giornaliero e scalping Filtraggio delle tendenze Configurazione semplice e sensibile Pannello
CRT Candle Range Theory HTF MT4 - Ultimate CRT Indicator: Concetti ICT avanzati e sistema di trading Malaysian SnR Padroneggia le orme dei Market Maker con l'indicatore Candle Range Theory più avanzato. Sblocca il vero potere degli Smart Money Concepts (SMC) e fai trading con la stessa precisione delle istituzioni grazie all'Ultimate CRT Indicator. Costruito esclusivamente per i trader seri, questo indicatore automatizza la teoria CRT, un pilastro centrale dei Concetti ICT (Inner Circle Trader),
Top Bottom Tracker è un indicatore basato su sofisticati algoritmi che analizza l'andamento del mercato ed è in grado di rilevare i massimi e i minimi del trend / Versione MT5 . Il prezzo aumenterà progressivamente fino a raggiungere i 500$. Prossimo prezzo --> 99$ Caratteristiche Nessuna riverniciatura Questo indicatore non cambia i suoi valori all'arrivo di nuovi dati Coppie di trading Tutte le coppie forex Timeframe Tutti i timeframe Parametri ==== Configurazione dell'indicatore ====
Cycles Predictor Indicator This indicator uses past market cycles to predict future price movements. The indicator scans through past data and considers  combinations  of cycles. When cycles  coincide  at the same future date/time then it is considered a valid future prediction. The predictions are drawn as vertical lines on the right side of the chart in the future. A prediction will often result in type of candle (ex. bull or bear) and/or a reversal point (ex. bottom or top) forming at this ex
Break and Retest Hunter MT4 is a powerful MetaTrader 5 indicator designed to automatically identify support and resistance levels, breakout structures, and potential retest opportunities in real time. Bonus Indicator: After purchasing Break and Retest Hunter , contact me to receive Trade Indicator Assistant EA completely free as a bonus utility. $65 for the next 10 copies . Next price is $120.  Combining adaptive market analysis, clear BUY/SELL signals, Fibonacci-based profit targets, and a pre
Segnale GoldRush Trend Arrow L'indicatore GoldRush Trend Arrow Signal fornisce un'analisi precisa e in tempo reale dei trend, pensata appositamente per gli scalper ad alta velocità e a breve termine nel mercato XAU/USD. Progettato specificamente per il timeframe di 1 minuto, questo strumento mostra frecce direzionali che indicano chiari punti di ingresso, consentendo agli scalper di navigare con sicurezza nelle condizioni di mercato volatili. L'indicatore è composto da frecce di avviso PRIMA
ForexTrendMT4
Andriy Sydoruk
5 (1)
ForexTrendMT4 Indicator: A Reliable Tool for Market Tracking The ForexTrendMT4 indicator offers reliable market trend tracking, filtering out sudden fluctuations and market noise. This tool helps identify trends and signals favorable entry points into the market using arrows. It is suitable for both scalping on shorter timeframes and long-term trading strategies. Based on the principles of technical analysis, ForexTrendMT4 takes into account the cyclical nature of the market. Key Features and A
CRT Multi-Timeframe Market Structure & Liquidity Sweep Indicator Non-Repainting | Multi-Asset | MT5 Version Available MT5 Version:   https://www.mql5.com/en/market/product/162075 Full User Guide — explains what each feature does and why:   https://www.mql5.com/en/blogs/post/767525 Quick Start User Guide  — explains how to configure and in what order:  https://www.mql5.com/en/blogs/post/767540 Indicator Overview CRT Ghost Candle HTF Fractal is a complete institutional-grade market structure too
Super Signal – Skyblade Edition Sistema professionale di segnali di tendenza senza repaint / senza ritardo con tasso di vincita eccezionale | Per MT4 / MT5 Funziona meglio su timeframe più bassi, come 1 minuto, 5 minuti e 15 minuti. Caratteristiche principali: Super Signal – Skyblade Edition è un sistema intelligente di segnali progettato specificamente per il trading di tendenza. Utilizza una logica di filtraggio multilivello per identificare esclusivamente i movimenti direzionali forti, supp
ATTUALMENTE SCONTATO DEL 40% La soluzione migliore per ogni principiante o trader esperto! Questo indicatore è uno strumento di trading unico, di alta qualità e conveniente perché abbiamo incorporato una serie di caratteristiche proprietarie e una nuova formula. Con un solo grafico è possibile leggere la forza delle valute per 28 coppie Forex! Immaginate come migliorerà il vostro trading perché sarete in grado di individuare l'esatto punto di innesco di una nuova tendenza o di un'opportunità
Volume Orderflow Profile
Suvashish Halder
5 (2)
Introducing Volume Orderflow Profile , a versatile tool designed to help traders visualize and understand the dynamics of buying and selling pressure within a specified lookback period. Perfect for those looking to gain deeper insights into volume-based market behavior! MT5 Version -  https://www.mql5.com/en/market/product/122657 The indicator gathers data on high and low prices, along with buy and sell volumes, over a user-defined period. It calculates the maximum and minimum prices during this
Smart Price Action Concepts — MetaTrader 4 Per domande sul prodotto, indicazioni sulla configurazione o supporto tecnico, scrivimi direttamente qui su MQL5. Funzionalità: • Smart Money Concepts SMC • Inner Circle Trading ICT • Price Action PA e Institutional Trading IT • Struttura di mercato in tempo reale e swing structure highs and lows (HH HL LL LH) • Order blocks interni e swing supply and demand in tempo reale • Premium Equilibrium e Discount Zones • Rilevamento automatico Fibonacci con 2 o
True Direction Oscillator
Muhammad Elbermawi
4.85 (364)
Oppure (TDO) che è un indice che misura il tasso di variazione del prezzo utilizzando il principio del " Pure Momentum ". Quando il prezzo di un titolo avanza da 10 a 15, il tasso di variazione del prezzo è del 150%, ma quando scende da 15 a 10, il tasso di variazione del prezzo è solo del 33,3%. Ecco perché gli indicatori di analisi tecnica come "Price Rate of Change" (ROC) o "Momentum" forniscono letture più elevate per i movimenti di prezzo ascendente rispetto a quelli dati a quelli discenden
Trend Lines PRO
Roman Podpora
5 (2)
LINEE DI TENDENZA PRO       Aiuta a capire dove il mercato sta realmente cambiando direzione. L'indicatore mostra reali inversioni di tendenza e punti in cui i principali attori rientrano. Vedi  Linee BOS   Cambiamenti di tendenza e livelli chiave su timeframe più ampi, senza impostazioni complesse o rumore inutile. I segnali non vengono ridisegnati e rimangono sul grafico dopo la chiusura della barra. VERSIONE MT 5     -      Svela il suo massimo potenziale se abbinato all'indicatore   RFI LEVE
Attualmente 30% di sconto! La soluzione migliore per ogni principiante o trader esperto! Questo software per cruscotti funziona su 28 coppie di valute. Si basa su 2 dei nostri indicatori principali (Advanced Currency Strength 28 e Advanced Currency Impulse). Offre un'ottima panoramica dell'intero mercato Forex. Mostra i valori di forza delle valute avanzate, la velocità di movimento delle valute e i segnali per 28 coppie Forex in tutti i (9) timeframe. Immaginate come migliorerà il vostro tra
Advanced Supply Demand
Bernhard Schweigert
4.91 (302)
Speciale Trading- SCONTO DEL 30% La soluzione migliore per qualsiasi trader principiante o esperto! Questo indicatore è uno strumento di trading unico, di alta qualità e conveniente, perché abbiamo incorporato una serie di funzionalità proprietarie e una nuova formula. Con questo aggiornamento, potrai visualizzare doppie zone di timeframe. Non solo potrai visualizzare un TF più alto, ma anche entrambi, il TF del grafico e il TF più alto: MOSTRA ZONE ANNIDATE. Tutti i trader che operano con Of
KT Parabolic RSI MT4
KEENBASE SOFTWARE SOLUTIONS
KT Parabolic RSI overlays Parabolic SAR directly on the RSI line to highlight likely market turning points. Classic RSI overbought and oversold readings already hint at reversals, and the added PSAR filter removes much of the noise and sharpens those signals, giving you clearer trade setups. Big Square Signals: A Parabolic SAR flip on an RSI that sits in overbought or oversold territory. These mark high-probability market turns. Small Square Signals: A SAR flip inside the neutral RSI band. Treat
Altri dall’autore
Where is price in the range - premium, discount or in the OTE zone? This indicator draws it, alerts you, and checks on your own chart what price did next. ICT Premium Discount OTE Honest Stats draws the current dealing range with premium, discount, equilibrium (50%) and the optimal trade entry zone (62-79%), alerts you when price reaches the OTE zone, and measures on that chart's own history how often price then went on with the leg, next to random candles. Free, part of the Honest Stats series.
FREE
Most liquidity indicators draw the lines. This one also checks whether price respects them. ICT Liquidity Levels Honest Stats draws the levels ICT traders watch: previous day high and low, previous week high and low, and the Asian range high and low. A table measures on your own chart how often price reached each level and how often it turned back there, next to random lines nearby. Free, part of the Honest Stats series. MT4 version | ICT Killzones Honest Stats (free) | ICT FVG Honest Stats (fre
FREE
Most FVG indicators draw boxes. This one also checks whether the boxes work. ICT Fair Value Gap FVG Honest Stats draws every fair value gap on your chart and measures, on that chart's own history, how often price came back to a gap and how often the gap held, next to fake boxes of the same size. Free, part of the Honest Stats series. MT4 version | ICT Killzones Honest Stats (free) | ICT Liquidity Levels Honest Stats (free) | ICT SMT Divergence Honest Stats (free) | TrueRisk Trade Panel (free) NE
FREE
How much room does gold have left today? This indicator shows the average daily range (ADR) of XAUUSD, how much of it today has already used, where today's ADR high and ADR low are, and how often past days that got this far went on to the full range. Gold ADR Daily Range Meter draws today's ADR high and ADR low on the chart, fills a bar as the day uses its range and alerts you when the day has used its full ADR. A table counts on your own daily history what usually happens next: once a day had u
FREE
Trade the ICT Silver Bullet hours without watching the clock. This indicator draws the three windows, waits for the liquidity sweep and the first fair value gap after it, alerts you, and checks on your own chart what price did next. ICT Silver Bullet Honest Stats marks the London (03:00-04:00), New York AM (10:00-11:00) and New York PM (14:00-15:00) Silver Bullet windows in New York time, draws the liquidity of the two hours before each window, shows when the window sweeps it, and marks the firs
FREE
See which fair value gaps flipped sides. This indicator marks every inversion fair value gap (IFVG) - a gap that a candle closed straight through - signals and alerts when price comes back to it and respects it, and checks on your own chart what price did next. ICT Inversion Fair Value Gap IFVG Honest Stats finds fair value gaps, waits for a candle to close through one and turns it into an inversion gap on the other side: a bearish gap closed above becomes bullish support, a bullish gap closed b
FREE
Most liquidity indicators draw the lines. This one also checks whether price respects them. ICT Liquidity Levels Honest Stats draws the levels ICT traders watch: previous day high and low, previous week high and low, and the Asian range high and low. A table measures on your own chart how often price reached each level and how often it turned back there, next to random lines nearby. Free, part of the Honest Stats series. MT5 version | ICT Killzones Honest Stats MT4 (free) | ICT FVG Honest Stats
FREE
Where is price in the range - premium, discount or in the OTE zone? This indicator draws it, alerts you, and checks on your own chart what price did next. ICT Premium Discount OTE Honest Stats draws the current dealing range with premium, discount, equilibrium (50%) and the optimal trade entry zone (62-79%), alerts you when price reaches the OTE zone, and measures on that chart's own history how often price then went on with the leg, next to random candles. Free, part of the Honest Stats series.
FREE
Order blocks from any timeframe, with alerts - and a table that tells you honestly whether they work on your chart. ICT Order Blocks Honest Stats draws order blocks from this or a higher timeframe, marks each one fresh, tested or broken, alerts you when price comes back to a fresh block, and measures on your chart's own history how often the blocks held next to fake zones of the same size. Free, part of the Honest Stats series. Market Structure (free) | MT4 version (free) | Free: FVG Honest Stat
FREE
See which fair value gaps flipped sides. This indicator marks every inversion fair value gap (IFVG) - a gap that a candle closed straight through - signals and alerts when price comes back to it and respects it, and checks on your own chart what price did next. ICT Inversion Fair Value Gap IFVG Honest Stats finds fair value gaps, waits for a candle to close through one and turns it into an inversion gap on the other side: a bearish gap closed above becomes bullish support, a bullish gap closed b
FREE
ICT market structure from any timeframe - HH, HL, LH, LL, every BOS and CHoCH, with alerts - and a table that measures how often price really followed each break on your chart. ICT Market Structure Honest Stats labels every swing high and low, draws each break of structure (BOS) and change of character (CHoCH), shows the levels the next break needs, alerts you the moment a new break forms, and measures on your chart's own history how often price went on in the break's direction compared with ran
FREE
Most SMT indicators mark the divergences. This one also checks whether they work. ICT Correlation SMT Divergence Honest Stats compares your chart with a related market (gold with silver, EURUSD with GBPUSD, BTC with ETH, US500 with US100) and marks every SMT divergence. A table measures on your own chart whether price turned after an SMT more often than after a normal new high or low. Free, part of the Honest Stats series. MT4 version | ICT Killzones Honest Stats (free) | ICT FVG Honest Stats (f
FREE
Most killzone indicators draw boxes. This one checks whether the boxes work. Asia, London open, New York open and London close drawn automatically A table on your chart measures how often the day's high or low really formed inside each killzone, next to what pure chance would give Free. Check the numbers before you trust any killzone strategy MT4 version (free) | ICT FVG Honest Stats (free) | ICT Liquidity Levels Honest Stats (free) | ICT SMT Divergence Honest Stats (free) | TrueRisk Trade Panel
FREE
Most FVG indicators draw boxes. This one also checks whether the boxes work. ICT Fair Value Gap FVG Honest Stats draws every fair value gap on your chart and measures, on that chart's own history, how often price came back to a gap and how often the gap held, next to fake boxes of the same size. Free, part of the Honest Stats series. MT5 version | ICT Killzones Honest Stats MT4 (free) | ICT Liquidity Levels Honest Stats MT4 (free) | ICT SMT Divergence Honest Stats MT4 (free) | TrueRisk Trade Pan
FREE
Order blocks from any timeframe, with alerts - and a table that tells you honestly whether they work on your chart. ICT Order Blocks Honest Stats draws order blocks from this or a higher timeframe, marks each one fresh, tested or broken, alerts you when price comes back to a fresh block, and measures on your chart's own history how often the blocks held next to fake zones of the same size. Free, part of the Honest Stats series. Market Structure MT4 (free) | MT5 version (free) | Free: FVG Honest
FREE
Most killzone indicators draw boxes. This one also checks whether the boxes work. ICT Killzones Honest Stats for MetaTrader 4 draws the four ICT killzones (Asia, London open, New York open, London close) and measures on your own chart how often the day's high or low really formed inside each one, next to what pure chance would give, and how often the London Judas swing really reverses. Free, part of the Honest Stats series. MT5 version | ICT FVG Honest Stats MT4 (free) | ICT Liquidity Levels Hon
FREE
ICT market structure from any timeframe - HH, HL, LH, LL, every BOS and CHoCH, with alerts - and a table that measures how often price really followed each break on your chart. ICT Market Structure Honest Stats labels every swing high and low, draws each break of structure (BOS) and change of character (CHoCH), shows the levels the next break needs, alerts you the moment a new break forms, and measures on your chart's own history how often price went on in the break's direction compared with ran
FREE
Free. Set your risk, click Buy or Sell, done. TrueRisk Trade Panel works out the lot size for you. Type how much of your account you want to risk (for example 1%), set the stop loss in points or drag it on the chart, and the BUY and SELL buttons already show the right lot. No lot calculator, no guessing, no trade that risks ten times more than you meant. TrueRisk Account Dashboard MT4 (free) | TrueRisk Symbol Changer MT4 (free) | MT5 version | All TrueRisk tools NEW (free): a picture of every tr
FREE
Free. One click to switch the chart to another symbol. TrueRisk Symbol Changer puts your symbols on the chart as buttons, each with today's % change in green or red. Click one and the chart switches to it, keeping your timeframe, your template and your other indicators. One row of timeframe buttons (M1 to MN) does the same for the timeframe. No more right-click, Symbols, find, drag. MT4 version (free) | TrueRisk Account Dashboard (free) | TrueRisk Trade Panel (free) | All TrueRisk tools Symbols
FREE
Most SMT indicators mark the divergences. This one also checks whether they work. ICT Correlation SMT Divergence Honest Stats compares your chart with a related market (gold with silver, EURUSD with GBPUSD, BTC with ETH, US500 with US100) and marks every SMT divergence. A table measures on your own chart whether price turned after an SMT more often than after a normal new high or low. Free, part of the Honest Stats series. MT5 version | ICT Killzones Honest Stats MT4 (free) | ICT FVG Honest Stat
FREE
Trade the ICT Silver Bullet hours without watching the clock. This indicator draws the three windows, waits for the liquidity sweep and the first fair value gap after it, alerts you, and checks on your own chart what price did next. ICT Silver Bullet Honest Stats marks the London (03:00-04:00), New York AM (10:00-11:00) and New York PM (14:00-15:00) Silver Bullet windows in New York time, draws the liquidity of the two hours before each window, shows when the window sweeps it, and marks the firs
FREE
Free. Set your risk, click Buy or Sell, done. TrueRisk Trade Panel works out the lot size for you. Type how much of your account you want to risk (for example 1%), set the stop loss in points or drag it on the chart, and the BUY and SELL buttons already show the right lot. No lot calculator, no guessing, no trade that risks ten times more than you meant. MT4 version (free) NEW (free): a picture of every trade, saved by itself. TrueRisk Trade Journal saves a chart picture when a trade opens and w
FREE
Manual Copy your trades to every account, MT4 and MT5, each sized to its own risk TrueRisk Trade Copier copies trades between MetaTrader 4 terminals, and between MetaTrader 4 and MetaTrader 5 (with the MT5 version), on the same computer or VPS: from the account you trade to your other accounts, to a prop-firm challenge, or from a personal account to a funded one. Each receiving account sizes every copy to its own risk % from the sender's stop loss, and never lets a copy's stop break that account
Manual TrueRisk Account Guard Pro watches your whole MetaTrader 4 account and steps in before a prop firm's loss limit is breached. On top of the daily and maximum loss limits it caps the loss on each trade, adds missing stop losses, limits how much you trade and closes everything before the weekend. Firm presets: FTMO 2-Step, FTMO 1-Step, FundedNext Stellar 2-Step, The5ers High Stakes, or your own rules Daily reset in the firm's own time zone (Prague, New York, UTC or server time), summer time
Manual TrueRisk Trade Manager is a one-click trading panel for MetaTrader 4. You set your risk in percent and the stop loss; the panel works out the lot size, checks that the stop can't take you past your daily or maximum loss limit, opens the trade and then manages it for you: partial close, break-even and trailing stop. Lot size from your risk %, cut to the room left before your loss limits Partial close, break-even and trailing stop in R, automatically Stop loss and lot size for trades you op
Every ICT idea in one indicator - market structure, order blocks, fair value gaps, premium / discount and OTE, liquidity sweeps, killzones and SMT - added up into one confluence score, with alerts and a multi-symbol scanner. Try it free first: press Free Demo and run it in the Strategy Tester (visual mode) - the panel, zones, signals and scanner all work there. ICT Pro Honest Stats draws all of it on your chart, checks every closed candle against nine ICT factors, shows the bullish and bearish s
Manual A hard daily loss limit for any account: your own money or a prop challenge. Set your daily and maximum loss limit once. Before either is reached it closes every position and locks trading: all symbols, all EAs, manual and phone trades Per-trade loss cap, automatic stop loss, max trades per day, news lock, Friday close: the rules most traders write down and then break Trading a challenge? Pick FTMO, FundedNext or The5ers and the limits load the way that firm counts them, with the right re
Manual Risk-based lot size, stop and target in one click. On any account. Set your stop, click Buy or Sell: the lot comes from your risk %. On an account with loss limits it is also cut to the room left before your daily and maximum loss limit. Ordinary trade panels only do the first part Partial close, break-even and trailing stop then run by themselves Trades opened on your phone get a stop loss and are cut to your risk % by the desktop manager (MT5 mobile has no lot calculator) Account protec
Manual Copy your trades to every account, each sized to its own risk TrueRisk Trade Copier copies trades between MetaTrader 5 terminals on the same computer or VPS: from the account you trade to your other accounts, to a prop-firm challenge, or from a personal account to a funded one. Each receiving account sizes every copy to its own risk % from the sender's stop loss, and never lets a copy's stop break that account's daily or maximum loss limit. MT4 version | TrueRisk Account Guard Pro (the gu
Every ICT idea in one indicator - market structure, order blocks, fair value gaps, premium / discount and OTE, liquidity sweeps, killzones and SMT - added up into one confluence score, with alerts and a multi-symbol scanner. Try it free first: press Free Demo and run it in the Strategy Tester (visual mode) - the panel, zones, signals and scanner all work there. ICT Pro Honest Stats draws all of it on your chart, checks every closed candle against nine ICT factors, shows the bullish and bearish s
Filtro:
Nessuna recensione
Rispondi alla recensione