Gold ADR Daily Range Meter MT5

How much room does gold have left today? This indicator shows the average daily range (ADR) of XAUUSD, how much of it today has already used, where today's ADR high and ADR low are, and how often past days that got this far went on to the full range.

Gold ADR Daily Range Meter draws today's ADR high and ADR low on the chart, fills a bar as the day uses its range and alerts you when the day has used its full ADR. A table counts on your own daily history what usually happens next: once a day had used 50%, 75%, 100% or 125% of its ADR, how often did it go on to 100%, 125% and 150%? Made for gold, works on any symbol. Free.

MT4 version (free)

What gold did (1,000 days of XAUUSD since December 2022, broker data)

  • Half of all days stayed under 92% of their ADR
  • 41% of days reached their full ADR
  • Once a day had used 75% of its ADR, it went on to 100% on 59% of days and to 125% on 33%
  • Once a day had used its full ADR, it went on to 125% on 55% of days

Your broker's history gives your own numbers: the table counts them on your chart.

What it draws

  • ADR high = today's low + ADR, ADR low = today's high - ADR. Before the day has used its full ADR they show how far price can still go up or down on an average day
  • Once the day has used its full ADR the two lines stop moving and mark the full-range box (low + ADR when the up move got there first, high - ADR when the down move did). Price beyond the box is extension
  • The day's open (dotted)
  • The same lines for the last 5 days, dotted, so you see how past days used their range

The panel

  • ADR in dollars for gold and silver, pips for forex, price units for indices and crypto
  • Today's range and the share of the ADR it has used, with a bar that marks 100%
  • Room up to the ADR high and down to the ADR low from the current price
  • The live odds line for today's exact share, e.g. "Of 700 past days that got to 75%, 59% went on to 100%" (it looks at the next step above today's share: 100%, 125%, 150% or 200%)
  • The previous day's range and this week's range against the 10-week average

The history table

  • Rows: the day's range reached 50%, 75%, 100% or 125% of its ADR
  • Columns: how many days got there, and the share of them that went on to 100%, 125% and 150%
  • Today's row is highlighted
  • Under the table: the median day (in % of ADR) and the share of days that reach their full ADR

The numbers are plain counts of your broker's daily candles: every day's range against the average range of the 20 days before it. Nothing is fitted or optimised.

Alerts

  • When today's range has used 100% of the ADR (or any share you set, 0 = off), once per day
  • Popup, sound, push to the MetaTrader app on your phone, e-mail

How to use it

  • Put it on any chart from M1 to D1: the daily numbers are the same on every timeframe
  • Before a trade: is there still room to the target, or has gold already used most of its usual day?
  • Take-profit and stop distances: compare them with the ADR and the room left
  • Afternoon breakouts after a full-ADR morning: the table shows how often such days really extended
  • Sunday candles of brokers on GMT count with Monday; markets that trade every day (crypto) keep every day

Limitations

  • A day here is your broker's day (server time). Brokers with another time zone cut days differently, so their numbers differ a little
  • The lines are fixed by candle highs and lows; inside one candle the order of moves is unknown
  • Past behaviour does not guarantee future behaviour. This is a measuring tool, not a trading signal

Inputs

  • ADR: average of the last 20 days; weekly range: average of the last 10 weeks (0 = off)
  • Lines: days to draw (5), colours, day open on/off, line names on/off
  • Alert: share of ADR (100%, 0 = off); popup, sound, push, e-mail
  • Panel and table on/off, corners, days for the table (1,000), font size

Support: if something doesn't work as expected, send me a private message first. I answer every message and fix problems quickly.

Produtos recomendados
VFI Quantum
Nikita Berdnikov
5 (1)
Introducing VFI (Volume Flow Indicator) – a trading indicator that analyzes the relationship between volume and price movement to identify key trading opportunities. The indicator displays the strength and direction of volume flow, providing clear signals about potential entry and exit points. Signals are formed based on zero line crossovers, crossovers between the VFI line and its exponential moving average (EMA), and when the indicator exits overbought and oversold zones. Attention! This stra
FREE
Trading Sessions by Mahefa R is an indicator for MetaTrader 5 that visually identifies the four main trading sessions: New York, London, Tokyo, and Sydney . Designed to provide a clean, intuitive, and professional market view, it highlights the most active periods of the Forex market using smart visualization of session ranges , session-specific candle colors , and daily separators . Main Features: Automatic detection of the 4 major sessions New York London Tokyo Sydney Each session is fully c
FREE
TradeVision Pro
Ian Nganga Comba
TradeVisonPro Forex Analyzer Pro Painel de análise e monitoramento de contas de trading MT5 TradeVisonPro Forex Analyzer Pro é uma solução de análise de trading e monitoramento de contas desenvolvida para usuários do MetaTrader 5. O produto organiza os dados de trading do MT5 em um painel web estruturado, permitindo que os traders visualizem informações da conta, monitorem posições abertas, analisem o histórico de operações, acompanhem estratégias, mantenham um diário de trading e revisem estatí
FREE
Follow The Line MT5
Oliver Gideon Amofa Appiah
4.6 (35)
This indicator obeys the popular maxim that: "THE TREND IS YOUR FRIEND" It paints a GREEN line for BUY and also paints a RED line for SELL. (you can change the colors). It gives alarms and alerts of all kinds. IT DOES NOT REPAINT and can be used for all currency pairs and timeframes. Yes, as easy and simple as that. Even a newbie can use it to make great and reliable trades. NB: For best results, get my other premium indicators for more powerful and reliable signals. Get them here: https://www.m
FREE
Blahtech VWAP MT5
Blahtech Limited
5 (1)
Blahtech VWAP - Volume Weighted Average Price (VWAP) is the ratio of price to total volume. It provides an average price over a specified time interval.  Links [  Install  |  Update  |  Documentation   ] Feature Highlights Configurable VWAP Line Sessions, intervals, anchored or continuous Previous day settlement line Standard Deviation bands Alerts at bar close or real time Automatic Broker or Tick volumes Significantly reduced CPU usage Input Parameters Expert Advisor Mode  - Reserved for iCu
FREE
Show Pips for MT5
Roman Podpora
4.5 (32)
Este indicador de informação será útil para quem quer estar sempre atento à situação atual da conta. VERSION MT 4 -   More useful indicators O indicador exibe dados como lucro em pontos, porcentagem e moeda, bem como o spread do par atual e o tempo até o fechamento da barra no período atual. Existem várias opções para colocar a linha de informação no gráfico: À direita do preço (corre atrás do preço); Como comentário (no canto superior esquerdo do gráfico); No canto selecionado da tela. Também é
FREE
AZ session scalper
Yurii Shvechikov
5 (1)
AZ session scalper A small but useful session indicator, designed primarily for scalping. Enable the session you plan to trade, watch the reaction of the M5/M15 candlesticks to the level of the previous trading session, and enter. We always look at the reaction of the current session to the previous one. For example, if you trade the Americas, enable the European session, and watch how one session takes away liquidity from another. Important: adjust the time to your broker's time zone in the i
FREE
SuperTrend Indicator – Description & Important Notice The SuperTrend is a composite technical indicator designed to help you identify the primary trend, measure its strength, and assess signal quality. However, an indicator is only a tool —it’s never 100% accurate and cannot replace sound risk management. 1. Core Formula & Components ATR (Average True Range): measures price volatility; customize sensitivity via Periods and Multiplier . Upper/Lower Bands: derived from ATR and your chosen source p
FREE
Indicador de volatilidade de Chaikin que calcula o spread entre o preço máximo e mínimo. Ele julga o valor de volatilidade baseando-se na amplitude entre a máxima e a mínima. Ao contrário do indicador Average True Range , o Indicador de Chaikin não leva em conta os gaps. Segundo a interpretação de Chaikin, um crescimento do indicador de volume em um espaço relativamente curto de tempo significa que os preços se aproximam de seu mínimo (como quando os títulos são vendidos em pânico), enquanto que
FREE
MegaSpikes Boom and Crash
Kwaku Bondzie Ghartey
4.56 (32)
MegaSpikes Boom and Crash MegaSpikes Boom and Crash is a MetaTrader 5 technical indicator for studying Boom and Crash synthetic index charts, mainly on the M1 timeframe. It brings several MegaSpikes modes into one indicator so users can observe chart conditions, alerts, and technical confirmations from a single tool. Main features Version selector for MegaSpikes 1, 1.31, 1.32, Divergence, and Last Red Candle modes. Technical-analysis components based on RSI, ATR, Alligator, moving averages, Para
FREE
PROMETHEUS TECHNICAN VERSION Free | By THE SONS A gift from The Sons — no strings, no trial, no expiry. Every trader deserves access to professional-grade market intelligence. That belief is why Prometheus Technical Version exists, and why it costs nothing. Consider it our handshake to the trading community. What You're Getting This is not a simplified tool dressed up as a gift. Prometheus Technican Version is a fully built, institutional-quality technical analysis indicator running a dual-model
FREE
Enhanced FVG Enhanced FVG is a technical indicator for MetaTrader 5 that identifies Fair Value Gaps on the chart and measures the buyer-to-seller volume ratio within each detected gap. Volume classification is performed using M1 timeframe tick volume data, applying the same methodology used in standard Volume Profile analysis. How It Works The indicator scans three consecutive candlesticks to detect Fair Value Gaps. A Bullish FVG is identified when the high of the first candle does not overlap w
FREE
Volume-to-Price Movement Oscillator (VP Oscillator) for MT5 The VP Oscillator highlights the balance (or imbalance) between trading volume and price movement, helping traders spot hidden accumulation, distribution, or weakening trends. How It Works: Calculates each bar’s price range (High–Low) and tick volume. Normalizes both values over a set period (default: 14). Plots the absolute difference between them ×100 — showing how closely price action aligns with trading activity. Interpretation: Hig
FREE
Mae Pla Green Pen Analysis Framework The Mae Pla Green Pen Analysis Framework is a multi-timeframe price action scanner for XAUUSD (Gold Spot) . It monitors all 9 timeframes simultaneously — M1, M5, M15, M30, H1, H4, D1, W1, and MN — and displays pattern detection results on a real-time dashboard drawn directly on the chart. The indicator is based on the Mae Pla Green Pen trading methodology, which uses structured price action patterns to identify potential trade setups. Pattern Detection Three
FREE
This indicator is a zero-lag indicator and displays  strength of trend change . True Trend  Oscillator Pro works best in combination with True Trend Moving Average Pro that displays exact trend as is. Oscillator value is exact price change in given direction of the trend. True Trend Moving Average Pro: https://www.mql5.com/en/market/product/103586 If you set PERIOD input parameter to 1 this indicator becomes a sharpshooter for binary options. Developers can use True Trend Oscillator in Exper
FREE
Session Volatility Map
Strifor (Mauritius) Ltd
5 (7)
Session Volatility Map — indicador que mostra as principais sessões de trading (Ásia, Europa, EUA) diretamente no gráfico. Exibe automaticamente os limites das sessões e zonas de interseção, onde a volatilidade costuma ser maior. Desenha o intervalo High–Low de cada sessão, ajudando a identificar níveis de suporte e resistência. Destaca a sessão de trading atualmente ativa. Ajusta automaticamente horário de verão/inverno (Europa/EUA). Para quem é útil Scalpers — identificar moment
FREE
Reversal Composite Candles
MetaQuotes Ltd.
3.69 (16)
A ideia do sistema é a identificação de padrões de reversão utilizando o cálculo de candles compostos. Os padrões de reversão são semelhantes aos padrões "Martelo" e o " Homem Enforcado " da análise candlestick Japonesa, porém ele usa candles compostos em vez de uma única barra e não precisa do pequeno corpo numa composição para confirmar a reversão. Os parâmetros de entrada: Range - número máximo de barras, utilizada no cálculo de composição dos candles compostos . Minimum - tamanho mínimo dos
FREE
Fimathe PCM Indicador
Cristiano Rodrigo Olegini
5 (4)
Velas Forex FIMATHE PCM Indicator (FREE) (Créditos ao autor da estratégia: Marcelo Ferreira.) O Indicador PCM Indicator é um indicador gratuito desenvolvido para auxiliar traders na análise visual do mercado de forma simples, rápida e objetiva. Seu objetivo é facilitar a identificação das condições do mercado através de sinais claros, permitindo que o trader tome decisões com mais confiança durante suas operações. Melhor resultado xauusd : Timeframe 5M Hora servidor mt5: 2:00 Gerenciamento:
FREE
Daily Entry M1 – Indicador MT5 Daily Entry M1 é um indicador para MetaTrader 5 criado para traders que se concentram em oportunidades intradiárias de curto prazo no timeframe M1. O indicador analisa as condições do mercado e exibe setas claras de BUY e SELL diretamente no gráfico quando suas condições internas de entrada são confirmadas. O indicador foi desenvolvido para procurar possíveis zonas de reversão do mercado e tenta identificar entradas próximas de um topo ou fundo intradiário, ajudan
FREE
IQuantum
Evgeniy Scherbina
The indicator IQuantum shows trading signals for 10 symbols in the daily chart: AUDCAD, AUDUSD, EURUSD, GBPCAD, GBPCHF, GBPUSD, NZDUSD, USDCAD, USDCHF, and USDJPY. Signals of the indicator are produced by 2 neural models which were trained independently from one another. The inputs for the neural models are normalised prices of the symbols, as well as prices of Gold, Silver and markers of the current day. Each neural model was trained in 2 ways. The Ultimate mode is an overfitted neural model
FREE
AdaptiveRSiMt5
Francis Dube
3 (1)
The Relative strength index is an oscillator that follows price, it was introduced by Welles Wilder, who went on to recommend the 14 period RSI. This adaptive version is based on the indicator described by John Ehlers, in the book 'Rocket Science for Traders'. The indicator uses the homodyne descriminator to compute the dominant cycle. To apply the homodyne descriminator, real and imaginary parts have to be calculated from the Inphase and Quadrature components. (Inphase and Quadrature components
FREE
Stamina HUD
Michele Todesco
STAMINA HUD – Advanced Market & Trend Dashboard (MT5) STAMINA HUD   is a professional   market information panel   designed for traders who want   clarity, speed, and control   directly on the chart. It provides a   clean heads-up display (HUD)   with essential market data and   multi-timeframe trend direction , without cluttering the chart or generating trading signals. What STAMINA HUD Shows   Current Price   Spread (in real pips)   Today High–Low range (pips)   Average D
FREE
Trader’s Cockpit is a simple non directional dashboard for MetaTrader 5 designed to give traders a quick, clear view of their trading environment directly on the chart. Creator:  https://www.quant-atlas.com/ The indicator does not generate buy or sell signals, does not predict market direction, and does not perform any trading action. Its purpose is to make the trader’s daily workflow easier by centralizing useful account, symbol, spread, session, and broker condition information in one compact
FREE
Free automatic Fibonacci is an indicator that automatically plots a Fibonacci retracement based on the number of bars you select on the BarsToScan setting in the indicator. The Fibonacci is automatically updated in real time as new highest and lowest values appears amongst the selected bars. You can select which level values to be displayed in the indicator settings. You can also select the color of the levels thus enabling the trader to be able to attach the indicator several times with differe
FREE
LT Force
Thiago Duarte
5 (5)
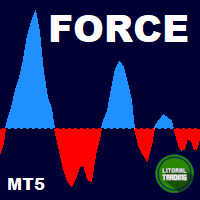
Para quem gosta de tendencia Force será um indicador muito útil. Isso por que ele é baseado no famoso ADX, que mede a força de uma tendencia, porém sem as 3 linhas confusas dele. Force tem sua interpretação muito simples: se o histograma estiver acima do nível zero a tendência é de alta, do contrário é queda. Você pode utilizá-lo para encontrar divergências também, algo muito lucrativo. Agradeço ao Andre Sens pela ideia da versão 1.1. Se tiver alguma dúvida ou sugestão, por favor, mecontate. Faç
FREE
Coral Indi
Dinh Duong Luong
Coral trend is   a trend-following indicator that is widely popular among FOREX traders . It is usually used as a confluence with other indicators. It uses combinations of moving averages with complex smoothing formulas! It has two configurable parameters: Coefficient   - smoothing ratio (*) Applied price Calculation: Coral = (-0.064) * B6 + 0.672 * B5 - 2.352 * B4 + 2.744 * B3
FREE
PRODUCT TITLE: Mindgame  SHORT DESCRIPTION (Max 150 chars): All-in-One professional indicator: 5 SMAs, Non-Repainting MACD Crossover Arrows, NY Session Shading, and Live HUD Dashboard for MT5. CATEGORY: Market > MetaTrader 5 > Indicators > Trend / Oscillators PRICE RECOMMENDATION: $39 - $59 (or Free with premium upgrade / rental options) ================================================================================ FULL PRODUCT DESCRIPTION (Copy-paste directly into MQL5 Market description
FREE
Value Chart Candlesticks
Flavio Javier Jarabeck
4.57 (14)
The idea of a Value Chart indicator was presented in the very good book I read back in 2020 , " Dynamic Trading Indicators: Winning with Value Charts and Price Action Profile ", from the authors Mark Helweg and David Stendahl. The idea is simple and the result is pure genius: Present candlestick Price analysis in a detrended way! HOW TO READ THIS INDICATOR Look for Overbought and Oversold levels. Of course, you will need to test the settings a lot to find the "correct" one for your approach. It
FREE
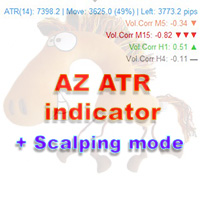
AZ ATR indicator (with volume correlation bonus) Standard ATR indicator, you can enable ignoring abnormally large candles. It is possible to change the location of the displayed text in 4 corners of the chart. You can change the calculation period (days ago). Bonus - the indicator has a correlation with volumes. Can be enabled to display a possible priority at the current moment in the market. What do the values ​​mean: Positive correlation (0.3 - 1.0): 0.3-0.7 - moderate connection
FREE
Friend of the trend : Seu Rastreador de Tendências Domine o mercado com o Friend of the trend , o indicador que simplifica a análise de tendências e te ajuda a identificar os melhores momentos para comprar, vender ou esperar. Com um design intuitivo e visualmente impactante, o Trend Analisa os movimentos de preço e entregar sinais através de um histograma colorido: Barras Verdes : Sinalizam uma tendência de alta, indicando oportunidades de compra. Barras Vermelhas : Alertam para uma tendência de
FREE
Os compradores deste produto também adquirem
Trend Sniper X
Sarvarbek Abduvoxobov
4.86 (43)
Trend Sniper X é um indicador de acompanhamento de tendência para múltiplos tempos gráficos no MetaTrader 5 que ajuda os traders a identificar a direção da tendência e potenciais pontos de reversão com clareza e precisão. para MT4: https://www.mql5.com/en/market/product/193245 Informações sobre o preço: O preço atual é promocional e está sujeito a alterações à medida que novas atualizações e funcionalidades forem lançadas. Oferta Bônus: Para obter o Auto-Trade Assistant EA GRATUITO para este in
Smart Trend Trading System — MetaTrader 5 Após a compra, envie-me uma mensagem no MQL5 para receber Smart Universal Expert Advisor GRÁTIS, além do curso online, do manual em PDF e do acesso ao grupo privado. O STTS reúne a direção da tendência, sinais de entrada e saída, zonas de reversão e níveis de preço importantes diretamente no seu gráfico. Siga o sistema manualmente ou conecte um EA compatível separado para executar operações automaticamente com as configurações que você escolher. UM SISTE
Um novo Rei chegou à cidade - Indicador + Gestão de Ordens (TP1 + TP2 + TP3) + Enviador opcional de sinais para Telegram INCLUÍDO (GRÁTIS) (SISTEMA COMPLETO DE TRADING e SINAIS) Nosso melhor EA para Ouro: Gold Slayer Este indicador inclui uma estratégia avançada, um sistema de trading com gestão de ordens personalizável e um sistema de reversão à média que combina extensões de envelopes, apoiado por múltiplos filtros inteligentes de confirmação, como o RSI, para capturar entradas de reversão de
Zoryk Gold
Reda El Koutbane
4.78 (18)
O desconto termina em 24 horas — próximo preço $ 69 ZORYK — Sistema avançado de sinais para XAUUSD no MetaTrader 5 Você conhece essa sensação. Você passa muito tempo analisando o ouro. Espera pela entrada certa. Finalmente abre a operação e o preço começa imediatamente a se mover contra você. Você fecha cedo demais, move o Stop Loss ou hesita por alguns segundos. Depois disso, o mercado alcança exatamente o destino que você esperava originalmente, mas sem você dentro da operação. O problema ne
Tenha sua vantagem no trading à vista! M5 Sniper é um novo indicador da MeanFX. Ele combina sinais de trading precisos com níveis adaptativos de TP/SL — criando, como resultado, as melhores operações estatísticas possíveis! O preço aumenta a cada 5 compras, o próximo preço é de 69$ Envie-me uma mensagem após a compra para receber dicas/guia e um EA bônus O que o faz se destacar? Desempenho estatístico comprovado no Gold XAUUSD ( funciona em praticamente todos os ativos , com foco em dominar um ú
Ultra Indicator
Ihor Otkydach
5 (1)
O ULTRA é um indicador técnico que funciona numa base «tudo-em-um» — analisa o mercado de forma independente, gera sinais de negociação, apresenta níveis para definir ordens de stop-loss e sugere quando encerrar as negociações para garantir lucros ou minimizar perdas. Por outras palavras, não importa se não sabe analisar o mercado, determinar níveis — onde definir o seu stop-loss — ou se tem dificuldades com a gestão do capital. O ULTRA fará tudo isso por si! BÓNUS PARA O COMPRADOR: Após adquiri
Em 2019, mostrei ao mundo inteiro do que este indicador é capaz. Operei os sinais dele manualmente, em uma conta real, às claras — a conta era monitorada no Myfxbook, e eu relatava o meu experimento em detalhes no Facebook. Resultado: 10.000 dólares se transformaram em 941.411 em quatro meses. O risco foi deliberadamente extremo — o drawdown chegou a 54%, afinal, na nossa profissão, lucro e risco sempre andam de mãos dadas. A captura de tela do Myfxbook é a primeira imagem da galeria. Parece que
SuperScalp Pro
Van Minh Nguyen
4.54 (37)
SuperScalp Pro - Professional Multi-Layer Confluence Scalping System O SuperScalp Pro é um indicador avançado de scalping que aprimora o Supertrend clássico com vários filtros inteligentes de confirmação. Ele ajuda a identificar oportunidades de Buy/Sell com maior probabilidade de sucesso, reduzindo significativamente os sinais falsos. Setas claras de Buy e Sell aparecem diretamente no gráfico, juntamente com os níveis de Stop Loss e Take Profit baseados em ATR, calculados automaticamente em tem
Gann Made Easy   é um sistema de negociação Forex profissional e fácil de usar, baseado nos melhores princípios de negociação usando a teoria do sr. W. D. Gann. O indicador fornece sinais precisos de COMPRA e VENDA, incluindo níveis de Stop Loss e Take Profit. Você pode negociar mesmo em movimento usando notificações PUSH. Entre em contato comigo após a compra para receber instruções de negociação e ótimos indicadores extras gratuitamente! Provavelmente você já ouviu muitas vezes sobre os método
SMC Intraday Formula
VividMind Digital Solutions
5 (26)
Vamos ser honestos primeiro. Nenhum indicador sozinho vai te tornar lucrativo. Se alguém te disser o contrário, está te vendendo um sonho. Qualquer indicador que mostre setas perfeitas de compra/venda pode ser feito para parecer impecável — basta dar zoom na parte certa da história e tirar um print das operações vencedoras. Nós não fazemos isso.  SMC Intraday Formula é uma ferramenta. Ela lê a estrutura do mercado para você, identifica as zonas de maior probabilidade de preço e mostra exatament
M1 Sniper MT5
Oleg Rodin
5 (7)
O   M1 SNIPER   é um sistema indicador de negociação fácil de usar. É um indicador de seta projetado para o período M1. O indicador pode ser usado como um sistema independente para scalping no período M1 e pode ser usado como parte do seu sistema de negociação existente. Embora este sistema de negociação tenha sido projetado especificamente para negociação no M1, ele também pode ser usado em outros períodos. Originalmente, desenvolvi este método para negociar XAUUSD e BTCUSD. Mas considero-o úti
GoldenX Entry MT5
VividMind Digital Solutions
5 (17)
GoldenX Entry é um indicador para MT5 com um algoritmo adaptativo Smart Entry Trend, um sistema de pontuação de sinais, um detector de regime de mercado e um filtro de volatilidade. Cada sinal inclui um nível de entrada calculado, três níveis de Take-Profit (TP1, TP2, TP3) e um nível de Stop-Loss. Ele é construído sobre múltiplas camadas analíticas projetadas para se adaptar a diferentes condições de mercado, combinando um sistema analítico multicamadas com um otimizador integrado e um sistema d
Gold Entry Sniper
Tahir Mehmood
5 (21)
Gold Entry Sniper – Painel ATR Multi-Tempo Profissional para Scalping e Swing Trading em Ouro Gold Entry Sniper é um indicador avançado para MetaTrader 5 projetado para fornecer sinais de compra/venda precisos para XAUUSD e outros ativos, com base na lógica de Trailing Stop ATR e análise multi-tempo . Ideal tanto para scalpers quanto para swing traders. Principais Recursos e Vantagens Análise Multi-Tempo – Veja a tendência de M1, M5 e M15 em um único painel. Trailing Stop Baseado em ATR – Níveis
Próxima Atualização — Versão 2.52 em Breve! [NOVO] Prepare-se para 4 Grandes Novos Recursos Projetados para Aprimorar sua Análise de Mercado e seu Fluxo de Trabalho de Trading Estamos levando a análise de mercado a um novo nível com 4 novos recursos desenvolvidos para atender às suas necessidades de trading. Apresentamos: 1. TRADE OVERVIEW DASHBOARD 2. CONFLUENCE AT ZONE 3. STRONG & WEAK HIGH/LOW 4. OTE 1. TRADE OVERVIEW DASHBOARD Um painel que ajuda você a compreender mais facilmente o panoram
Gold Trend Coach MT5
Cristhian Alexander Gaibor Cuasquer
5 (4)
Gold Trend Coach é um indicador de tendência para o ouro (XAUUSD) no MetaTrader 5 com sinais de compra e venda, stop loss e três take profit confirmados no fechamento da vela (não repinta), um coach que te guia da entrada até o TP3, um painel multi-timeframe e alertas no celular e no Telegram. Feito para scalping em M1 e M5 e intraday em M15 nas sessões de Londres e Nova York. BÔNUS: EA de auto-trading GRÁTIS para o Gold Trend Coach. Me envie uma mensagem depois da compra e eu envio o EA que ope
Atomic Analyst MT5
Issam Kassas
4.5 (64)
Atomic Analyst — MetaTrader 5 Após a compra, envie-me uma mensagem no MQL5 para receber Smart Universal Expert Advisor GRÁTIS, além do curso online, do manual em PDF e do acesso ao grupo privado. O Atomic Analyst reúne a ação do preço, a direção da tendência, sinais de entrada e saída, Stop Loss e vários níveis de Take Profit diretamente no seu gráfico. VEJA O SINAL. ENTENDA O CENÁRIO. O Atomic Analyst organiza sua análise em informações visuais claras: • Setas de compra e venda para identificar
Boba Analysis Suite
Trade Ready Solutions LLC
5 (2)
Boba Analysis Suite O Boba Analysis Suite é um indicador de análise para o MetaTrader 5. Reúne a estrutura do mercado, as zonas de preço relevantes e o contexto geral do mercado numa única visualização do gráfico. Desenvolvido a partir da experiência prática como trader e formador de traders, apoia um processo de análise estruturado: avaliar a direção do mercado, identificar níveis importantes e analisar vários períodos gráficos em conjunto. Análise em contexto O significado de cada sinal depend
Adaptive Price Action Engine Compre um indicador, ganhe o EA de graça Análise Auto-Otimizada de Tendências e Padrões de Candlestick em Múltiplos Timeframes Os mercados estão em constante mudança, e nem todos os padrões de Price Action têm o mesmo valor em todas as condições de mercado. O Adaptive Price Action Engine foi desenvolvido para se adaptar às mudanças nas condições do mercado, combinando estrutura de tendência, análise Multi-Timeframe, padrões de candlestick e otimização estatística em
Azimuth Pro
Ottaviano De Cicco
5 (7)
Azimuth Pro V2: Estrutura Fractal Sintética e Entradas Confirmadas para MT5 Visão geral Azimuth Pro é um indicador de estrutura swing multinível da Merkava Labs . Quatro camadas de swing aninhadas, VWAP ancorado em swings, detecção de padrões ABC, filtragem estrutural de três timeframes e entradas confirmadas em barra fechada — um gráfico, um fluxo de trabalho dos micro-swings aos macro-ciclos. Este não é um produto de sinais cegos. É um fluxo de trabalho baseado em estrutura para traders que v
Auto Optimized SpeedAngle é um sistema de vetorização de momentum de nível institucional que elimina o sobreajuste ( curve-fitting ) por meio da otimização contínua de avanço ( Walk-Forward Optimization , WFO). Em vez de depender de entradas estáticas que se degradam quando os regimes de mercado mudam, o indicador recalibra dinamicamente seus parâmetros utilizando validação fora de amostra ( Out-of-Sample , OOS), garantindo que os sinais exibidos representem vantagens estatísticas genuínas e não
Zain Gold Scalping
Ahmed Gamal Abdel Nasser Mohamed
A complete price-action analysis tool built around dual independent entry logic, each confirmed against a volatility band, combined with a configurable set of nine optional confirmation filters that let you shape exactly how conservative or aggressive the tool's signals behave. Core Strategy Two independent entry setups, each triggering only when price moves outside a dynamic volatility band — giving two distinct ways to spot potential reversal points, which can be used together or separately.
Tokyo mt5 Indicator
Vasiliy Strukov
5 (14)
O Tokyo Indicator oferece uma visão geral visual clara da direção da tendência, de possíveis sinais de negociação e das condições de mercado. Sua linha de tendência em degraus e codificada por cores distingue as fases de alta (azul) das fases de baixa (magenta). Setas direcionais correspondentes destacam possíveis oportunidades de compra e venda quando a tendência exibida muda. Um painel integrado reúne o sinal atual, o viés de mercado, o momentum, a volatilidade e a qualidade do sinal em uma v
FiboSniper Pro
Van Minh Nguyen
5 (4)
FiboSniper Pro – Multi-Filter Fibonacci System with Auto SL/TP and Control Panel FiboSniper Pro é um indicador técnico que combina Fibonacci Envelopes dinâmicos com vários filtros de confirmação para gerar sinais seletivos de Buy e Sell. Os níveis de Fibonacci são calculados com base em Moving Average e ATR e, em seguida, filtrados por ADX, EMA, RSI, ATR, Volume, Time e estrutura das velas. O indicador exibe diretamente no gráfico os níveis automáticos de Stop Loss e Take Profit baseados em ATR,
Quantum TrendPulse
Bogdan Ion Puscasu
5 (26)
Apresentando   Quantum TrendPulse   , a ferramenta de negociação definitiva que combina o poder do   SuperTrend   ,   RSI   e   Stochastic   em um indicador abrangente para maximizar seu potencial de negociação. Projetado para traders que buscam precisão e eficiência, este indicador ajuda você a identificar tendências de mercado, mudanças de momentum e pontos de entrada e saída ideais com confiança. Principais características: Integração SuperTrend:   siga facilmente a tendência predominante do
Superhero
Ihor Otkydach
5 (3)
O indicador SUPERHERO é um sistema de negociação multimoeda concebido numa base «tudo incluído». O indicador analisa o mercado de forma independente e fornece sinais sobre quando abrir e encerrar posições. Utiliza ordens Stop Loss e Take Profit. O rácio R:R é de 1:1. Este sistema pode enviar notificações push para o seu smartphone, para que possa realizar transações «em qualquer lugar», sem precisar de estar preso a um computador. É perfeito para empresas de negociação por conta própria. UM BÓNU
Indicador multimoedas de força e momentum MT5 Dynamic Forex28 Navigator é a evolução dos nossos indicadores populares de longa data e reúne a potência de três ferramentas numa só: Advanced Currency Strength28 Indicator (700 avaliações) Advanced Currency IMPULSE with ALERT (530 avaliações) CS28 Combo Signals (bónus atual) Os dois indicadores anteriores somam mais de 1.200 avaliações no MQL5 Market e são uma referência na comunidade MT4 desde 2016. O Dynamic Forex28 Navigator MT5 continua com a me
Trend Catcher ind mt5
Ramil Minniakhmetov
5 (18)
INDICADOR TREND CATCHER O Indicador Trend Catcher analisa os movimentos de preços do mercado, utilizando uma combinação de indicadores de análise de tendências adaptativos, proprietários e personalizados pelo autor. Identifica a verdadeira direção do mercado, filtrando o ruído de curto prazo e focando a força do momentum subjacente, a expansão da volatilidade e o comportamento da estrutura de preços. Utiliza também uma combinação de indicadores personalizados de suavização e filtragem de tendê
Apex Patterns PRO Compre o indicador - Obtenha um Expert Advisor baseado nele GRATUITAMENTE. Inteligência Auto-otimizada de Padrões e Rompimentos Os rastreadores de padrões tradicionais dependem de entradas fixas, frequentemente apresentando baixo desempenho quando a volatilidade e as estruturas do mercado mudam. O Apex Patterns PRO foi projetado para se adaptar às mudanças nas condições do mercado, combinando o reconhecimento estrutural de padrões de gráfico, filtragem de momentum e auto-otimi
Neuro Poseidon MT5
Daria Rezueva
4.75 (52)
Neuro Poseidon is a new indicator by Daria Rezueva. It combines precise trading signals with adaptive TP/SL levels - creating best possible trades as a result! Message me and get  Neuro Poseidon Assistant  as a gift to automize your trading process! What makes it stand out? 1. Proven profitability on all assets and timeframes 2. Only confirmed BUY and SELL signals present on the chart 3. Adaptive TP & SL levels generated by the software for each trade 4. Easy to understand - suitable for al
Crystal Heikin Ashi Signals
Muhammad Jawad Shabir
5 (5)
Crystal Heikin Ashi Signals—Professional Trend & Signal Detection Indicator Advanced Heikin Ashi Visualization with Intelligent Signal System for Manual & Automated Trading Final Price: $149 ---------> Price goes up $10 after every 10 sales . Limited slots available — act fast . Overview User Guide PDF Crystal Heikin Ashi Signals is a professional-grade MetaTrader 5 indicator that combines pure Heikin Ashi candle visualization with an advanced momentum-shift detection system. Designed for both m
Mais do autor
Where is price in the range - premium, discount or in the OTE zone? This indicator draws it, alerts you, and checks on your own chart what price did next. ICT Premium Discount OTE Honest Stats draws the current dealing range with premium, discount, equilibrium (50%) and the optimal trade entry zone (62-79%), alerts you when price reaches the OTE zone, and measures on that chart's own history how often price then went on with the leg, next to random candles. Free, part of the Honest Stats series.
FREE
Most liquidity indicators draw the lines. This one also checks whether price respects them. ICT Liquidity Levels Honest Stats draws the levels ICT traders watch: previous day high and low, previous week high and low, and the Asian range high and low. A table measures on your own chart how often price reached each level and how often it turned back there, next to random lines nearby. Free, part of the Honest Stats series. MT4 version | ICT Killzones Honest Stats (free) | ICT FVG Honest Stats (fre
FREE
Most FVG indicators draw boxes. This one also checks whether the boxes work. ICT Fair Value Gap FVG Honest Stats draws every fair value gap on your chart and measures, on that chart's own history, how often price came back to a gap and how often the gap held, next to fake boxes of the same size. Free, part of the Honest Stats series. MT4 version | ICT Killzones Honest Stats (free) | ICT Liquidity Levels Honest Stats (free) | ICT SMT Divergence Honest Stats (free) | TrueRisk Trade Panel (free) NE
FREE
Trade the ICT Silver Bullet hours without watching the clock. This indicator draws the three windows, waits for the liquidity sweep and the first fair value gap after it, alerts you, and checks on your own chart what price did next. ICT Silver Bullet Honest Stats marks the London (03:00-04:00), New York AM (10:00-11:00) and New York PM (14:00-15:00) Silver Bullet windows in New York time, draws the liquidity of the two hours before each window, shows when the window sweeps it, and marks the firs
FREE
See which fair value gaps flipped sides. This indicator marks every inversion fair value gap (IFVG) - a gap that a candle closed straight through - signals and alerts when price comes back to it and respects it, and checks on your own chart what price did next. ICT Inversion Fair Value Gap IFVG Honest Stats finds fair value gaps, waits for a candle to close through one and turns it into an inversion gap on the other side: a bearish gap closed above becomes bullish support, a bullish gap closed b
FREE
Most liquidity indicators draw the lines. This one also checks whether price respects them. ICT Liquidity Levels Honest Stats draws the levels ICT traders watch: previous day high and low, previous week high and low, and the Asian range high and low. A table measures on your own chart how often price reached each level and how often it turned back there, next to random lines nearby. Free, part of the Honest Stats series. MT5 version | ICT Killzones Honest Stats MT4 (free) | ICT FVG Honest Stats
FREE
Where is price in the range - premium, discount or in the OTE zone? This indicator draws it, alerts you, and checks on your own chart what price did next. ICT Premium Discount OTE Honest Stats draws the current dealing range with premium, discount, equilibrium (50%) and the optimal trade entry zone (62-79%), alerts you when price reaches the OTE zone, and measures on that chart's own history how often price then went on with the leg, next to random candles. Free, part of the Honest Stats series.
FREE
Order blocks from any timeframe, with alerts - and a table that tells you honestly whether they work on your chart. ICT Order Blocks Honest Stats draws order blocks from this or a higher timeframe, marks each one fresh, tested or broken, alerts you when price comes back to a fresh block, and measures on your chart's own history how often the blocks held next to fake zones of the same size. Free, part of the Honest Stats series. Market Structure (free) | MT4 version (free) | Free: FVG Honest Stat
FREE
See which fair value gaps flipped sides. This indicator marks every inversion fair value gap (IFVG) - a gap that a candle closed straight through - signals and alerts when price comes back to it and respects it, and checks on your own chart what price did next. ICT Inversion Fair Value Gap IFVG Honest Stats finds fair value gaps, waits for a candle to close through one and turns it into an inversion gap on the other side: a bearish gap closed above becomes bullish support, a bullish gap closed b
FREE
ICT market structure from any timeframe - HH, HL, LH, LL, every BOS and CHoCH, with alerts - and a table that measures how often price really followed each break on your chart. ICT Market Structure Honest Stats labels every swing high and low, draws each break of structure (BOS) and change of character (CHoCH), shows the levels the next break needs, alerts you the moment a new break forms, and measures on your chart's own history how often price went on in the break's direction compared with ran
FREE
Most SMT indicators mark the divergences. This one also checks whether they work. ICT Correlation SMT Divergence Honest Stats compares your chart with a related market (gold with silver, EURUSD with GBPUSD, BTC with ETH, US500 with US100) and marks every SMT divergence. A table measures on your own chart whether price turned after an SMT more often than after a normal new high or low. Free, part of the Honest Stats series. MT4 version | ICT Killzones Honest Stats (free) | ICT FVG Honest Stats (f
FREE
Most killzone indicators draw boxes. This one checks whether the boxes work. Asia, London open, New York open and London close drawn automatically A table on your chart measures how often the day's high or low really formed inside each killzone, next to what pure chance would give Free. Check the numbers before you trust any killzone strategy MT4 version (free) | ICT FVG Honest Stats (free) | ICT Liquidity Levels Honest Stats (free) | ICT SMT Divergence Honest Stats (free) | TrueRisk Trade Panel
FREE
Most FVG indicators draw boxes. This one also checks whether the boxes work. ICT Fair Value Gap FVG Honest Stats draws every fair value gap on your chart and measures, on that chart's own history, how often price came back to a gap and how often the gap held, next to fake boxes of the same size. Free, part of the Honest Stats series. MT5 version | ICT Killzones Honest Stats MT4 (free) | ICT Liquidity Levels Honest Stats MT4 (free) | ICT SMT Divergence Honest Stats MT4 (free) | TrueRisk Trade Pan
FREE
Order blocks from any timeframe, with alerts - and a table that tells you honestly whether they work on your chart. ICT Order Blocks Honest Stats draws order blocks from this or a higher timeframe, marks each one fresh, tested or broken, alerts you when price comes back to a fresh block, and measures on your chart's own history how often the blocks held next to fake zones of the same size. Free, part of the Honest Stats series. Market Structure MT4 (free) | MT5 version (free) | Free: FVG Honest
FREE
Most killzone indicators draw boxes. This one also checks whether the boxes work. ICT Killzones Honest Stats for MetaTrader 4 draws the four ICT killzones (Asia, London open, New York open, London close) and measures on your own chart how often the day's high or low really formed inside each one, next to what pure chance would give, and how often the London Judas swing really reverses. Free, part of the Honest Stats series. MT5 version | ICT FVG Honest Stats MT4 (free) | ICT Liquidity Levels Hon
FREE
ICT market structure from any timeframe - HH, HL, LH, LL, every BOS and CHoCH, with alerts - and a table that measures how often price really followed each break on your chart. ICT Market Structure Honest Stats labels every swing high and low, draws each break of structure (BOS) and change of character (CHoCH), shows the levels the next break needs, alerts you the moment a new break forms, and measures on your chart's own history how often price went on in the break's direction compared with ran
FREE
Free. Set your risk, click Buy or Sell, done. TrueRisk Trade Panel works out the lot size for you. Type how much of your account you want to risk (for example 1%), set the stop loss in points or drag it on the chart, and the BUY and SELL buttons already show the right lot. No lot calculator, no guessing, no trade that risks ten times more than you meant. TrueRisk Account Dashboard MT4 (free) | TrueRisk Symbol Changer MT4 (free) | MT5 version | All TrueRisk tools NEW (free): a picture of every tr
FREE
Free. One click to switch the chart to another symbol. TrueRisk Symbol Changer puts your symbols on the chart as buttons, each with today's % change in green or red. Click one and the chart switches to it, keeping your timeframe, your template and your other indicators. One row of timeframe buttons (M1 to MN) does the same for the timeframe. No more right-click, Symbols, find, drag. MT4 version (free) | TrueRisk Account Dashboard (free) | TrueRisk Trade Panel (free) | All TrueRisk tools Symbols
FREE
Most SMT indicators mark the divergences. This one also checks whether they work. ICT Correlation SMT Divergence Honest Stats compares your chart with a related market (gold with silver, EURUSD with GBPUSD, BTC with ETH, US500 with US100) and marks every SMT divergence. A table measures on your own chart whether price turned after an SMT more often than after a normal new high or low. Free, part of the Honest Stats series. MT5 version | ICT Killzones Honest Stats MT4 (free) | ICT FVG Honest Stat
FREE
Trade the ICT Silver Bullet hours without watching the clock. This indicator draws the three windows, waits for the liquidity sweep and the first fair value gap after it, alerts you, and checks on your own chart what price did next. ICT Silver Bullet Honest Stats marks the London (03:00-04:00), New York AM (10:00-11:00) and New York PM (14:00-15:00) Silver Bullet windows in New York time, draws the liquidity of the two hours before each window, shows when the window sweeps it, and marks the firs
FREE
Free. Set your risk, click Buy or Sell, done. TrueRisk Trade Panel works out the lot size for you. Type how much of your account you want to risk (for example 1%), set the stop loss in points or drag it on the chart, and the BUY and SELL buttons already show the right lot. No lot calculator, no guessing, no trade that risks ten times more than you meant. MT4 version (free) NEW (free): a picture of every trade, saved by itself. TrueRisk Trade Journal saves a chart picture when a trade opens and w
FREE
How much room does gold have left today? This indicator shows the average daily range (ADR) of XAUUSD, how much of it today has already used, where today's ADR high and ADR low are, and how often past days that got this far went on to the full range. Gold ADR Daily Range Meter draws today's ADR high and ADR low on the chart, fills a bar as the day uses its range and alerts you when the day has used its full ADR. A table counts on your own daily history what usually happens next: once a day had u
FREE
Manual Copy your trades to every account, MT4 and MT5, each sized to its own risk TrueRisk Trade Copier copies trades between MetaTrader 4 terminals, and between MetaTrader 4 and MetaTrader 5 (with the MT5 version), on the same computer or VPS: from the account you trade to your other accounts, to a prop-firm challenge, or from a personal account to a funded one. Each receiving account sizes every copy to its own risk % from the sender's stop loss, and never lets a copy's stop break that account
Manual TrueRisk Account Guard Pro watches your whole MetaTrader 4 account and steps in before a prop firm's loss limit is breached. On top of the daily and maximum loss limits it caps the loss on each trade, adds missing stop losses, limits how much you trade and closes everything before the weekend. Firm presets: FTMO 2-Step, FTMO 1-Step, FundedNext Stellar 2-Step, The5ers High Stakes, or your own rules Daily reset in the firm's own time zone (Prague, New York, UTC or server time), summer time
Manual TrueRisk Trade Manager is a one-click trading panel for MetaTrader 4. You set your risk in percent and the stop loss; the panel works out the lot size, checks that the stop can't take you past your daily or maximum loss limit, opens the trade and then manages it for you: partial close, break-even and trailing stop. Lot size from your risk %, cut to the room left before your loss limits Partial close, break-even and trailing stop in R, automatically Stop loss and lot size for trades you op
Every ICT idea in one indicator - market structure, order blocks, fair value gaps, premium / discount and OTE, liquidity sweeps, killzones and SMT - added up into one confluence score, with alerts and a multi-symbol scanner. Try it free first: press Free Demo and run it in the Strategy Tester (visual mode) - the panel, zones, signals and scanner all work there. ICT Pro Honest Stats draws all of it on your chart, checks every closed candle against nine ICT factors, shows the bullish and bearish s
Manual A hard daily loss limit for any account: your own money or a prop challenge. Set your daily and maximum loss limit once. Before either is reached it closes every position and locks trading: all symbols, all EAs, manual and phone trades Per-trade loss cap, automatic stop loss, max trades per day, news lock, Friday close: the rules most traders write down and then break Trading a challenge? Pick FTMO, FundedNext or The5ers and the limits load the way that firm counts them, with the right re
Manual Risk-based lot size, stop and target in one click. On any account. Set your stop, click Buy or Sell: the lot comes from your risk %. On an account with loss limits it is also cut to the room left before your daily and maximum loss limit. Ordinary trade panels only do the first part Partial close, break-even and trailing stop then run by themselves Trades opened on your phone get a stop loss and are cut to your risk % by the desktop manager (MT5 mobile has no lot calculator) Account protec
Manual Copy your trades to every account, each sized to its own risk TrueRisk Trade Copier copies trades between MetaTrader 5 terminals on the same computer or VPS: from the account you trade to your other accounts, to a prop-firm challenge, or from a personal account to a funded one. Each receiving account sizes every copy to its own risk % from the sender's stop loss, and never lets a copy's stop break that account's daily or maximum loss limit. MT4 version | TrueRisk Account Guard Pro (the gu
Every ICT idea in one indicator - market structure, order blocks, fair value gaps, premium / discount and OTE, liquidity sweeps, killzones and SMT - added up into one confluence score, with alerts and a multi-symbol scanner. Try it free first: press Free Demo and run it in the Strategy Tester (visual mode) - the panel, zones, signals and scanner all work there. ICT Pro Honest Stats draws all of it on your chart, checks every closed candle against nine ICT factors, shows the bullish and bearish s
Filtro:
Sem comentários
Responder ao comentário