Blahtech VWAP MT5
- Indicadores
-
Blahtech Limited
 Professional IT developer with over 20 years of experience working with top tier investment banks (Barclays Capital, Credit Suisse, Merrill Lynch, ABN Amro, Mizuho Bank) - LinkedIn profile available on request
 - Versão: 1.7
- Atualizado: 8 agosto 2024
- Ativações: 8
Was: $69 Now: $49
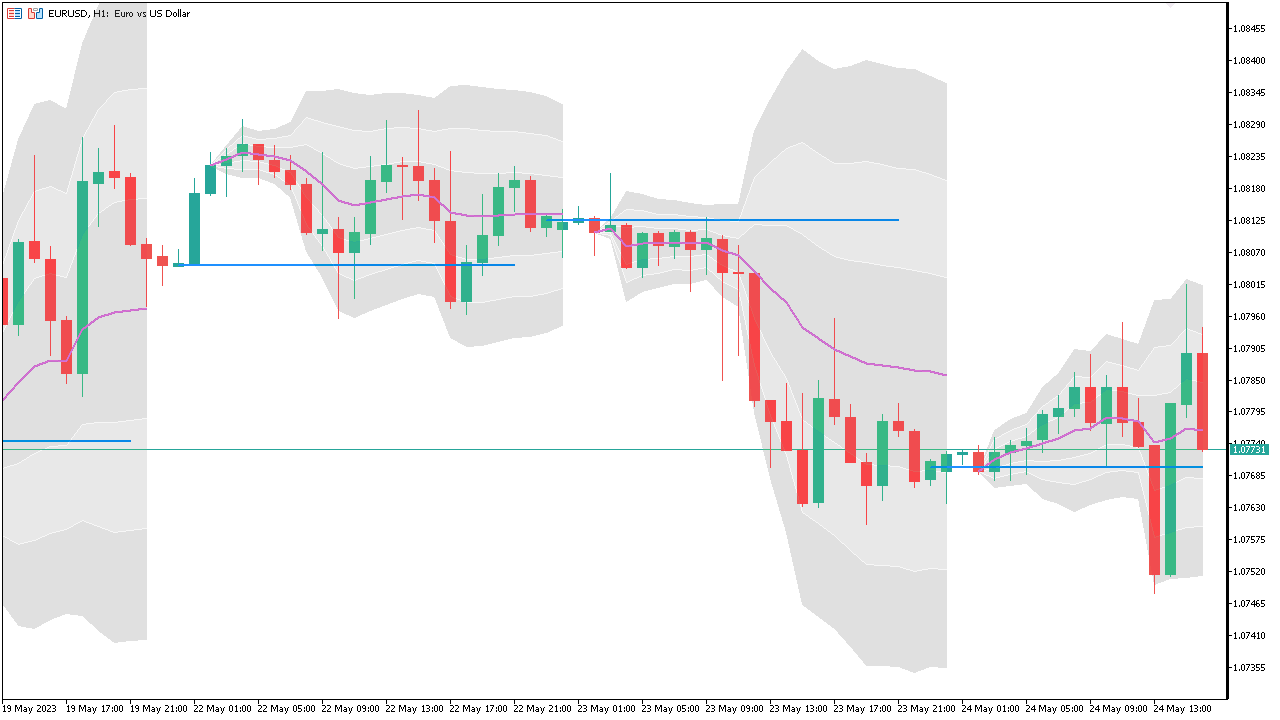
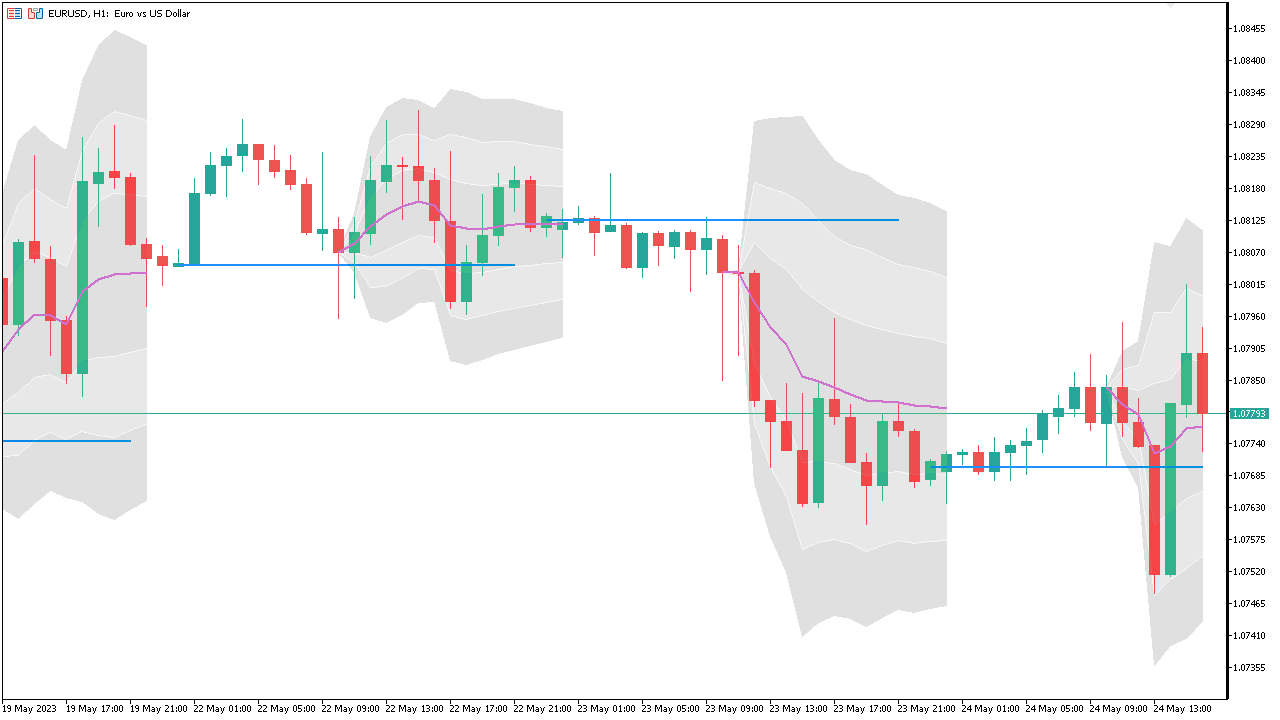
Blahtech VWAP - Volume Weighted Average Price (VWAP) is the ratio of price to total volume. It provides an average price over a specified time interval.
Links [ Install | Update | Documentation ]
Feature Highlights
- Configurable VWAP Line
- Sessions, intervals, anchored or continuous
- Previous day settlement line
- Standard Deviation bands
- Alerts at bar close or real time
- Automatic Broker or Tick volumes
- Significantly reduced CPU usage
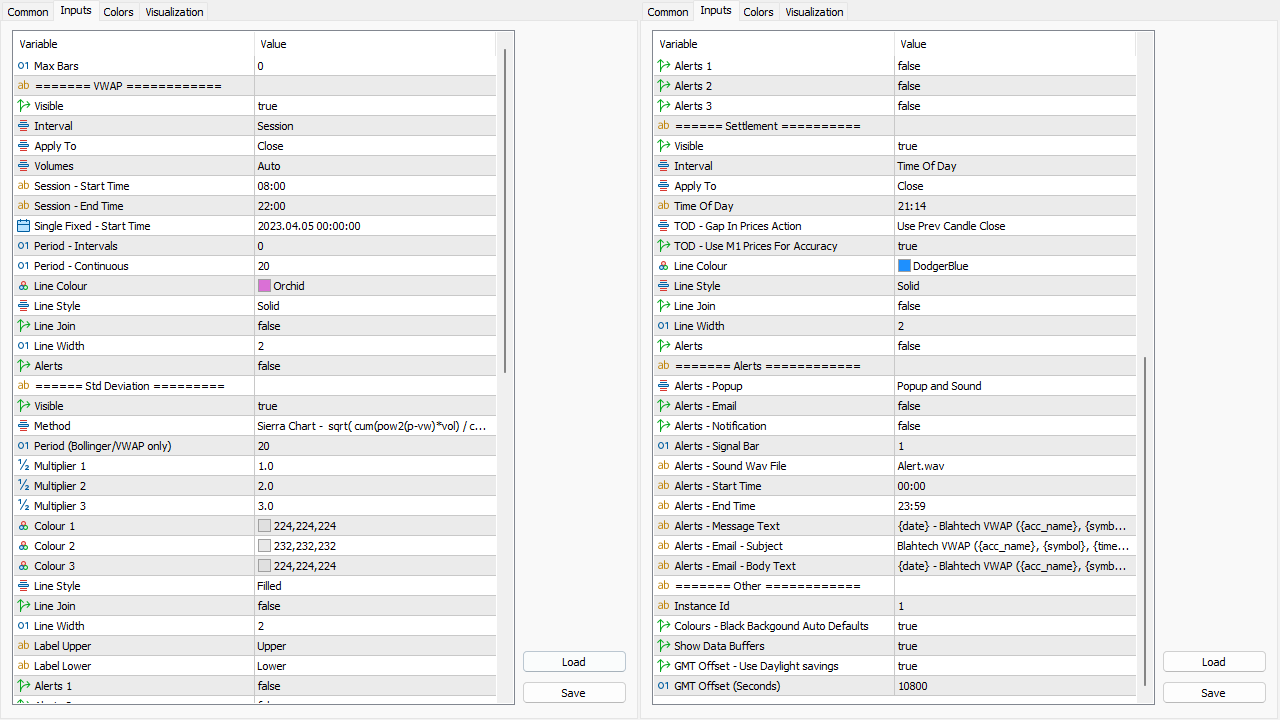
Input Parameters
- Expert Advisor Mode - Reserved for iCustom calls
- Max Bars - Restrict the number of bars back to plot the (Default 0 = plot all bars)
VWAP
- Visible - Show / Hide line on the chart
- Interval - Select the repeating duration
- Session
- Daily
- Weekly
- Monthly
- Quarterly
- Yearly
- Single Anchored
- Continuous
- Apply To - Select the price to use for the VWAP calculations
- Volumes - Real broker or tick volumes
- Session - Start Time - Set start time (Only used for Session Interval above)
- Session – End Time - Set end time (Only used for Session Interval above)
- Single Anchored – Start Time - Set the start time of the single anchored session (Only used for Single Anchored Interval above)
- Period - Intervals - Set averaging period for the intervals (Session, Daily, Weekly, Monthly, Quarterly, Yearly, Single)
- Period - Continuous - Set averaging period for the continuous interval (default 20)
- Line Join - Break (or join) the line for one bar between each interval on the chart
- Alerts
Std Deviation
- Visible
- Method
- Sierra Chart
- TradingView
- Bollinger
- VWAP Curve
- Percentage
- Period
- Multiplier 1, 2, 3
- Colour 1, 2, 3
- Line Style
- Line Join
- Line Width
- Label Upper
- Label Lower
- Alerts 1, 2, 3
Settlement
- Visible
- Interval
- Apply To
- Time Of Day
- TOD – Gap In Prices Action
- TOD – Use M1 prices for accuracy
- Line Colour
- Line Style
- Line Join
- Line Width
- Alerts
Alerts
- Alerts – Popup
- Alerts – Email
- Alerts – Notification
- Alerts – Start Time
- Alerts – End Time
- Alerts – Message Text
- Alerts – Email – Subject
- Alerts – Email – Body Text
Other
- Instance Id
- HotKeysMap
- HotKeysReservedKeys
- AnchoredClickModifier
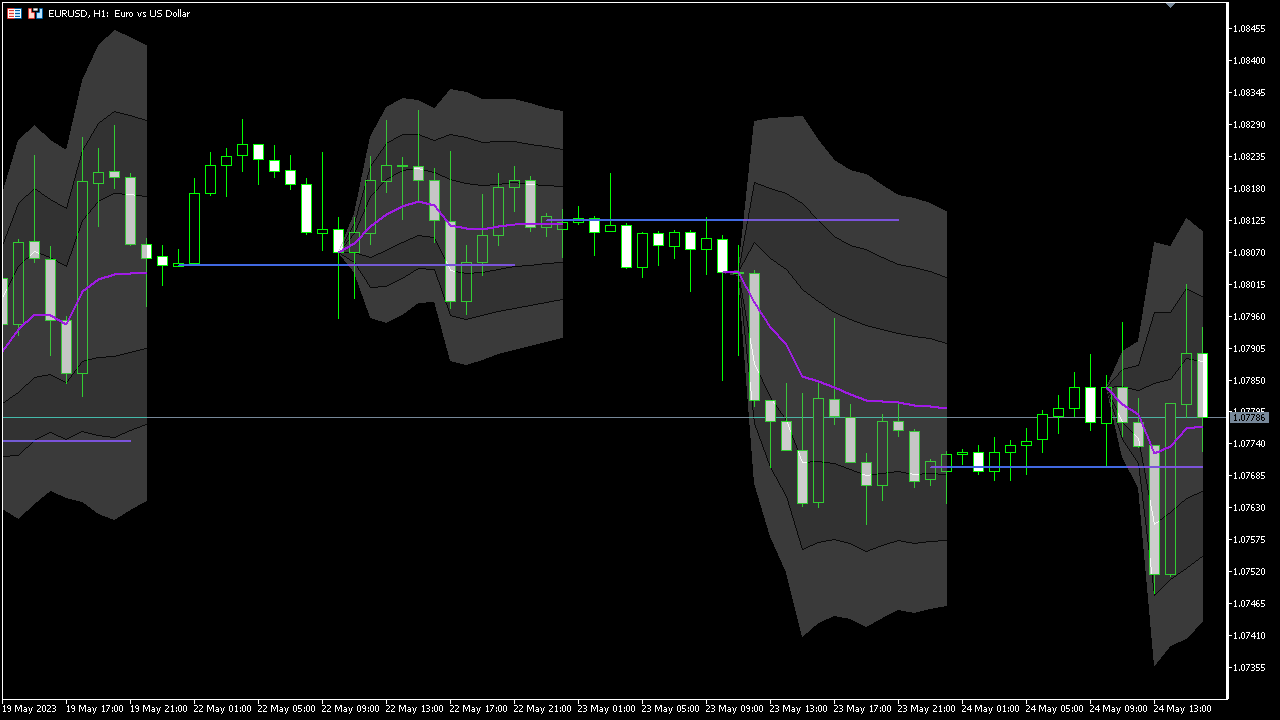
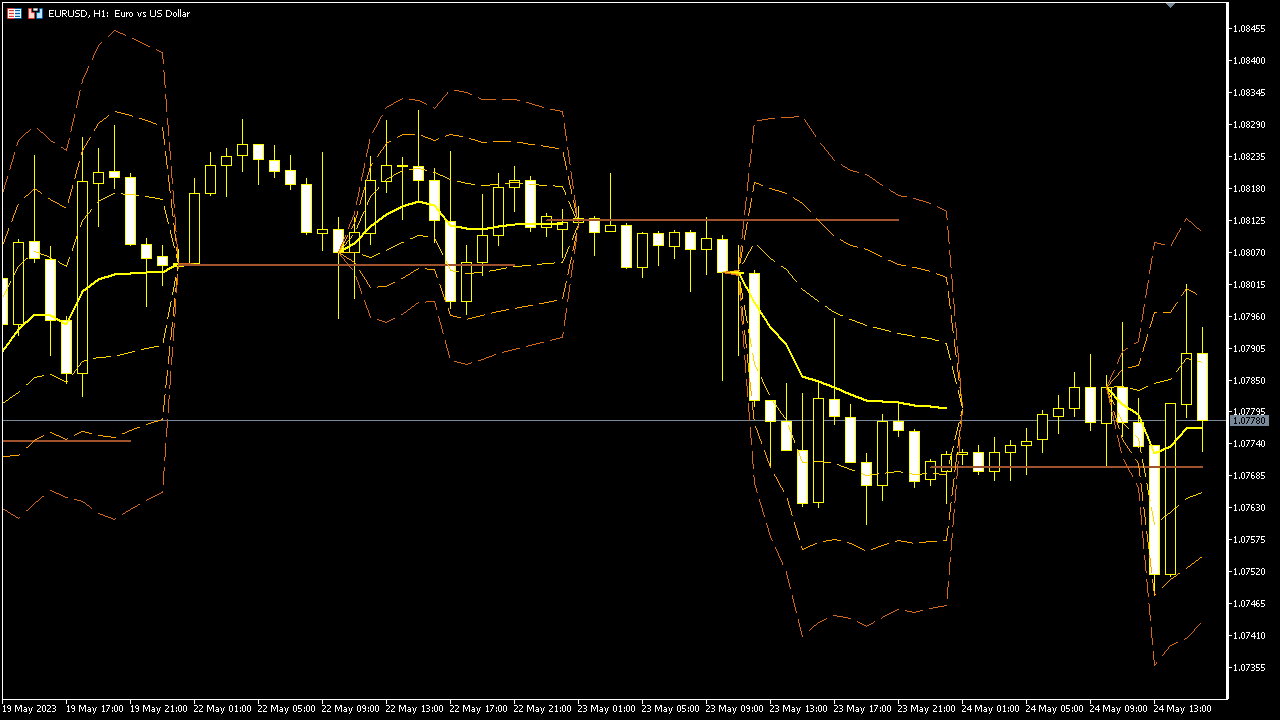
- Colours - Black Backgound Auto Defaults
- Show Data Buffers
- GMT Offset
- GMT Offset (Seconds)

After getting the MT4 version, I had to nab this one as well. It works great for with my AMP futures account, trading NAS and DOW intraday. Now my setups in both platforms are identical.