Horizontal Channel Alert with Custom Fibo
- Indicadores
- Versão: 2.0
- Atualizado: 4 fevereiro 2026
- Ativações: 20

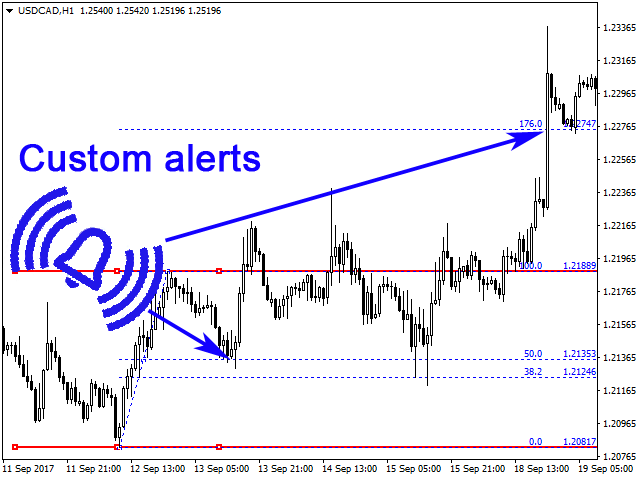
O indicador foi criado para construir canais horizontais e zonas de sinal, detectar rompimentos de extremos, rejeitos e objetivos com base em níveis de Fibonacci personalizáveis (com ou sem alertas sonoros). Ele aplica automaticamente os níveis de Fibonacci escolhidos a esses extremos. Quando o preço rompe os níveis de Fibonacci ativados nas configurações, o indicador pode emitir som, exibir uma mensagem, enviar uma notificação push para o terminal móvel ou um e-mail (se ativado).
Recursos:
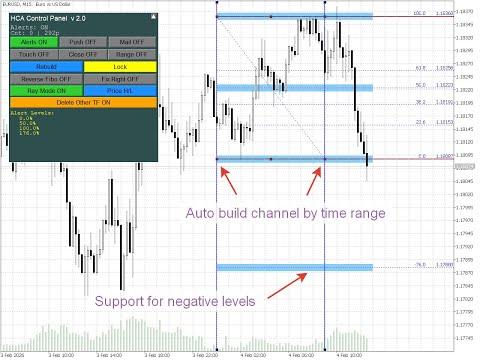
- construção automática do canal por intervalo de tempo, por ex. para detectar rompimento do range noturno
- acompanhamento automático de novos rejeitos
- inverter a escala de níveis de Fibonacci
- mostrar/ocultar/recolher o painel de controle
- escolher um dos 5 idiomas da interface do painel
- adicionar tolerância aos níveis de Fibonacci para que virem zonas de sinal mais largas em vez de linhas
- desenhar níveis horizontais e Fibonacci em vários timeframes, mantendo ou apagando canais de outros timeframes
- construir canais por preços High/Low ou Open/Close; o canal se ajusta aos preços automaticamente
- bloquear o canal (torná-lo não selecionável) para evitar exclusão acidental
Configurações
--------- Idioma -----------
- Interface Language — Idioma do painel do indicador. English (inglês), Russian (russo), Spanish (espanhol), German (alemão), Italian (italiano).
--------- Configurações -----------
- Auto build channel by time range (broker time) — Construir canal automaticamente por intervalo de tempo (hora do corretor)
- Time range HH:MM-HH:MM — Intervalo de tempo (início–fim)
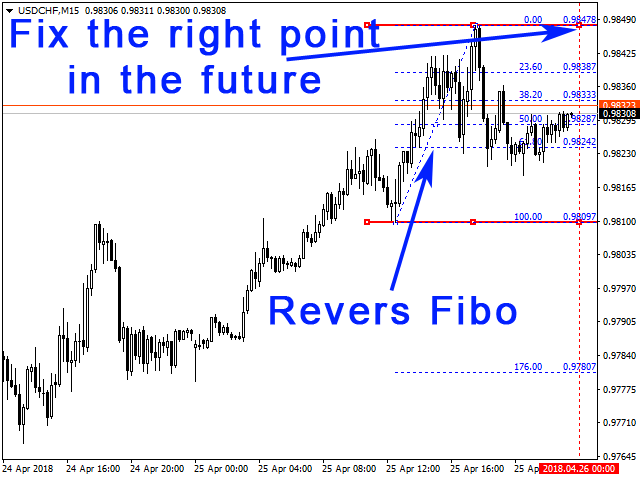
- Reverse Fibo — Inverter escala de Fibonacci
- Fix the right point in the future (ignored when FixByTime) — Fixar a borda direita no futuro (ignorado quando «Auto build channel by time range» está ativo)
- Color Channel — Cor do canal
- Color Fibo lines — Cor das linhas de Fibonacci
- Channel Width — Espessura das linhas do canal em pixels
- Channel Length, bars — Comprimento do canal em barras
- Channel ray — Desenhar canal em raio
- Price Mode — Modo de preço: High/Low ou Open/Close
- Delete channels from other TF — Excluir canais de outros timeframes
- Lock channel (prevent line movement) — Bloquear canal (impedir mover linhas)
- Log channel auto-update (Experts tab) — Registrar atualização automática do canal (aba Especialistas)
--------- Painel de controle -----------
- Show control panel — Mostrar painel de controle
- Panel X position (pixels from left edge) — Posição X do painel (pixels da borda esquerda)
- Panel Y position (pixels from top) — Posição Y do painel (pixels do topo)
- Panel width (pixels) — Largura do painel (pixels)
- Panel height (pixels) — Altura do painel (pixels)
--------- Configurações de alertas -----------
- Alerts — Ativar/desativar alertas
- Send Notifications — Enviar notificações
- Send alerts to e-mail — Enviar alertas por e-mail
- Alert only on first touch of level (for each direction) — Alerta apenas no primeiro toque do nível (por direção)
- Alert on candle close above/below level — Alerta no fechamento da vela acima/abaixo do nível
- Time-based alerts (N bars inside level range) — Alertas por tempo (N barras dentro do intervalo de níveis)
- Bottom level of range, % — Nível inferior do intervalo de alertas por tempo, % (padrão 38,2)
- Top level of range, % — Nível superior do intervalo de alertas por tempo, % (padrão 61,8)
- Number of consecutive bars inside range — Número de barras consecutivas dentro do intervalo de alertas por tempo
- Limit Alerts — Limite de alertas
--------- Marcadores de alertas -----------
- Show alert markers on chart — Mostrar marcadores de alertas no gráfico
- Alert marker color — Cor do marcador de alerta
- Marker size (1-5) — Tamanho do marcador (1–5)
- Maximum number of markers (0 = unlimited) — Número máximo de marcadores (0 = ilimitado)
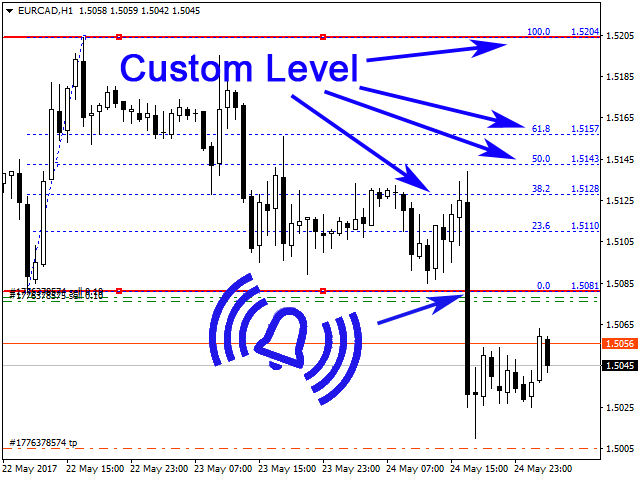
---- Linhas Fibo personalizadas (-1 = desativar) ----
- Level 0 … Level 29, % — Valores para o nível 0 … nível 29, %
- Alert level 0 … Alert level 29 — Ativar/desativar alertas para o nível 0 … nível 29
- Level 0 name … Level 29 name — Rótulo do nível 0 … nível 29
Dicas.
- Para mover o canal para a esquerda ou direita sem alterar o tamanho, arraste a parte central da linha superior ou inferior do canal.
- Para alongar ou encurtar o canal, arraste a extremidade esquerda ou direita da linha superior ou inferior do canal até a posição desejada e solte.
- Se após arrastar uma borda do canal a linha ficar desalinhada, clique em qualquer ponto do gráfico com o botão esquerdo do mouse e o canal e os níveis de Fibonacci se realinharão.
- Para inverter a escala de Fibonacci, ative Reverse Fibo.
- Para acompanhar rejeitos automaticamente, ative Fix the right point in the future. A borda esquerda do canal permanece fixa; a direita acompanha a nova barra.
- Se a construção automática do canal por tempo estiver ativa (ex.: para rompimento de um range), o canal só é reconstruído automaticamente por tempo; para ajustar manualmente, desative essa opção.
- Com Delete channels from other TF = false, ao mudar de timeframe os canais existentes são mantidos e um novo canal é adicionado no timeframe selecionado. Com Delete channels from other TF = true (padrão), ao mudar de timeframe os canais antigos são removidos e apenas o novo canal no novo timeframe é desenhado.
- Se você usar notificações push, não recomendamos definir Limit Alerts muito alto ou ilimitado, pois muitas notificações push de uma conta podem fazer o serviço MetaTrader bloquear o envio.


O usuário não deixou nenhum comentário para sua avaliação