Volume Bubbles version MT5
- Indicadores
- Versão: 1.11
- Ativações: 5

Volume Bubbles
See the volume outliers and divergence bars — before they reverse on you.
Volume Bubbles — on-chart volume spike detector with divergence arrows.
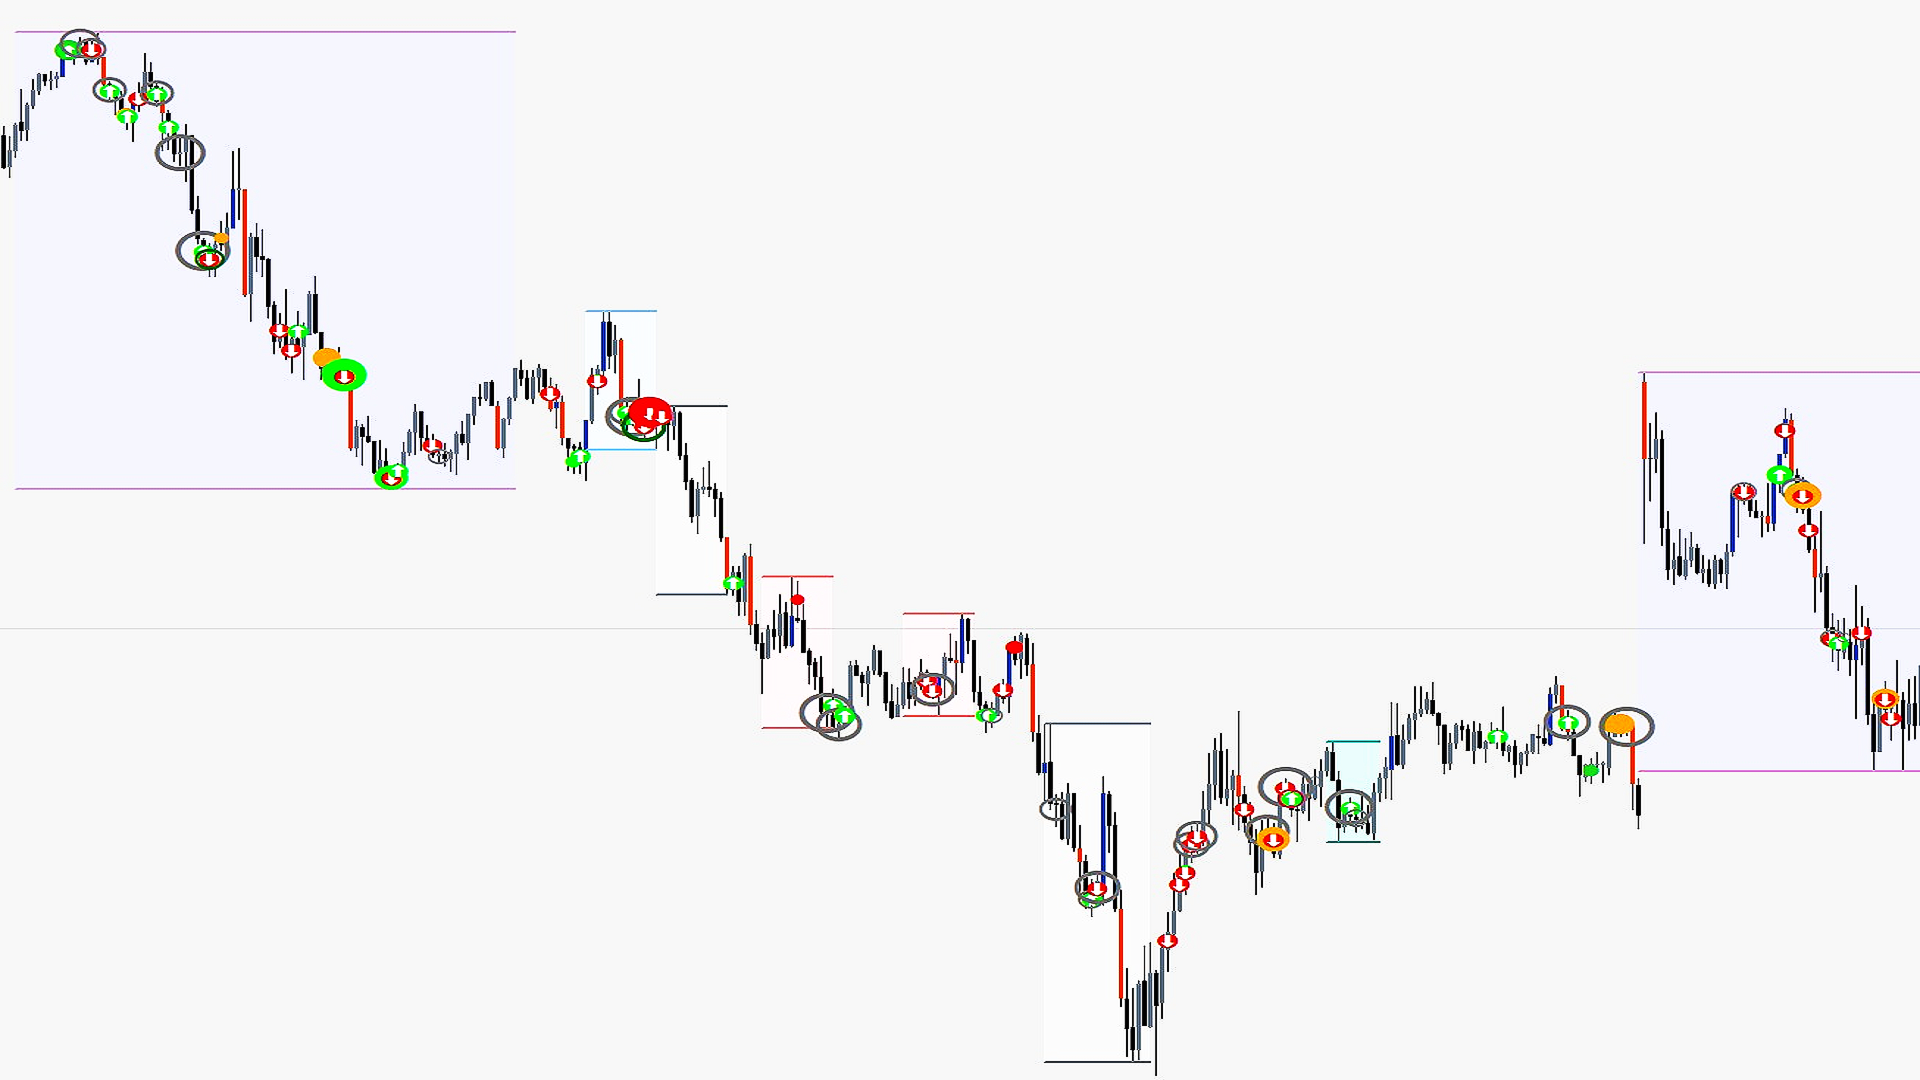
Most volume tools dump a histogram at the bottom of your screen and leave you to guess which bars actually mattered. Volume Bubbles puts the answer directly on the chart: a bubble on the bar, sized by how unusual the volume was, colored by what that volume means, with an arrow when the volume story disagrees with the price story.
What you see
- A bubble on outlier bars only. Routine bars stay clean. Only the bars that statistically stand out from recent volume behavior get a bubble.
- Bubble size = strength of the spike. Bigger bubble = more unusual volume relative to recent history. You read the chart with your eye, not with a spreadsheet.
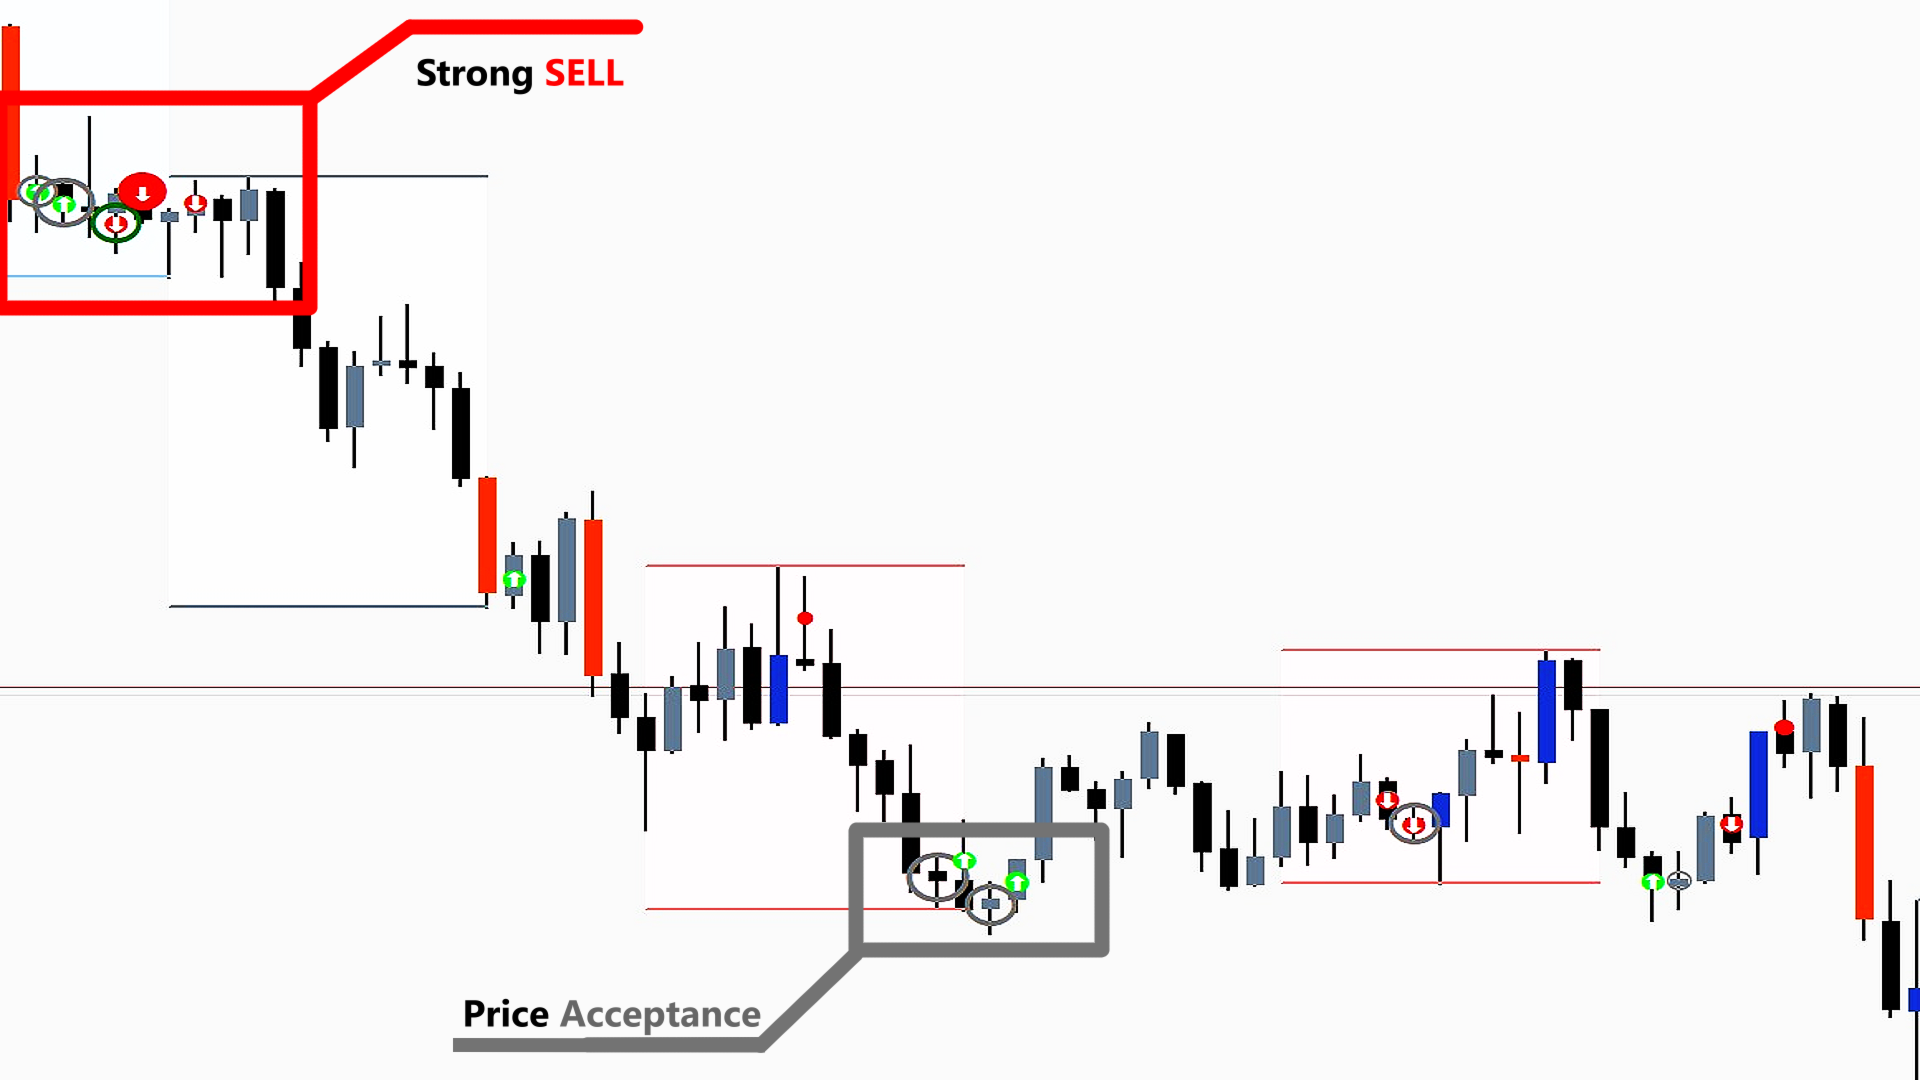
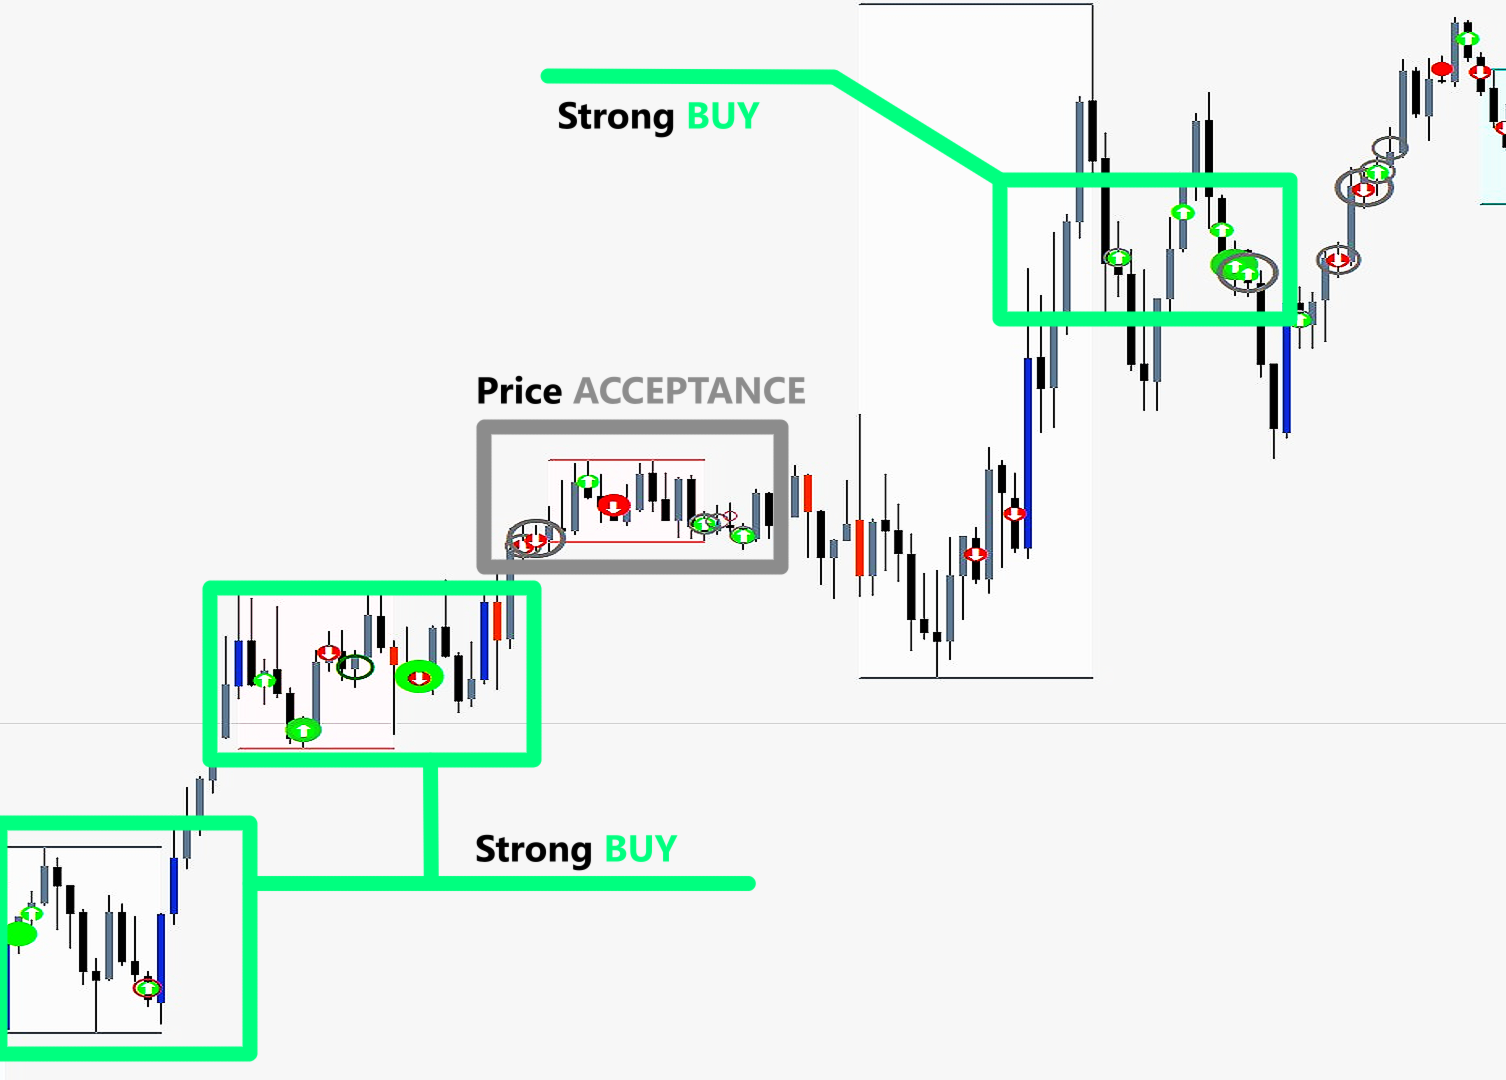
- Bubble fill = confirmation. Solid bubble = the move behind that volume was confirmed. Hollow bubble = the volume failed to confirm — a fakeout that often precedes a reversal.
- Divergence arrow on disagreement. When the money flow points one way and the time spent points the other way, an arrow shows you the direction of the bias. Up arrow = buyers paid up. Down arrow = sellers pushed down.
How to read the chart at a glance
| What you see | What it means | What you do |
|---|---|---|
| Large solid bubble | Real volume-backed move | Hold trend, or add |
| Large hollow bubble | Volume spike that failed | Fade the move |
| Solid + up arrow | Strong bullish money flow | Lean long |
| Solid + down arrow | Strong bearish money flow | Lean short |
| Hollow + up arrow | Bullish volume but unconfirmed | Wait for confirmation |
| Hollow + down arrow | Bearish volume but unconfirmed | Wait for confirmation |
| No bubble | Routine bar | Skip — don't trade noise |
Why this beats eyeballing a volume histogram
A volume histogram makes you do the math in your head: is this bar above average? by how much? is it real or a spike that'll revert? Volume Bubbles does that math for you, statistically, and puts the result on the bar where the move happened. You stop guessing and start reading.
Inputs you control
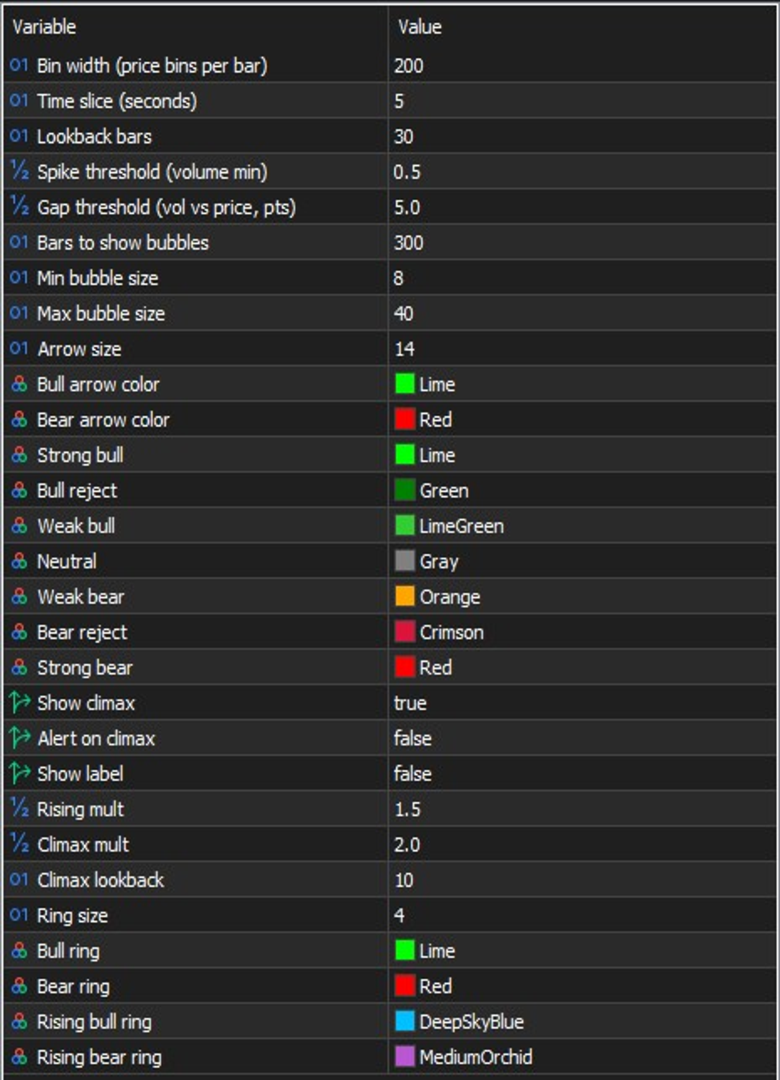
Detection sensitivity:
- How many bars look back to define "normal"
- Minimum spike threshold (raise it to see only the extreme outliers, lower it to see more)
- Minimum divergence gap before an arrow appears
Display:
- How many bars of history to draw on (depth of lookback)
- Bubble size bracket (min/max — the scaling range for the spike visualization)
- Arrow size
- 7 individual colors — every signal state has its own color, so you train your eye to read the chart instantly
Symbol fitting:
- One input for your symbol's price step — set it once per instrument
Setup time: 60 seconds
- Attach to chart
- Set price step to match your symbol's tick size (one-time per symbol — most brokers' forex = 0.0001, indices = 0.1)
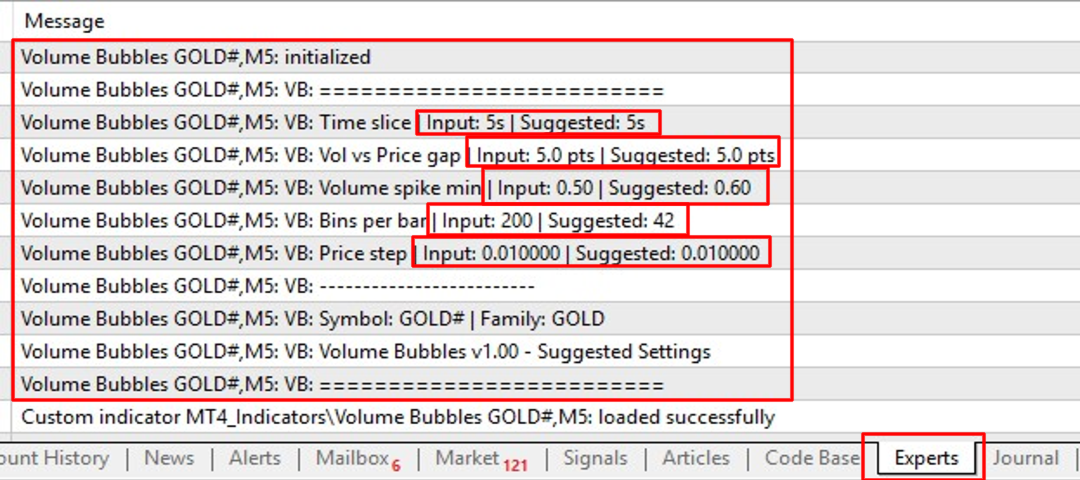
- See Expert tab for recommended inputs. it'll refresh each time the indicator is loaded
- Defaults handle the rest — bubbles appear on outlier bars, arrows appear on divergences
- Read the chart — solid = confirmed, hollow = rejected, arrow = direction bias
No DLL. No external files. Drop the .ex5 in your indicators folder and run.
Why no one else has this on MQL5 Market
You'll find plenty of volume histogram indicators. You'll find a few that try to draw profile-style lines. What you won't find is this specific fusion — outlier detection + divergence arrows rendered on the bar itself. That workflow normally lives on platforms that cost five times what MT5 does. This brings it to your MT5 chart.
Built for reliability
- Pure MQL5 — no DLL crash risk, no missing-library errors
- Per-instance isolation — attach to multiple charts without state bleed
- Auto-calibration detects symbol type (forex, indices, crypto) and adjusts handling automatically
- CPU-friendly — full recalc on chart load, incremental same-tick updates afterward (won't slow your terminal on heavy charts)
- No chart flicker (objects update in place, not delete-and-recreate)
- Input validation on load — invalid inputs print a descriptive error and reject cleanly, no silent breakage
Compatibility
MetaTrader 5 only · All timeframes · All symbols
Limitations (so you know before you buy)
- Price step must match your symbol's tick size or bubbles won't scale correctly. One-time setup per symbol.
- Not a line-drawing tool. This marks the bars worth looking at — it does not draw POC/VAH/VAL lines across your chart. Pair it with my Volume Profile indicator (sold separately) if you want both views.
- 7 signal states, not more. The classification covers the situations that actually happen in the market — impossible combinations are pruned, not paywalled.
- Symbols with no usable tick volume (rare, some equity feeds) — bubbles still render but signal strength won't be meaningful on those feeds.