Volume Bubbles MT4


Volume Bubbles 

See the volume outliers and divergence bars — before they reverse on you.

Volume Bubbles — on-chart volume spike detector with divergence arrows.

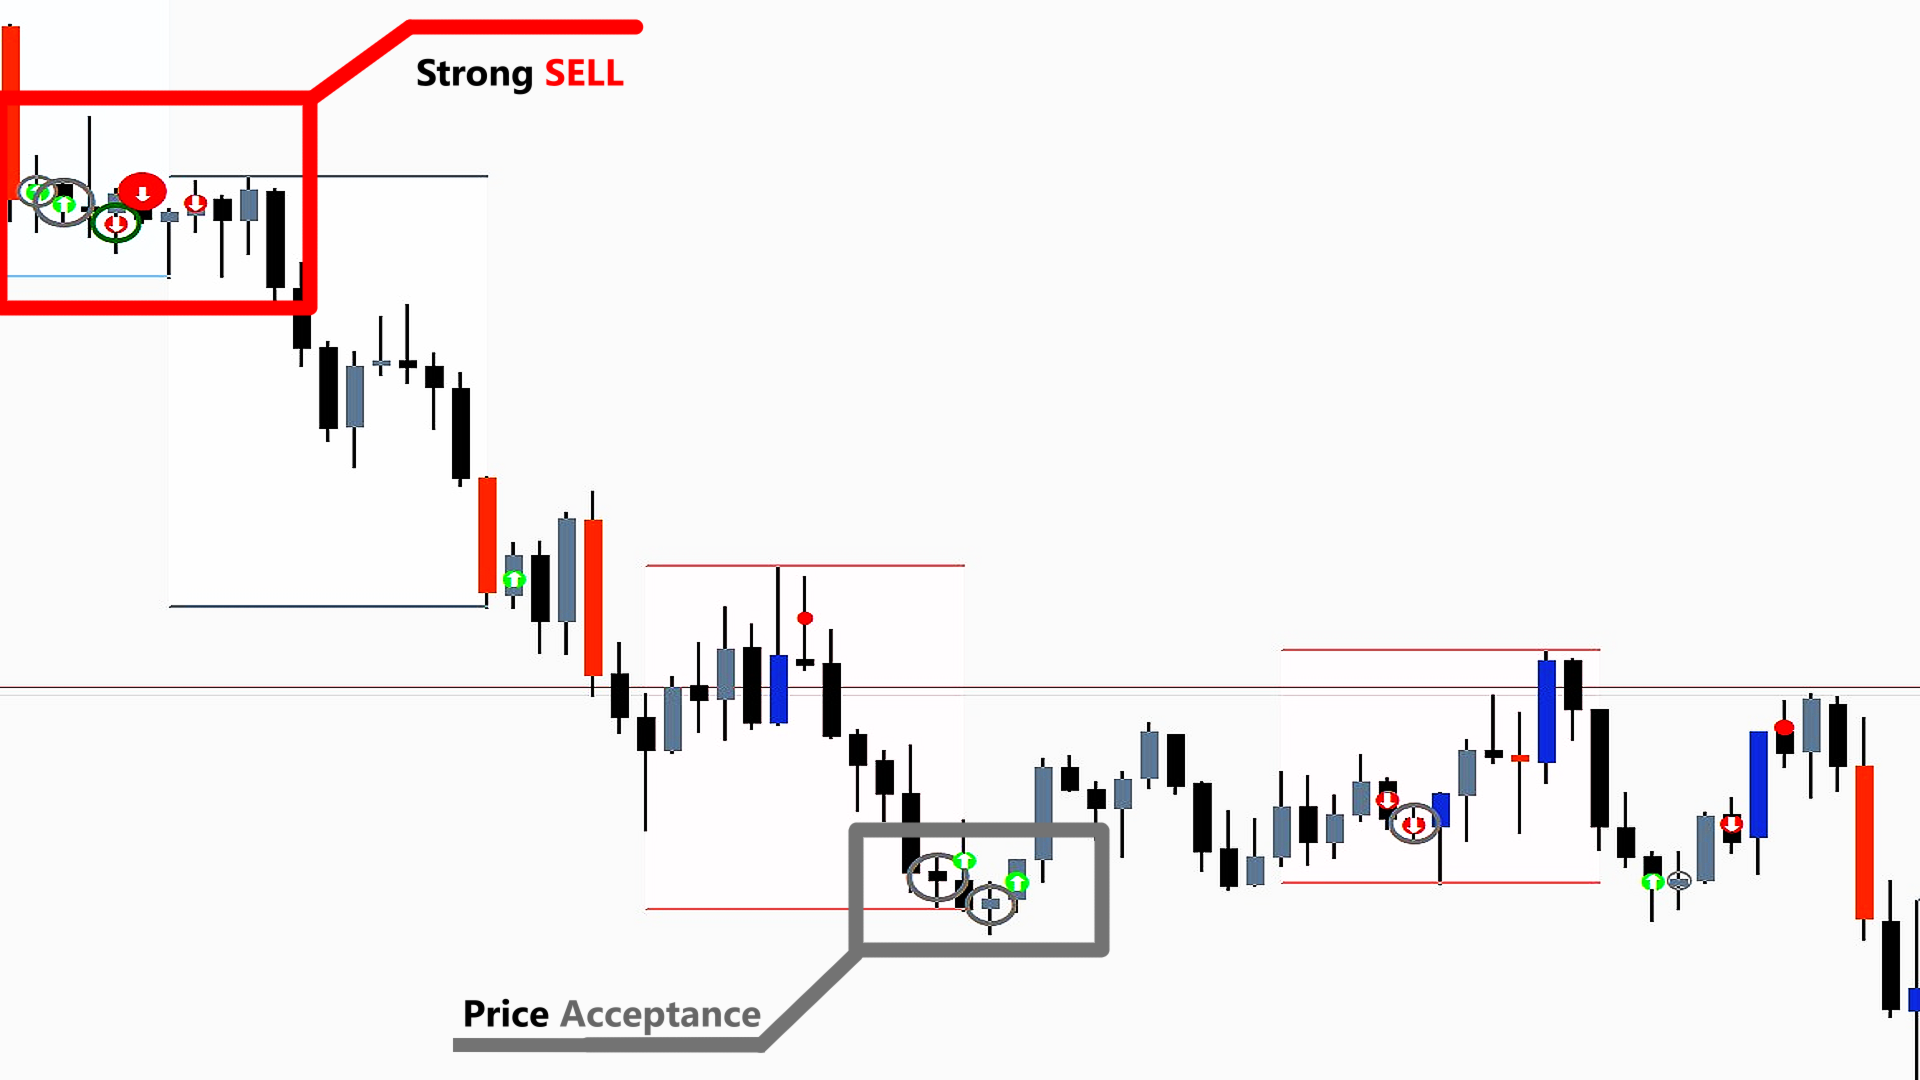
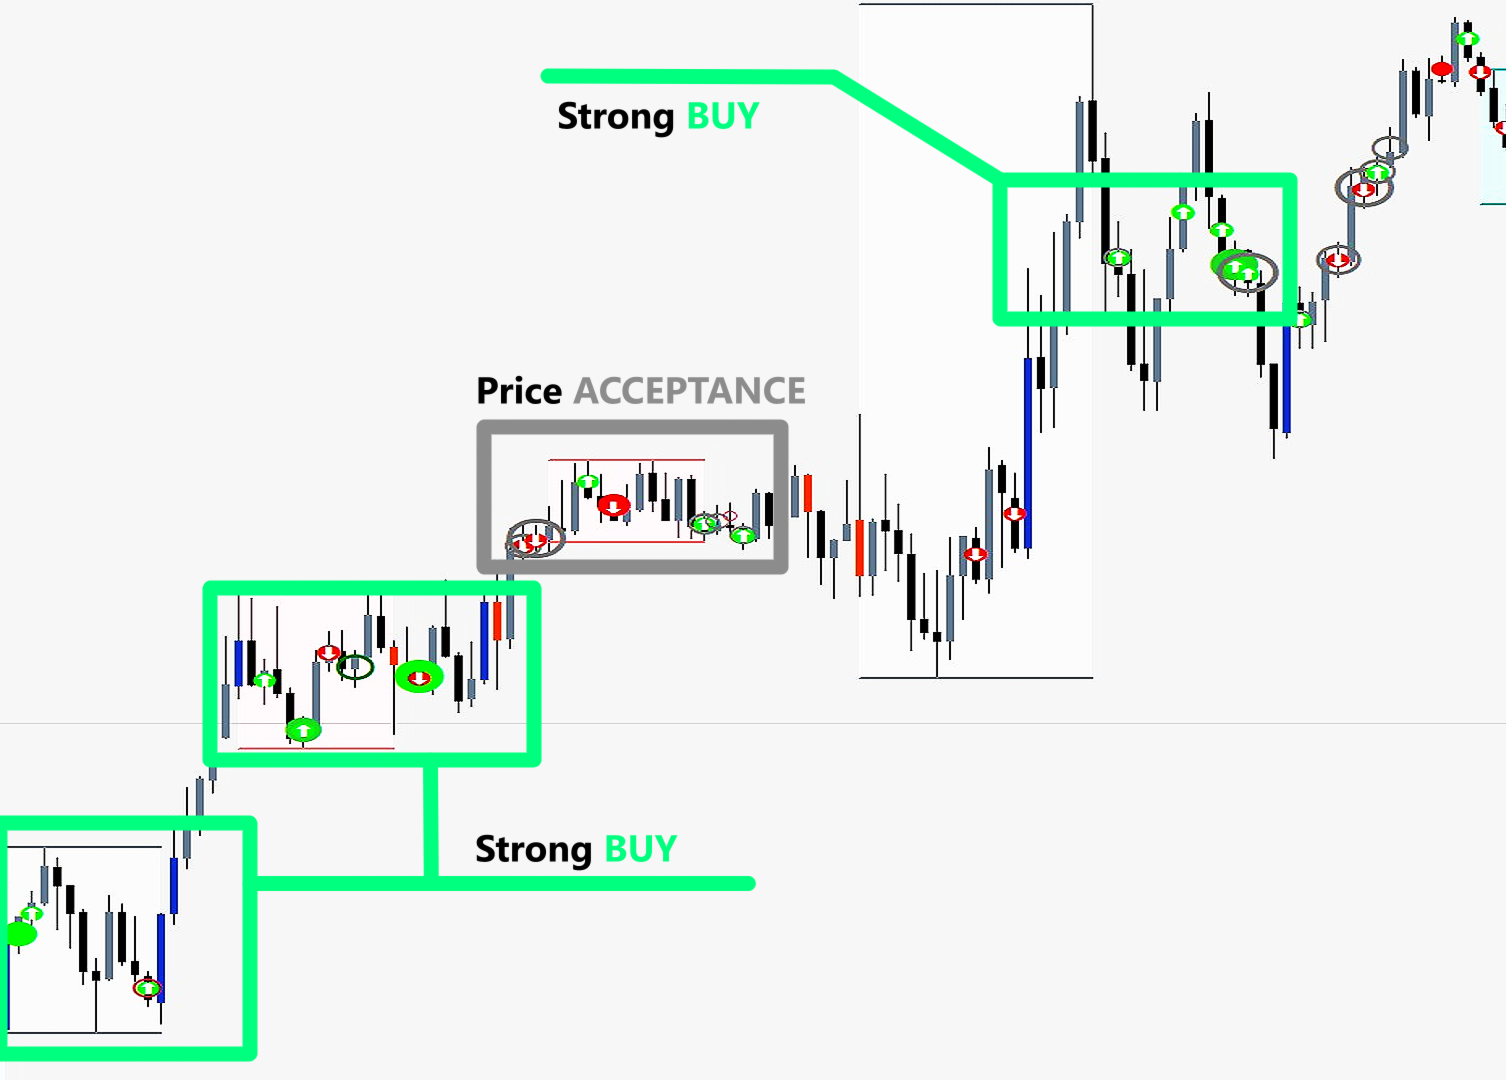
Most volume tools dump a histogram at the bottom of your screen and leave you to guess which bars actually mattered. Volume Bubbles puts the answer directly on the chart: a bubble on the bar, sized by how unusual the volume was, colored by what that volume means, with an arrow when the volume story disagrees with the price story.

What you see

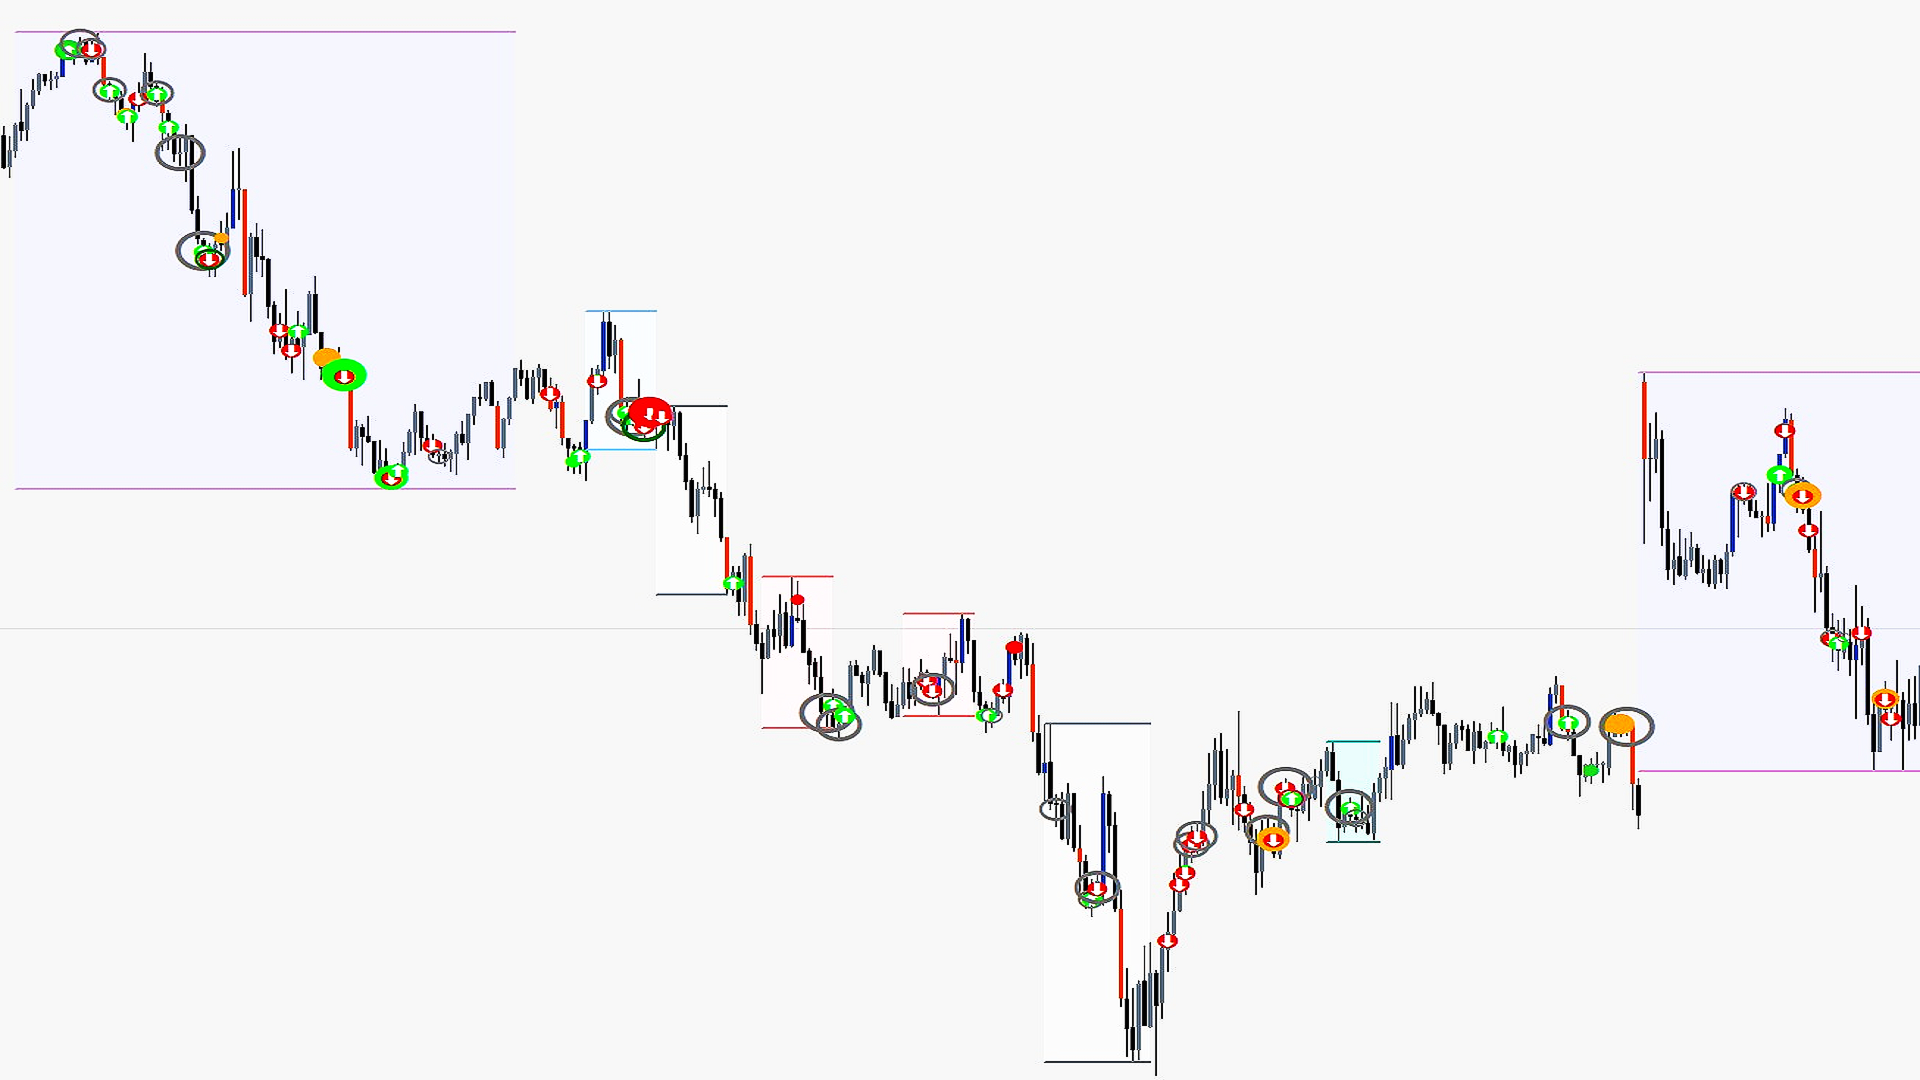
  • A bubble on outlier bars only. Routine bars stay clean. Only the bars that statistically stand out from recent volume behavior get a bubble.
  • Bubble size = strength of the spike. Bigger bubble = more unusual volume relative to recent history. You read the chart with your eye, not with a spreadsheet.
  • Bubble fill = confirmation. Solid bubble = the move behind that volume was confirmed. Hollow bubble = the volume failed to confirm — a fakeout that often precedes a reversal.
  • Divergence arrow on disagreement. When the money flow points one way and the time spent points the other way, an arrow shows you the direction of the bias. Up arrow = buyers paid up. Down arrow = sellers pushed down.

How to read the chart at a glance

What you see What it means What you do
Large solid bubble Real volume-backed move Hold trend, or add
Large hollow bubble Volume spike that failed Fade the move
Solid + up arrow Strong bullish money flow Lean long
Solid + down arrow Strong bearish money flow Lean short
Hollow + up arrow Bullish volume but unconfirmed Wait for confirmation
Hollow + down arrow Bearish volume but unconfirmed Wait for confirmation
No bubble Routine bar Skip — don't trade noise

Why this beats eyeballing a volume histogram

A volume histogram makes you do the math in your head: is this bar above average? by how much? is it real or a spike that'll revert? Volume Bubbles does that math for you, statistically, and puts the result on the bar where the move happened. You stop guessing and start reading.

Inputs you control

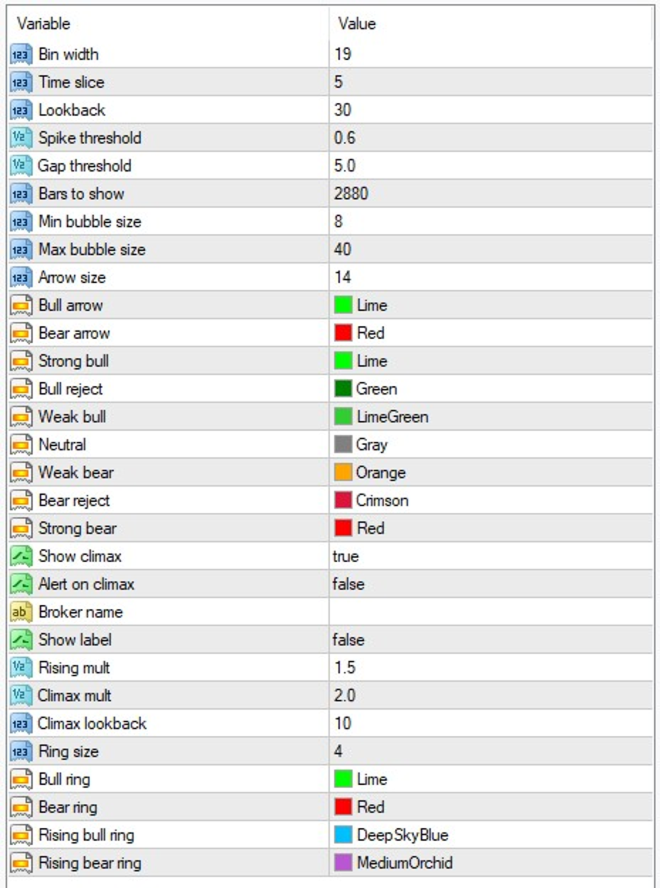
Detection sensitivity:
  • How many bars look back to define "normal"
  • Minimum spike threshold (raise it to see only the extreme outliers, lower it to see more)
  • Minimum divergence gap before an arrow appears
Display:
  • How many bars of history to draw on (depth of lookback)
  • Bubble size bracket (min/max — the scaling range for the spike visualization)
  • Arrow size
  • 7 individual colors — every signal state has its own color, so you train your eye to read the chart instantly
Symbol fitting:

  • One input for your symbol's price step — set it once per instrument

Setup time: 60 seconds

  1. Attach to chart
  2. Set price step to match your symbol's tick size (one-time per symbol — most brokers' forex = 0.0001, indices = 0.1)
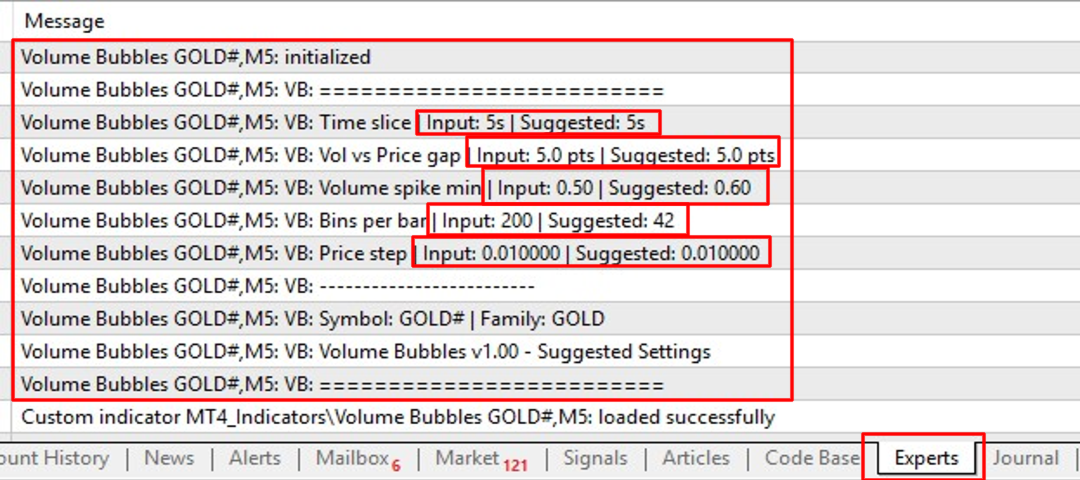
  3. See Expert tab for recommended inputs. it'll refresh each time the indicator is loaded
  4. Defaults handle the rest — bubbles appear on outlier bars, arrows appear on divergences
  5. Read the chart — solid = confirmed, hollow = rejected, arrow = direction bias

No DLL. No external files. Drop the .ex4 in your indicators folder and run.

Why no one else has this on MQL4 Market

You'll find plenty of volume histogram indicators. You'll find a few that try to draw profile-style lines. What you won't find is this specific fusion — outlier detection + divergence arrows rendered on the bar itself. That workflow normally lives on platforms that cost five times what MT4 does. This brings it to your MT4 chart.

Built for reliability

  • Pure MQL4 — no DLL crash risk, no missing-library errors
  • Per-instance isolation — attach to multiple charts without state bleed
  • Auto-calibration detects symbol type (forex, indices, crypto) and adjusts handling automatically
  • CPU-friendly — full recalc on chart load, incremental same-tick updates afterward (won't slow your terminal on heavy charts)
  • No chart flicker (objects update in place, not delete-and-recreate)
  • Input validation on load — invalid inputs print a descriptive error and reject cleanly, no silent breakage

Compatibility

MetaTrader 4 only · All timeframes · All symbols

Limitations (so you know before you buy)

  • Price step must match your symbol's tick size or bubbles won't scale correctly. One-time setup per symbol.
  • Not a line-drawing tool. This marks the bars worth looking at — it does not draw POC/VAH/VAL lines across your chart. Pair it with my Volume Profile indicator (sold separately) if you want both views.
  • 7 signal states, not more. The classification covers the situations that actually happen in the market — impossible combinations are pruned, not paywalled.
  • Symbols with no usable tick volume (rare, some equity feeds) — bubbles still render but signal strength won't be meaningful on those feeds.
Produtos recomendados
The indicator allows you to trade binary options. The recommended time frame is М1 and the expiration time is 1,2,3 minutes. The indicator suitable for auto and manual trading. A possible signal is specified as a arrows above/under a candle. You should wait until the candle closes! Arrows are not re-painted Trade sessions: TOKYO section (Half-end) Currency pairs: USD/JPY Working time frame: M1 Expiration time: 1,2,3 minutes. The indicator also shows good results when using the martingale strateg
FREE
The Arrow Scalper
Fawwaz Abdulmantaser Salim Albaker
1 (2)
Dear Friend..  I share with you this simple Expert Adviser .. it is full automatic  this Expert Adviser following the trend of the pair you install on or any stocks or indices , it is works like that: - when the trend on H4 chart show a start of up trend the expert will wait till the 15M & 1H charts show an up trend the EA will open a buy order directly , and do the same for down trend and open a sell order the buy or sell  order lot size and take profit and stop loss will measured manually  by
FREE
Indicador único que implementa uma abordagem profissional e quantitativa para significar negociação de reversão. Ele capitaliza o fato de que o preço desvia e retorna à média de maneira previsível e mensurável, o que permite regras claras de entrada e saída que superam amplamente as estratégias de negociação não quantitativas. [ Installation Guide | Update Guide | Troubleshooting | FAQ | All Products ] Sinais de negociação claros Incrivelmente fácil de negociar Cores e tamanhos personalizáveis
Indicador Crypto_Forex "Trend Flat Pro Histogram" para MT4, sem repintura. - O indicador "Trend Flat Pro Histogram" é muito sensível e muito mais eficiente do que qualquer média móvel padrão. - Ele foi projetado para mostrar as condições atuais do mercado: Lateral, Tendência de Alta e Tendência de Baixa. - O indicador possui 3 cores: Amarelo para condições de mercado Lateral, Vermelho para tendência de baixa e Verde para tendência de alta (as cores podem ser alteradas nas configurações). - Com
SX Supply Demand Zones accurately identifies and draws high-probability Supply and Demand zones using a sophisticated algorithm. Unlike traditional indicators that clutter your chart, this indicator is designed with a focus on performance and a clean user experience. New Unique Feature: Interactive Legend System What truly sets this indicator apart from everything else is the Interactive Control Legend. You have a professional dashboard directly on your chart that allows you to: Show/Hide: Ins
FREE
EARLY REMINDER: The Starting price is 65 price will rise soon up to 365$ and then 750$ after first 10 copies of sales. Grab this offer now! Introduction Hello, traders! Welcome to the demonstration of the Forex Beast Indicator , a comprehensive tool designed to assist aspiring traders in navigating the complexities of the forex market. This indicator incorporates seven essential components to provide a well-rounded trading experience: Moving Averages Colored Zones Support and Resistance Levels
Money Flow Profile MT5 HERE   Here   our more valuable tools SMC Trend Trading   ,  Easy SMC Trading  ,  Institutional SMC Architect Volume Analysis Tools  ,  Volume flow Profile  ,  Market volume profile  , FVG with Volume  , Liquidity Heatmap Profile  ,  Volume Spread Analysis This Master Edition is engineered for clarity and speed, featuring a unique Auto-Theme Sync system that instantly beautifies your chart layout upon loading. Key Features: True Money Flow Calculation: Goes beyond stand
Volume Dominance Indicator MT4 Stop Guessing the Market. Start Reading Who Is Really in Control. Every successful trader knows one simple truth: Price tells you where the market is moving. Volume tells you why. Many traders spend years searching for the perfect entry, yet they overlook one of the most valuable pieces of market information—the balance of buying and selling pressure. Without understanding who truly controls the market, even the best-looking setups can quickly fail. Volume Dominanc
PZ Trend Trading
PZ TRADING SLU
4.8 (5)
O Trend Trading é um indicador projetado para lucrar o máximo possível com as tendências que ocorrem no mercado, cronometrando retrocessos e rupturas. Ele encontra oportunidades de negociação analisando o que o preço está fazendo durante as tendências estabelecidas. [ Guia de instalação | Guia de atualização | Solução de problemas | FAQ | Todos os produtos ] Negocie mercados financeiros com confiança e eficiência Lucre com as tendências estabelecidas sem ser chicoteado Reconhecer retrocessos
Market Profile
Artem Titarenko
5 (1)
The "Market Profile" indicator displays the profiles and volumes of periods – weekly, daily, session (8-hour), 4-hour, hour, summary. The VAH/VAL price area is automatically highlighted by a dotted line for each profile (except for the summary). The indicator includes chroma Delta, which colors the profile areas. The areas of prevailing Buys is colored in green, that of Sells - in red. The intensity histogram features blue/red respectively. In the filter mode, the indicator displays the volume a
Your Good Friends — this is not just an indicator, but your reliable trading assistant, designed for traders who value simplicity, clarity, and stability. It combines the best classic methods of technical analysis — support and resistance levels, reversal signals, visual cues — and presents them in the clearest, most user-friendly format possible. Suitable for both beginners and experienced traders — especially those who want to eliminate chaos, reduce stress, and trade based on clear signals.
Smart FVG Indicator MT4 – Detecção Avançada de Fair Value Gap para MetaTrader 4 O Smart FVG Indicator para MetaTrader 4 oferece detecção, monitorização e alertas profissionais de Fair Value Gap (FVG) diretamente nos seus gráficos. Ele combina filtragem baseada em ATR com lógica sensível à estrutura para remover ruído, adaptar‑se à liquidez e manter apenas os desequilíbrios mais relevantes para decisões precisas. Principais vantagens Deteção precisa de FVG: identifica ineficiências reais de pre
FREE
TrendMaster Ultra | Structure-Based Trading Without Guesswork Tired of indicators that repaint after the fact? Sick of counter-trend oscillator signals firing in the middle of a powerful move, and endless stop-losses triggered by market noise? TrendMaster Ultra is not just another arrow indicator; it is an intelligent filter of market reality for MetaTrader 4. The system combines strict Price Action logic (Smart Money Concepts) with adaptive technical analysis. This tool takes over the most co
FREE
Harvest GOLD
Sayan Vandenhout
Harvest GOLD USES THE TREND WAVE INDICATOR AND IT CAN IDENTIFY THE BEGINNING AND THE END OF A NEW WAVE TREND MOVEMENT. AS AN OSCILLATOR, THE INDICATOR IDENTIFIES THE OVERBOUGHT AND OVERSOLD ZONES. IT WORKS GREAT TO CATCH THE SHORT TERM PRICE REVERSALS AND USES A MARTINGALE STRATEGY TO CLOSE ALL TRADES IN PROFIT. USE DEFAULT SETTINGS ON H1 OR HIGHER TIME FRAME ON ANY PAIR FOR MORE ACCURATE TRADES WHY THIS EA : Smart entries calculated by 3 great strategies The EA can be run on even a $30000
Elliott Wave Principle MT4
Mohamed Amr Mohamed Osama Abdelwahab
**Negocie as ondas como o livro ensina, não por suposição.** O indicador lê a estrutura do preço e rotula automaticamente os impulsos de Elliott (1-2-3-4-5) e as correções (A-B-C); depois mostra para onde a próxima onda tende a ir e onde o livro diz que está a operação. É baseado diretamente em «O Princípio das Ondas de Elliott — Chave para o Comportamento do Mercado», de A.J. Frost e Robert Prechter, e é fiel à fonte: as quatro regras invioláveis das ondas são aplicadas a 100%, portanto uma c
TSim
Sergey Kruglov
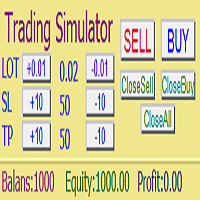
Утилита  TSim   позволяет симулировать ручную торговлю в Тестере Стратегий MetaTrader 4. В панеле можно устанавливать размеры лота, тейпрофита и стоплосса. Панель имеет кнопки Sell   и Buy для выставления рыночных ордеров, а также кнопки CloseSell, CloseBuy и CloseAll для быстрого закрытия ордеров. Под панелью отображается список открытых ордеров. Внимание. Панель работает только в Визуальном режиме Тестера Стратегий MetaTrader 4.
FREE
FiboZag
Andriy Sydoruk
Indicator FiboZag - transfer the indicator to the chart and the Fibonacci levels will be built automatically on the last ZigZag turn. The main advantage lies in the correct construction of Fibonacci levels and markup of price levels. Simple, visual and effective use. The indicator is not redrawn and does not lag. Works on all currency pairs and on all timeframes.
O indicador Crypto_Forex "Auto FIBO Pro" é uma ótima ferramenta auxiliar na negociação! - O indicador calcula e coloca automaticamente no gráfico os níveis de Fibonacci e as linhas de tendência locais (cor vermelha). - Os níveis de Fibonacci indicam áreas-chave onde o preço pode reverter. - Os níveis mais importantes são 23,6%, 38,2%, 50% e 61,8%. - Pode utilizá-lo para scalping de reversão ou para negociação de grelha de zona. - Existem muitas oportunidades para melhorar o seu sistema atual ut
PX Trend
Vitalii Zakharuk
PX Trend is a technical indicator that mathematically transforms the price of a currency pair in the form of signaling arrows on the chart, it is used to predict the direction of the market movement. This tool is basic for the interpretation of the parameters of the graphs in technical analysis. PX Trend refers to an arrow indicator Forex - a tool that gives unambiguous signals to buy or sell currencies using arrows. An arrow directed upwards recommends buying, downward - selling. The indicato
Implement
Vitalii Zakharuk
5 (1)
Implement analyzes market dynamics for pivot points. If you want to learn how to spot the correct reversals for consistently likely profitable trading, buy this indicator. Shows favorable moments of entering the market in stripes. Ready-made trading system. The principle of operation of the indicator is to automatically determine the current state of the market when placed on a chart, analyze historical data based on historical data and display instructions for further actions on the trader's
Super Reversal Pattern
Parfait Mujinga Ndalika
Super Reversal Pattern Indicator Unlock the power of advanced pattern recognition with our Super Reversal Pattern Indicator. Designed for traders seeking precision and reliability, this indicator identifies one of the most effective reversal patterns in technical analysis, offering a significant edge in your trading strategy. Key Features: Non-Repainting Accuracy: Enjoy the confidence of non-repainting technology. Once a Super Reversal Pattern is detected, it remains static, providing consiste
"Dynamic Scalping Oscillator" - um indicador avançado e personalizado para Crypto_Forex - uma ferramenta de negociação eficiente para MT4! - Nova geração de osciladores - veja as imagens para saber como usá-lo. - O Dynamic Scalping Oscillator possui zonas adaptáveis de sobrevenda/sobrecompra. - O oscilador é uma ferramenta auxiliar para encontrar pontos de entrada exatos em áreas dinâmicas de sobrevenda/sobrecompra. - Valores de sobrevenda: abaixo da linha verde, valores de sobrecompra: acima d
Accumulation/Distribution Technical Indicator is determined by the changes in price and volume. The volume acts as a weighting coefficient at the change of price – the higher the coefficient (the volume) is, the greater the contribution of the price change (for this period of time) will be in the value of the indicator. In fact, this indicator is a variant of the more commonly used indicator   On Balance Volume . They are both used to confirm price changes by means of measuring the respective vo
MR Volume POC Levels 4
Sergey Khramchenkov
5 (3)
The most important price level in any "Volume profile" is the "Point of Control" . This is the price level with the highest trading volume. It is primarily the level where large players initiate their positions, making it the accumulation/distribution level for the "Smart money" . The idea of the indicator arose after the "MR Volume Profile 4" indicator was made. When creating the "MR Volume Profile 4" indicator, we spent a lot of time comparing the volumes with those from the volume profile in
Stochastic BR
Antony Augustine
Stochastic BR allows you to recognize reversals professionally. The "Stochastic BR" is designed to recognize profitable counter trend patterns from your chart. Stochastic Indicator: This technical indicator was developed by George Lane more than 50 years ago. The reason why this indicator survived for so many years is because it continues to show consistent signals even in these current times. The Stochastic indicator is a momentum indicator that shows you how strong or weak the current trend i
Discover the power of precision and efficiency in your trading with the " Super Auto Fibonacci " MT4 indicator. This cutting-edge tool is meticulously designed to enhance your technical analysis, providing you with invaluable insights to make informed trading decisions. Key Features: Automated Fibonacci Analysis: Say goodbye to the hassle of manual Fibonacci retracement and extension drawing. "Super Auto Fibonacci" instantly identifies and plots Fibonacci levels on your MT4 chart, saving you tim
FREE
Market Profile 3
Hussien Abdeltwab Hussien Ryad
3 (2)
Market Profile 3 MetaTrader 4 indicator  — is a classic Market Profile implementation that can show the price density over time, outlining the most important price levels, value area, and control value of a given trading session. This indicator can be attached to timeframes between M1 and D1 and will show the Market Profile for daily, weekly, monthly, or even intraday sessions. Lower timeframes offer higher precision. Higher timeframes are recommended for better visibility. It is also possible t
FREE
LordAutoFibonnaci
Igor Pereira Calil
5 (2)
O Lord Auto Fibonnaci é um indicador gratuito para Meta Trader, com intuito de mostrar a tabela mais famosa do mercado financeiro conhecida por "Fibonnaci". Como podemos ver nas imagens abaixo, a tabela fibonnaci é a qual vai analisar o gráfico automaticamente para você, com fatores de tendências através de porcentagem, um uso quase infalível, você pode trabalhar sempre quando a porcentagem esteja em baixa ou alta, iniciar compras e vendas no tempo certo, ótimo para analisar entradas! Nas imagen
FREE
-- Simples, mas eficaz. Indicador de inversão - O que é? Um indicador de sobreposição que segue tendências e combina a lógica SuperTrend com a tecnologia de curva exponencial. Ele detecta a direção da tendência, desenha um canal dinâmico no gráfico e envia alertas em tempo real quando a tendência se inverte. Como funciona? O indicador calcula uma linha de base exponencial usando ATR e um fator SuperTrend. Quando o preço fecha acima ou abaixo dessa linha de base, uma inversão de tendência é co
FREE
Rira Renko
Vitor Palmeira Abbehusen
RENKO on Time Chart This indicator is an enhanced Renko, so you can watch the Renko bricks on the chart to understand price movement more clearly the other improvement is automated box size according to ATR (Average True Range) period you can set the ATR number as you want and the box size of Renko changes automatically based on price movement Inputs Mode: Box size is the input to specify the size of the Renko box you want to print on the chart. This input lets you choose the fixed box siz
Os compradores deste produto também adquirem
Trend SniperX MT4
Sarvarbek Abduvoxobov
5 (5)
Trend Sniper X é um indicador de tendência multitemporal para MetaTrader 5 que ajuda os traders a identificar a direção da tendência e potenciais pontos de reversão com clareza e precisão. Para MT5: https://www.mql5.com/en/market/product/181101 Informação de preço: O preço atual é promocional e está sujeito a alterações à medida que novas atualizações e recursos forem lançados. Canal Code2Profit Domine o Mercado com Análise Multitemporal! Como Maximizar sua Taxa de Acerto com o Trend Sniper X: R
M1 Sniper
Oleg Rodin
4.97 (30)
O M1 SNIPER é um sistema indicador de negociação fácil de usar. É um indicador de seta projetado para o período M1. O indicador pode ser usado como um sistema independente para scalping no período M1 e pode ser usado como parte do seu sistema de negociação existente. Embora este sistema de negociação tenha sido projetado especificamente para negociação no M1, ele também pode ser usado em outros períodos. Originalmente, desenvolvi este método para negociar XAUUSD e BTCUSD. Mas considero-o útil ta
O sistema PRO Renko é um sistema de negociação altamente preciso especialmente concebido para a negociação de gráficos RENKO. Trata-se de um sistema universal que pode ser aplicado a vários instrumentos de negociação. O sistema neutraliza eficazmente o chamado ruído de mercado, dando-lhe acesso a sinais de inversão precisos. O indicador é muito fácil de usar e tem apenas um parâmetro responsável pela geração de sinal. Você pode facilmente adaptar a ferramenta a qualquer instrumento de negocia
Currency Strength Wizard é um indicador muito poderoso que fornece uma solução completa para uma negociação bem-sucedida. O indicador calcula o poder deste ou daquele par forex usando os dados de todas as moedas em vários intervalos de tempo. Esses dados são representados em uma forma de índice de moeda fácil de usar e linhas de energia de moeda que você pode usar para ver o poder desta ou daquela moeda. Tudo o que você precisa é anexar o indicador ao gráfico que deseja negociar e o indicador mo
Atomic Analyst
Issam Kassas
5 (14)
Atomic Analyst — MetaTrader 4 Para dúvidas sobre o produto, orientação de configuração ou suporte técnico, envie-me uma mensagem diretamente aqui no MQL5. O indicador transforma cálculos complexos do mercado em sinais visuais simples, candles coloridos, leituras de tendência, níveis de stop loss e várias zonas de take profit que os traders podem entender rapidamente e usar em condições reais de mercado. Principais usos de trading: Scalping e day trade: Desenvolvido para tomada de decisão rápida
Smart Trend Trading System é um indicador para MetaTrader 4 que reúne informações de tendência, sinais de entrada e saída e níveis de preço em um único gráfico. Ele combina mais de 10 ferramentas de trading em um único sistema, incluindo detecção de tendência, zonas de reversão, Smart Cloud, lógica de trailing stop, suporte e resistência, coloração de candles, alertas e análise multi-timeframe. O sistema foi desenvolvido para ajudar você a operar diferentes condições de mercado: Mercados em tend
Scalper Vault
Oleg Rodin
5 (40)
O Scalper Vault é um sistema de negociação poderoso e completo, projetado para traders que buscam consistência em operações intraday. Este indicador de alta precisão funciona como um sistema de negociação autônomo, oferecendo análises de nível institucional tanto para o mercado Forex quanto para Opções Binárias. ENTRE EM CONTATO COMIGO APÓS A COMPRA PARA RECEBER DICAS DE NEGOCIAÇÃO E UM BÔNUS EXCLUSIVO! Ao eliminar suposições e análises manuais complexas, o Scalper Vault permite que você foque
Neuro Poseidon MT4
Daria Rezueva
4.74 (46)
Neuro Poseidon is a new indicator by Daria Rezueva. It combines precise trading signals with adaptive TP/SL levels - creating best possible trades as a result! Message me and get  Neuro Poseidon Assistant  as a gift to automize your trading process! What makes it stand out? 1. Proven profitability on all assets and timeframes 2. Only confirmed BUY and SELL signals present on the chart 3. Adaptive TP & SL levels generated by the software for each trade 4. Easy to understand - suitable for all
Gann Made Easy
Oleg Rodin
4.84 (173)
Gann Made Easy é um sistema de negociação Forex profissional e fácil de usar, baseado nos melhores princípios de negociação usando a teoria do sr. W. D. Gann. O indicador fornece sinais precisos de COMPRA e VENDA, incluindo níveis de Stop Loss e Take Profit. Você pode negociar mesmo em movimento usando notificações PUSH. Entre em contato comigo após a compra para receber instruções de negociação e ótimos indicadores extras gratuitamente! Provavelmente você já ouviu muitas vezes sobre os métodos
Liquidity Scalper System: um sistema de trading baseado em liquidez no formato de indicador. A maioria dos indicadores mostra apenas uma seta, e depois o trader decide sozinho onde colocar o stop, onde está o alvo e se pode confiar no sinal. O Liquidity Scalper System cobre todo o ciclo da operação: encontra pools de liquidez, dá um sinal no seu rompimento, calcula imediatamente Entry, Stop Loss e três alvos, e mostra no painel as estatísticas e os resultados da validação em dados novos. O sist
SR Liquidity
Oleg Rodin
5 (2)
O SR Liquidity é um indicador de trading projetado para revelar as zonas ocultas onde a liquidez do mercado se concentra e o preço reage com maior intensidade. Essas áreas específicas de liquidez funcionam como níveis poderosos de suporte e resistência, oferecendo um mapa claro de onde é mais provável que o mercado reverta. Em vez de traçar linhas comuns de Suporte e Resistência, o SR Liquidity analisa o comportamento real dos preços para detectar as zonas onde se acumulam pressões de compra e v
AW Prime Oscillator
AW Trading Software Limited
5 (1)
Uma combinação de dois osciladores. O primeiro exibe os pontos de entrada, o segundo mostra a tendência atual. O indicador pode exibir sinais do oscilador por meio de setas em dois modos, todos os sinais do oscilador rápido ou sinais apenas na direção da tendência atual. Possui painel multi-timeframe e três tipos de notificações de sinal. Benefícios: Adequado para negociação diurna e de scalping Filtragem de tendências Configuração simples e sensível Painel multiperíodo Adequado para integração
O Top Bottom Tracker é um indicador baseado em algoritmos sofisticados que analisa a tendência do mercado e pode detetar os altos e baixos da tendência / Versão MT5 . O preço aumentará progressivamente até atingir 500$. Próximo preço --> $99 Características Sem repintura Este indicador não altera os seus valores quando chegam novos dados Pares de negociação Todos os pares de forex Timeframe   Todos os timeframes Parâmetros ==== Configuração do indicador ==== Parâmetro de configuração
Cycles Predictor Indicator This indicator uses past market cycles to predict future price movements. The indicator scans through past data and considers  combinations  of cycles. When cycles  coincide  at the same future date/time then it is considered a valid future prediction. The predictions are drawn as vertical lines on the right side of the chart in the future. A prediction will often result in type of candle (ex. bull or bear) and/or a reversal point (ex. bottom or top) forming at this ex
Break and Retest Hunter MT4 is a powerful MetaTrader 5 indicator designed to automatically identify support and resistance levels, breakout structures, and potential retest opportunities in real time. Bonus Indicator: After purchasing Break and Retest Hunter , contact me to receive Trade Indicator Assistant EA completely free as a bonus utility. $65 for the next 10 copies . Next price is $120.  Combining adaptive market analysis, clear BUY/SELL signals, Fibonacci-based profit targets, and a pre
Sinal de tendência GoldRush Arrow O indicador Sinal de tendência GoldRush Arrow fornece uma análise precisa e em tempo real das tendências, adaptada para scalpers de alta velocidade e curto prazo em XAU/USD. Criada especificamente para o intervalo de tempo de 1 minuto, esta ferramenta exibe setas direcionais para pontos de entrada claros, permitindo que os scalpers naveguem em condições de mercado voláteis com confiança. O indicador consiste em setas de alerta PRIMÁRIAS e SECUNDÁRIAS. Os sin
ForexTrendMT4
Andriy Sydoruk
5 (1)
ForexTrendMT4 Indicator: A Reliable Tool for Market Tracking The ForexTrendMT4 indicator offers reliable market trend tracking, filtering out sudden fluctuations and market noise. This tool helps identify trends and signals favorable entry points into the market using arrows. It is suitable for both scalping on shorter timeframes and long-term trading strategies. Based on the principles of technical analysis, ForexTrendMT4 takes into account the cyclical nature of the market. Key Features and A
CRT Multi-Timeframe Market Structure & Liquidity Sweep Indicator Non-Repainting | Multi-Asset | MT5 Version Available MT5 Version:   https://www.mql5.com/en/market/product/162075 Full User Guide — explains what each feature does and why:   https://www.mql5.com/en/blogs/post/767525 Quick Start User Guide  — explains how to configure and in what order:  https://www.mql5.com/en/blogs/post/767540 Indicator Overview CRT Ghost Candle HTF Fractal is a complete institutional-grade market structure too
Super Signal – Skyblade Edition Sistema profissional de sinais de tendência sem repintar / sem atraso com taxa de acerto excepcional | Para MT4 / MT5 Funciona melhor em timeframes mais curtos, como 1 minuto, 5 minutos e 15 minutos. Principais características: Super Signal – Skyblade Edition é um sistema inteligente de sinais desenvolvido especificamente para operações com tendência. Utiliza uma lógica de filtragem em múltiplas camadas para detectar apenas movimentos direcionais fortes sustenta
ACTUALMENTE COM 40% DE DESCONTO A melhor solução para qualquer novato ou comerciante especializado! Este Indicador é uma ferramenta comercial única, de alta qualidade e acessível, porque incorporámos uma série de características proprietárias e uma nova fórmula. Com apenas UM gráfico, pode ler a força da moeda para 28 pares de Forex! Imagine como a sua negociação irá melhorar porque é capaz de apontar o ponto exacto do gatilho de uma nova tendência ou oportunidade de escalada? Manual do util
Introducing Volume Orderflow Profile , a versatile tool designed to help traders visualize and understand the dynamics of buying and selling pressure within a specified lookback period. Perfect for those looking to gain deeper insights into volume-based market behavior! MT5 Version -  https://www.mql5.com/en/market/product/122657 The indicator gathers data on high and low prices, along with buy and sell volumes, over a user-defined period. It calculates the maximum and minimum prices during this
True Direction Oscillator
Muhammad Elbermawi
4.85 (364)
Ou (TDO) que é um índice que mede a taxa de variação do preço usando o princípio de " Pure Momentum ". Quando o preço de um título avança de 10 para 15, a taxa de variação do preço é 150%, mas quando diminui de 15 para 10, a taxa de variação do preço é apenas 33,3%. É por isso que os indicadores de análise técnica como "Taxa de variação do preço" (ROC) ou "Momentum" fornecem leituras mais altas para movimentos de preços ascendentes do que para os descendentes. O TDO corrige esse problema para aj
Trend Lines PRO
Roman Podpora
5 (2)
LINHAS DE TENDÊNCIA PRO       Ajuda a entender onde o mercado está realmente mudando de direção. O indicador mostra inversões de tendência reais e pontos onde os principais participantes retornam ao mercado. Você vê     Linhas BOS     Análise de tendências e níveis-chave em prazos maiores — sem configurações complexas ou ruídos desnecessários. Os sinais não são repintados e permanecem no gráfico após o fechamento da barra. VERSÃO MT 5      -      Revela seu potencial máximo quando emparelhada co
Actualmente 30% OFF ! A melhor solução para qualquer novato ou comerciante especializado! Este software de painel de instrumentos está a funcionar em 28 pares de moedas. É baseado em 2 dos nossos principais indicadores (Advanced Currency Strength 28 e Advanced Currency Impulse). Dá uma grande visão geral de todo o mercado Forex. Mostra valores avançados de força da moeda, velocidade de movimento da moeda e sinais para 28 pares de divisas em todos os (9) períodos de tempo. Imagine como a sua n
Advanced Supply Demand
Bernhard Schweigert
4.91 (302)
Atualmente com 30% de desconto! A melhor solução para qualquer Trader Novato ou especialista! Este indicador é uma ferramenta de negociação exclusiva, de alta qualidade e acessível porque incorporamos uma série de recursos proprietários e uma nova fórmula. Com esta atualização, você poderá mostrar fusos horários duplos. Você não só será capaz de mostrar um TF mais alto, mas também mostrar ambos, o TF do gráfico, MAIS o TF mais alto: MOSTRANDO ZONAS ANINHADAS. Todos os traders de Oferta e Demanda
KT Parabolic RSI MT4
KEENBASE SOFTWARE SOLUTIONS
KT Parabolic RSI overlays Parabolic SAR directly on the RSI line to highlight likely market turning points. Classic RSI overbought and oversold readings already hint at reversals, and the added PSAR filter removes much of the noise and sharpens those signals, giving you clearer trade setups. Big Square Signals: A Parabolic SAR flip on an RSI that sits in overbought or oversold territory. These mark high-probability market turns. Small Square Signals: A SAR flip inside the neutral RSI band. Treat
SmartSignal
Pavel Krysanov
For any trader, the result of market analysis is the correct identification of the market entry and exit points. The more correctly they are selected, the more profitable the trading. The SmartArrows indicator does not display any excessive information that may distract or confuse the trader, but only the mot important things. The indicator is very simple to use. When a down arrow appears, open a SELL trade, with an up arrow open BUY. Despite its seeming simplicity, the SmartArrows indicator con
This is a professional chart indicator designed for traders focused on stability and clear price action. It helps filter market noise and provides clear visual entry and exit zones for your trading decisions. Core Features: Strictly Non-Repainting: The system is built with strict non-repaint logic. What you see on the chart is the true historical performance. Confirmed Signals: Signals are triggered and confirmed only after the candle closes . Once a trading arrow appears on a closed candle, it
DayTrader PRO MT4
Davit Beridze
4.6 (10)
DayTrader PRO MT5:  https://www.mql5.com/en/market/product/186222 O DayTrader PRO é um indicador de trading avançado que combina o Filtro de Laguerre de John Ehlers com um potente motor de otimização automática. Em vez de utilizar parâmetros fixos, o indicador procura automaticamente as melhores definições com base nas condições recentes do mercado, ajudando-o a adaptar-se à volatilidade variável sem necessidade de ajustes manuais constantes. O indicador gera sinais claros de COMPRA (BUY) e VEND
Indicator plots price cycle blocks and sends signals with smart volume confirmation. Price cycles and fractals are combined to determine the demand/supply blocks. The indicator can be used alone or combined with other Cycle Indicators Inputs: Period: Recommended value is between 35 and 55( Which are Set 1 and Set 2 periods of cycle sniper ) Engulfing: If true, you will be able to see the engulfing bar confirmation. Volume Filter: True (The  arrow comes with volume confirmation ) Videos with dif
Mais do autor
Market Profile TPO Market Profile TPO is a multi-period Time-Price-Opportunity (TPO) indicator for MetaTrader 5. It builds price profiles from time data and displays the Point of Control (POC), the Value Area (VAH and VAL), the Initial Balance (IB), Single Prints, a volume overlay and profile merging on the chart. It is written entirely in MQL4 and does not use DLLs or external files. What the indicator draws TPO profile: each price level is tagged with the time slice in which it traded. Display
Volume Profile: multi-mode, multi-profile, drawn on the price chart The indicator draws a volume profile directly on the price chart, together with the Point of Control (POC) line, the Value Area (VAH and VAL) and optional peaks and valleys. Instead of reading volume in a separate bottom panel, the volume is shown at the price levels where it was traded, so price and volume can be read in one place. What the indicator displays POC (Point of Control) line : the price level with the highest traded
Volume Bubbles version MT5
Cesar Sebastian Rosales Ibarra
Volume Bubbles  See the volume outliers and divergence bars — before they reverse on you. Volume Bubbles — on-chart volume spike detector with divergence arrows. Most volume tools dump a histogram at the bottom of your screen and leave you to guess which bars actually mattered. Volume Bubbles puts the answer directly on the chart: a bubble on the bar, sized by how unusual the volume was, colored by what that volume means, with an arrow when the volume story disagrees with the price story. Wha
Market Profile TPO Market Profile TPO is a multi-period Time-Price-Opportunity (TPO) indicator for MetaTrader 4. It builds price profiles from time data and displays the Point of Control (POC), the Value Area (VAH and VAL), the Initial Balance (IB), Single Prints, a volume overlay and profile merging on the chart. It is written entirely in MQL4 and does not use DLLs or external files. What the indicator draws TPO profile: each price level is tagged with the time slice in which it traded. Display
Anchored VWAP plus Bands MT4
Cesar Sebastian Rosales Ibarra
Anchored VWAP — 5 draggable anchors with deviation bands Volume-weighted average price anchored to user-defined points on the chart. Drop an anchor where you want the VWAP to start — earnings, swing high/low, session open, any event — and the indicator recalculates from that bar forward. This indicator is available free of charge. What it does: Up to 5 independent anchors, each with its own VWAP line and color, running simultaneously on the same chart 2 configurable σ deviation bands (default ±1
FREE
Anchored VWAP plus Bands MT5
Cesar Sebastian Rosales Ibarra
Anchored VWAP — 5 draggable anchors with deviation bands Volume-weighted average price anchored to user-defined points on the chart. Drop an anchor where you want the VWAP to start — earnings, swing high/low, session open, any event — and the indicator recalculates from that bar forward. This indicator is available free of charge. What it does: Up to 5 independent anchors, each with its own VWAP line and color, running simultaneously on the same chart 2 configurable σ deviation bands (default ±1
FREE
Daily VWAP plus Bands MT4
Cesar Sebastian Rosales Ibarra
VWAP - Volume Weighted Average Price Stop guessing the day's fair price. See it. P eriod VWAP with deviation bands and forward projection — for traders who need institutional reference levels on every timeframe. VWAP is the single most-watched level by institutions, prop desks, and algorithmic traders. Not because it's magic — because it's the price the market actually paid. This indicator puts 5 VWAP period modes (Daily / Weekly / Monthly / Quarterly / Yearly) on your chart with 4 deviation ban
Dynamic Volume Profile MT4
Cesar Sebastian Rosales Ibarra
Box Volume Profile Box Volume Profile draws a volume histogram inside any rectangle you place on the chart. Choose a time window and a price range, and the indicator shows how much volume was traded at each price level inside that zone. It also plots the Point of Control (POC) and the Value Area boundaries (VAH and VAL). How to use Press the draw hotkey (the letter V by default) and drag a rectangle anywhere on the chart. The volume profile appears immediately inside the box. Move or resize the
Daily VWAP plus Bands MT5
Cesar Sebastian Rosales Ibarra
VWAP - Volume Weighted Average Price Stop guessing the day's fair price. See it. Period VWAP with deviation bands and forward projection — for traders who need institutional reference levels on every timeframe. VWAP is the single most-watched level by institutions, prop desks, and algorithmic traders. Not because it's magic — because it's the price the market actually paid. This indicator puts 5 VWAP period modes (Daily / Weekly / Monthly / Quarterly / Yearly) on your chart with 4 deviation ba
Volume Profile  Stop guessing where the real money traded. See it. Volume Profile — multi-mode, multi-profile, with POC / Value Area / Peaks & Valleys drawn directly on your chart. Most volume tools dump a histogram at the bottom of your screen and make you guess which price level actually carried the volume. Volume Profile puts the volume where the price is — on the chart, at the price levels where money actually changed hands. You see the value area, the control point, the rejection tails, an
Dynamic Volume Profile MT5
Cesar Sebastian Rosales Ibarra
Box Volume Profile Box Volume Profile draws a volume histogram inside any rectangle you place on the chart. Choose a time window and a price range, and the indicator shows how much volume was traded at each price level inside that zone. It also plots the Point of Control (POC) and the Value Area boundaries (VAH and VAL). How to use Press the draw hotkey (the letter V by default) and drag a rectangle anywhere on the chart. The volume profile appears immediately inside the box. Move or resize the
Filtro:
Sem comentários
Responder ao comentário