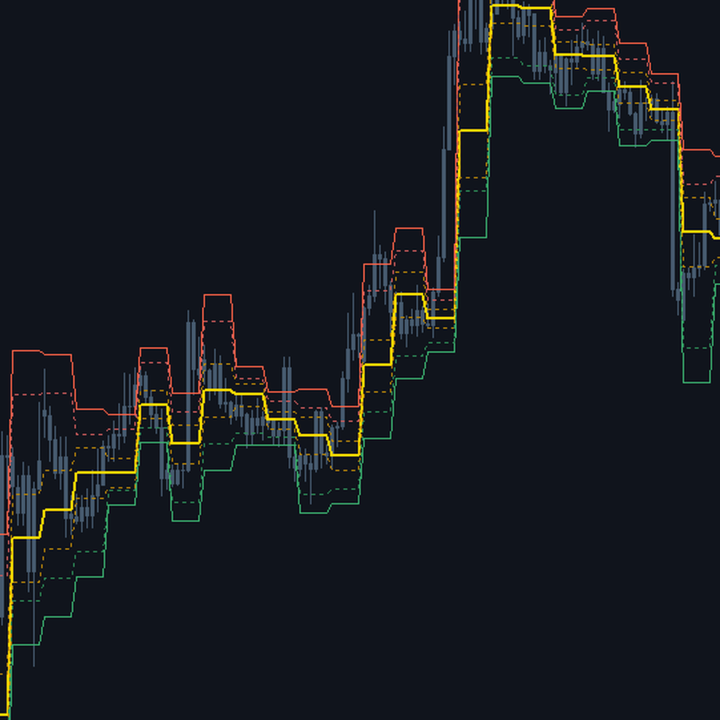
Dynamic PivotZones
- Indicadores
- Versão: 1.0
- Ativações: 5

# Dynamic Pivot Zones - Pivots as zones, not lines
*Category: Support and Resistance | Difficulty: beginner | Window: chart window (overlaid on price) | Markets: Universal (Forex, indices, commodities, crypto, stocks) | Suggested timeframes: M5, M15, M30, H1*
## Short description
> Turns pivots into zones whose width depends on the previous period volatility. The levels stay fixed for the whole session, with no recalculation.
## Full description
### Overview
Classic pivots are infinitely thin lines, while the market reacts to zones: price rarely turns exactly on the level, it almost always overshoots slightly or stops just before. This indicator turns the pivot into a band whose width depends on the volatility of the period that generated it: after a quiet day the zone is narrow, after an agitated one it is wide, which is exactly the sensible behaviour. The second characteristic, less eye-catching but equally important, is that the levels are computed on the data of the fully closed previous period and stay fixed for the entire current period. This guarantees a drawn level is never moved, a substantial difference from many implementations that recompute pivots during the session and therefore show a history that never existed in real time.
### How the calculation works
1. The period change is recognised by comparing the date of the current bar with that of the previous one.
2. The central pivot is the average of high, low and close of the previous period, following the classic formula.
3. The first resistance is twice the pivot minus the previous low, the first support twice the pivot minus the high.
4. The zone width is a fraction of the previous period range, defined by InpZoneFactor.
5. A minimum ATR width guarantee prevents degenerate zones after an exceptionally flat day.
6. All levels are computed once at the period change and untouched until the next period.
### How to use it
- Treat the zones as reaction areas, not exact lines: this is how the market actually uses them.
- A wide zone indicates the previous period was agitated: reactions will be less precise and stops must be widened.
- Price opening inside the pivot zone describes an initially undecided session.
- Fully clearing a zone, rather than just the central level, is a far more meaningful break.
- Since the levels are fixed for the whole session, they can be used directly to place pending orders at the open.
### Who it is for and on which timeframes
It targets intraday traders who already use pivots and have experienced their limit: price turning two or three pips before or after the level. It works from M5 to H1, where the session concept makes sense. It requires no background: anyone familiar with classic pivots can use it immediately, and those unfamiliar find a standard, documented formula. The main advantage emerges on markets alternating quiet and agitated days.
### Practical example of reading a signal
On US500 M15 the previous session was very agitated, with a forty point range. The zone around the pivot comes out six points wide. Price falls towards the pivot, enters the zone, travels nearly its full width and then turns back up from the lower edge. Anyone using a single line pivot would have seen the level violated and exited; whoever read the zone understood the reaction was under way and held the position. The next day, after a quiet session with a twelve point range, the zone narrows to under two points and the reaction is far more precise.
## Input parameters
| Parameter | Default | Description |
|---|---|---|
| `InpZoneFactor` | 0.15 | Zone width as a fraction of the previous period range. Internally capped at half the range. |
| `InpMinZoneAtr` | 0.20 | Minimum zone width, in ATR. It prevents degenerate zones after an exceptionally flat day. |
| `InpAtrPeriod` | 30 | ATR period used for the minimum width guarantee. |
## Advantages / strengths
- The zones reflect how the market actually reacts to levels, instead of demanding point precision.
- The width adapts automatically to the volatility of the period that generated the levels.
- The levels stay strictly fixed for the whole session: no recalculation and no repaint.
- Only three parameters and a documented standard formula: it takes minutes to learn.
## Limitations and warnings
- It uses the classic pivot formula, which is a convention with no particular theoretical foundation.
- It draws only the first resistance and support level: those who also use the second and third will not find them.
- The day change depends on the broker server time and may not coincide with the reference market open.
- On timeframes above H1 the session logic progressively loses meaning.
**No repaint:** values printed on a closed bar are never modified afterwards.
**Disclaimer.** This product is a technical analysis tool, not an automated trading system, and it offers no profit guarantee whatsoever. Financial markets carry the risk of total loss of the invested capital. Past performance is not indicative of future results. Every signal must be confirmed with your own analysis, a money management plan and prior testing on a demo account. The author is not responsible for trading decisions taken on the basis of this indicator.
## Suggested tags / keywords for MQL5
`pivot`, `zones`, `intraday`, `support resistance`, `session`, `volatility`, `no repaint`, `levels`