Trend Persistence Index
- Indicadores
- Versão: 1.0
- Ativações: 5

# Trend Persistence Index - Persistence versus randomness
*Category: Trend | Difficulty: advanced | Window: separate window below the chart | Markets: Universal (Forex, indices, commodities, crypto, stocks) | Suggested timeframes: M30, H1, H4, D1*
## Short description
> Compares the direction changes actually observed with those expected from a purely random series. Above zero the market persists in one direction, below zero it keeps flipping.
### Overview
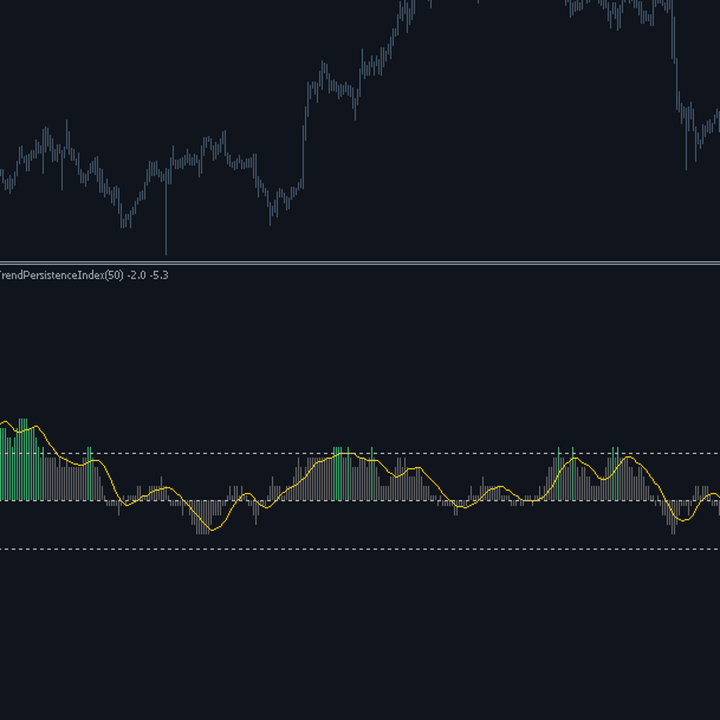
In a random walk the sign of the price change flips on average once every two bars. That is a mathematical property, not an opinion, and it gives a free yardstick for telling whether what we see on the chart is structure or just chance. Trend Persistence Index counts the actual sign changes over a rolling window and compares them with that expected value. If the market changes direction far less often than predicted the index rises above zero: we are in a persistent regime where continuation strategies make sense. If it flips far more often the index falls below zero: we are in a mean reverting regime where fading extremes beats chasing.
### How the calculation works
1. On each bar of the window the sign of the close to close change is computed.
2. Bars with exactly zero change are skipped or treated as continuation depending on InpIgnoreDoji: on illiquid markets the difference matters.
3. Actual sign changes and the number of valid comparisons performed are counted.
4. The expected value under randomness is exactly half the valid comparisons. The index is the percentage deviation from that value.
5. The result is clamped between -100 and +100 and accompanied by a signal average that highlights its underlying tendency.
6. If fewer than five valid comparisons are available the value is zeroed: on too sparse data the statistic is not reliable.
### How to use it
- Use it as a strategy selector, not as a signal: above the positive threshold apply breakout and continuation logic, below the negative one apply mean reversion logic.
- The central grey zone is the worst case: the market behaves like a random series and neither family of strategies holds an edge.
- A shift from clearly negative to positive values often flags the exit from a range before it becomes visible on price.
- Comparing the value across two timeframes of the same instrument helps choose which one to trade: pick the one with higher persistence.
- Do not read direction into this indicator: it tells how much the market persists, not which way it goes. Always pair it with a directional filter.
### Who it is for and on which timeframes
This is a tool for experienced traders and system developers, not for those looking for entry arrows. Its value lies in deciding which family of strategies to apply at a given moment, a decision usually made on intuition. It works on timeframes from M30 up, where the close to close change carries more information than the spread. On very low timeframes the sign of the change is largely microstructure and the index tends to stay persistently negative, which is correct but of little use.
### Practical example of reading a signal
On USDJPY H1 the index oscillates for two weeks between -30 and -10, with the signal average steadily negative: the market flips more often than chance, and indeed the chart shows a range where every breakout attempt fails back. Anyone buying breakouts lost repeatedly. Then within three days the index climbs to +35 and the signal average crosses zero. From that point price leaves the range and builds a continuous trend. The operational message is not to buy or sell, but to change method: stop fading breakouts and start holding continuation positions.
## Input parameters
| Parameter | Default | Description |
|---|---|---|
| `InpLookback` | 50 | Number of bars the statistic is counted over. Below 30 the sample gets too small and the index noisy; above 100 it reacts to regime changes with heavy lag. |
| `InpSignalPeriod` | 10 | Period of the signal average overlaid on the histogram, useful to read the index tendency while ignoring bar by bar wobble. |
| `InpThreshold` | 20.0 | Symmetric threshold beyond which the regime is deemed significant and the histogram is coloured. Higher values make the classification more selective. |
| `InpIgnoreDoji` | true | With true, zero change bars are excluded from the count; with false they are treated as a continuation of the previous direction. |
## Advantages / strengths
- The reference is not an arbitrary parameter but a known theoretical value: the comparison has a precise statistical meaning.
- It answers a question almost no other indicator addresses: which type of strategy makes sense right now on this market.
- It is independent of price scale: it only counts signs, so it works identically on any instrument with no calibration.
- No repaint and no dependency on other indicators.
## Limitations and warnings
- It gives no directional information at all: used alone it cannot be traded.
- Like every rolling window statistic it lags regime changes, the more so the longer the window.
- On low timeframes spread and microstructure bias the sign count downwards.
- It requires a minimum understanding of what a random series is: without that background the values risk being read as trend strength, which they are not.
**No repaint:** values printed on a closed bar are never modified afterwards.
**Disclaimer.** This product is a technical analysis tool, not an automated trading system, and it offers no profit guarantee whatsoever. Financial markets carry the risk of total loss of the invested capital. Past performance is not indicative of future results. Every signal must be confirmed with your own analysis, a money management plan and prior testing on a demo account. The author is not responsible for trading decisions taken on the basis of this indicator.
## Suggested tags / keywords for MQL5
`statistics`, `regime`, `mean reversion`, `trend filter`, `random walk`, `persistence`, `no repaint`, `market state`