Volatility Regime Classifier
- Indicadores
- Versão: 1.0
- Ativações: 5

# Volatility Regime Classifier - Classification with hysteresis
*Category: Volatility | Difficulty: intermediate | Window: separate window below the chart | Markets: Universal (Forex, indices, commodities, crypto, stocks) | Suggested timeframes: M15, M30, H1, H4, D1*
## Short description
> Classifies volatility into four regimes using a hysteresis state machine, eliminating the constant flipping typical of fixed thresholds. The active threshold is drawn.
### Overview
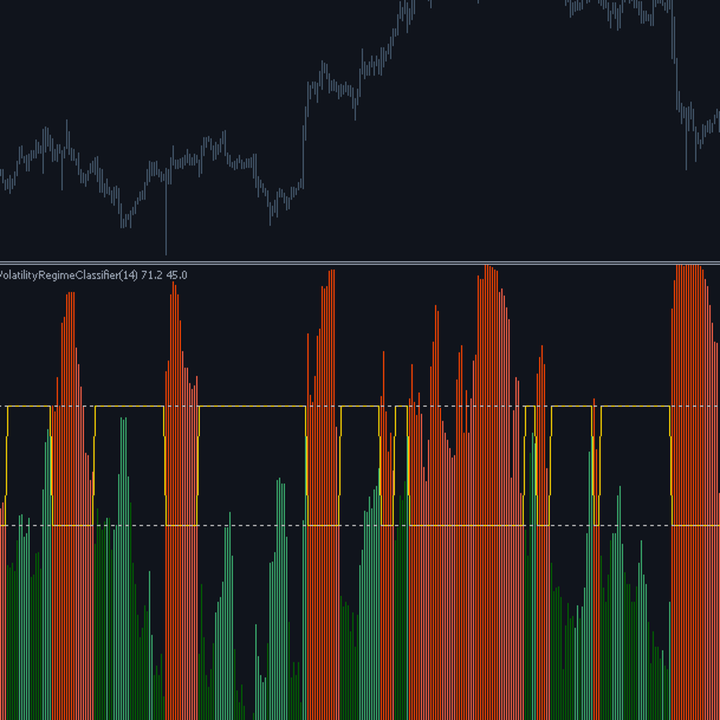
Classifying volatility with a fixed threshold produces a familiar and irritating flaw: when the value oscillates around the threshold the regime flips dozens of times within a few bars, making the classification useless precisely during transitions, which are the most interesting moments. Volatility Regime Classifier solves this with a state machine equipped with hysteresis. To enter the high volatility regime you must exceed a high threshold, but to leave it you must fall below a lower one. Between the two lies a dead band in which the regime stays as it was, no matter how much the value oscillates. The gold line shows which threshold is currently in force, making the internal state of the machine visible, something no fixed threshold classifier can do.
### How the calculation works
1. The current ATR is compared with the last InpHistory observations of that same ATR, counting how many are lower.
2. The count directly produces the percentile rank with no need to sort the window, hence in a single pass.
3. If the current state is low, the regime becomes high only by exceeding InpEnterHigh; if already high, it returns low only by falling below InpExitHigh.
4. If the two thresholds are set with no dead band the indicator recreates one automatically, because without it hysteresis would not exist.
5. The direction of volatility is obtained by comparing the current ATR with the one InpSlopeBars bars earlier.
6. The combination of level and direction produces four regimes, each with its own colour.
### How to use it
- High volatility rising is the most dangerous phase: cut position size and widen stops.
- High volatility falling is often the most profitable phase: movement is still there but risk is receding.
- Low volatility rising signals that compression is breaking: it is the early warning of a possible breakout.
- Low volatility falling is the phase to avoid: no movement and no immediate prospect.
- Watch the gold line to see how far the next regime change is: it is the distance to cover, not a fixed value.
### Who it is for and on which timeframes
It suits traders who switch strategies on and off according to market conditions, and those who have already tried fixed threshold classifiers and experienced their instability. It works on all timeframes from M15 up. The hysteresis concept is intuitive even without a technical background: it is the same principle as a home thermostat, which switches on below one temperature and off above another precisely to avoid constant cycling.
### Practical example of reading a signal
On USDJPY H1 the volatility rank rises to 72 and exceeds the entry threshold: the regime turns high and the gold line immediately drops to 45, which is now the level to break to go back. Over the next eight bars the rank oscillates between 62 and 78, crossing the value 70 several times: with a fixed threshold the regime would have flipped five times, here it stays steadily high. Only when the rank falls to 41, twelve bars later, does the regime return low and the gold line climb back to 70. The classification produced just two state changes instead of seven, and they are exactly the two that matter.
## Input parameters
| Parameter | Default | Description |
|---|---|---|
| `InpAtrPeriod` | 14 | Period of the ATR whose rank is measured. It defines which volatility scale is being classified. |
| `InpHistory` | 250 | History over which the percentile rank is computed. Long windows make the classification stable but slow to adapt. |
| `InpEnterHigh` | 70.0 | Percentile rank required to enter the high volatility regime. |
| `InpExitHigh` | 45.0 | Percentile rank required to leave it. The distance between the two thresholds is the dead band: the wider it is, the more stable the classification. |
| `InpSlopeBars` | 5 | Bars over which volatility is judged rising or falling. Low values make the direction nervous. |
## Advantages / strengths
- Hysteresis removes the main flaw of every threshold classification, instability in transition zones.
- The active threshold is drawn, so the internal state of the machine is always visible and verifiable.
- Four regimes instead of two, each with different and well defined operational implications.
- The percentile rank is computed by counting, hence in a single pass and without expensive sorting.
## Limitations and warnings
- Hysteresis introduces a lag in regime changes by construction: it is the price paid for stability.
- The two thresholds are user chosen values with no statistical justification: they must be tested on your own instrument.
- Volatility direction is judged on a simple fixed distance comparison, a crude measure compared with a proper slope estimate.
- It provides no directional information on price, only on the behaviour of volatility.
**No repaint:** values printed on a closed bar are never modified afterwards.
**Disclaimer.** This product is a technical analysis tool, not an automated trading system, and it offers no profit guarantee whatsoever. Financial markets carry the risk of total loss of the invested capital. Past performance is not indicative of future results. Every signal must be confirmed with your own analysis, a money management plan and prior testing on a demo account. The author is not responsible for trading decisions taken on the basis of this indicator.
## Suggested tags / keywords for MQL5
`volatility`, `regime`, `hysteresis`, `state machine`, `atr`, `percentile`, `no repaint`, `market state`